
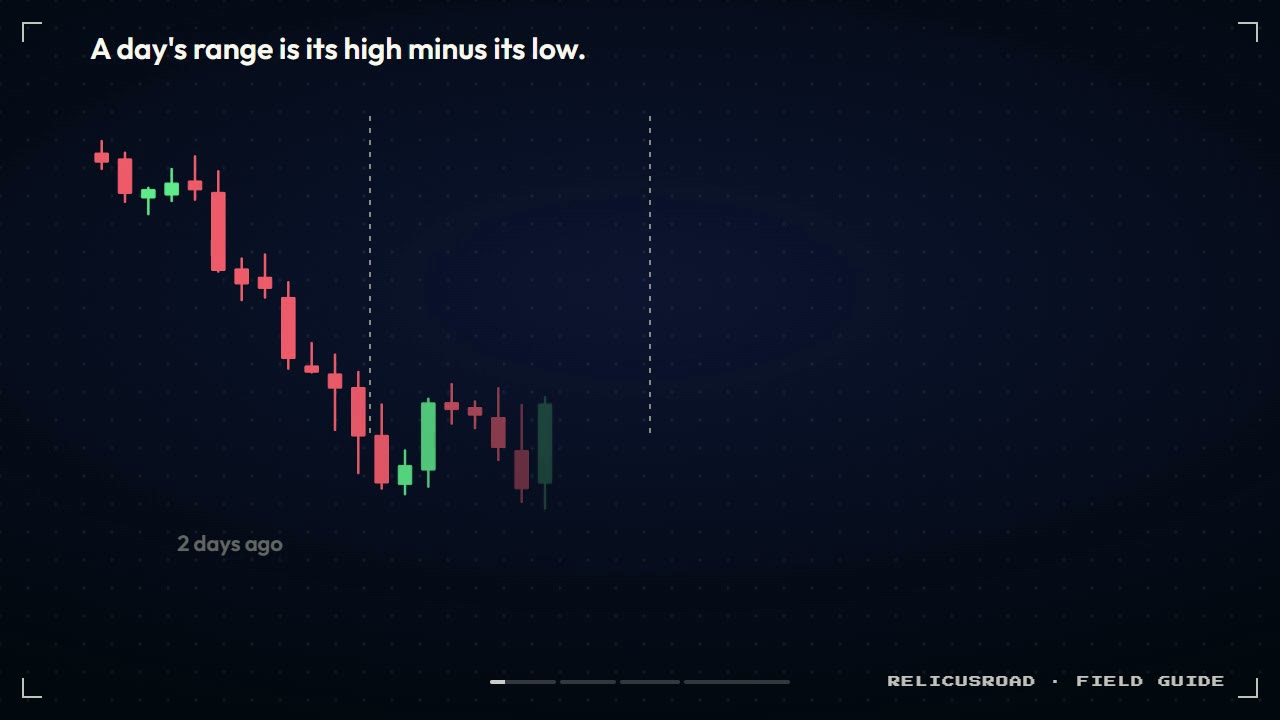
You bought a clean breakout at 3 p.m. It looked strong. Then price crawled a few pips, stalled, and drifted back to your stop. Nothing was wrong with the pattern. The pair had already travelled its usual daily distance before you clicked, and there was no fuel left for the move you paid for.
The average daily range indicator puts a number on that fuel. By the end of this guide you will be able to calculate ADR, read how much room today has left, and decide when a late entry is worth taking.
Key Findings
- ADR is the size of a typical day: it averages the high-to-low range of the last few completed daily candles.
- Room left is the practical reading: today's low plus one ADR marks where a normal day would top out, so the gap between price and that line is the room left.
- ADR skips gaps, ATR counts them: on a day that opens far from yesterday's close, ATR jumps and ADR barely moves.
- It plans, it does not predict: news days and trend days regularly run past one ADR, so it never replaces a stop.
What does the average daily range indicator measure?
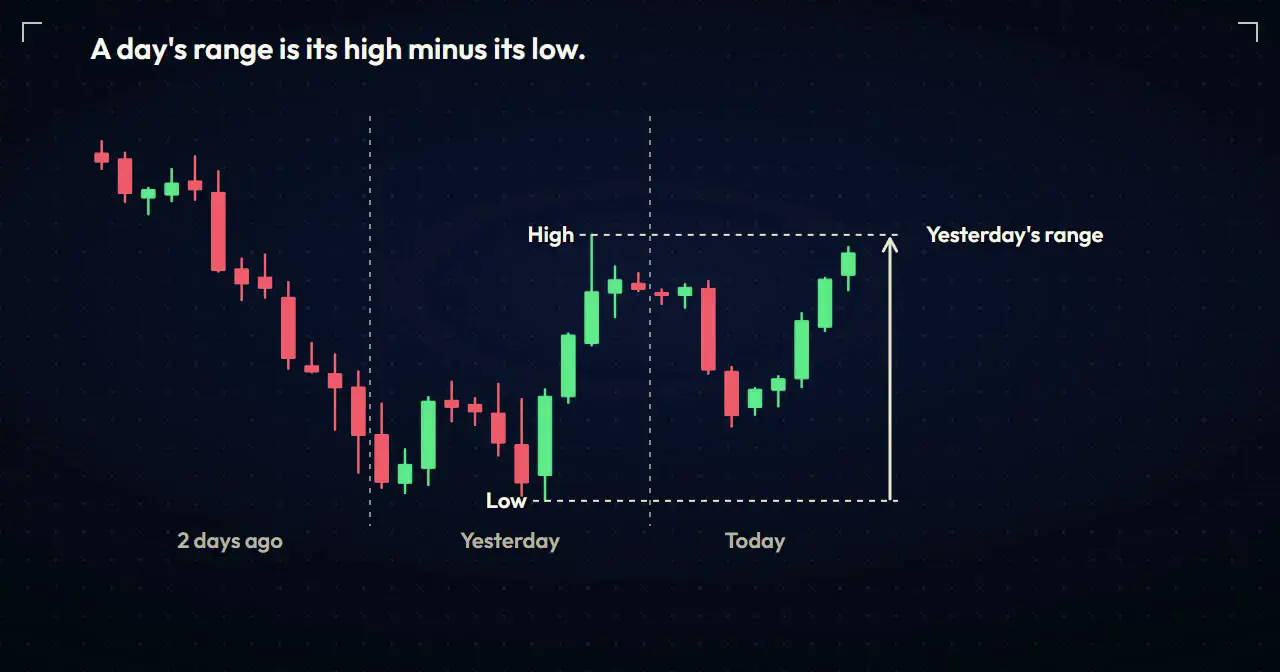
The average daily range indicator measures how far a market usually travels from its daily low to its daily high. It takes each completed day’s range, high minus low, and averages the last few of them. The answer is one number in pips or points: the size of a normal day for that pair.
That number matters because every intraday trade borrows from the same daily budget. A pair that usually covers a modest distance does not become generous because you found a nice setup late in the session.
ADR says nothing about direction. A falling day and a rising day of the same size count the same. It sizes the day; your chart reading still has to pick the side.
How do you calculate average daily range?
Subtract the low from the high on each of the last N completed daily candles, add the ranges, and divide by N. With a 10-day setting you average ten ranges. Leave today out, because its candle is still open and its high and low are not final.
Here is a made-up example so the arithmetic is clear. Suppose a pair’s last five daily ranges were these:
| Day | High minus low (pips) |
|---|---|
| Monday | 62 |
| Tuesday | 48 |
| Wednesday | 75 |
| Thursday | 55 |
| Friday | 60 |
| 5-day ADR | (62 + 48 + 75 + 55 + 60) / 5 = 60 |
- Monday
- 62
- Tuesday
- 48
- Wednesday
- 75
- Thursday
- 55
- Friday
- 60
- 5-day ADR
- (62 + 48 + 75 + 55 + 60) / 5 = 60
A typical day here is about 60 pips. If today’s low is in and price has already climbed 54 pips off it, only about 6 pips of a normal day remain.
How do you use ADR during the trading day?
Mark today’s low so far, add one ADR above it, and see how much distance is left between current price and that line. Do the mirror image from today’s high for a sell. The smaller the gap, the less a new entry in that direction can reasonably expect before the day is “full”.
In the clip, price has covered most of its typical day before the last candle, so the red band of room left is thin. A buy taken there needs an unusual day to reach any sensible target.
Three practical uses follow from that one measurement:
- Target sizing. Keep intraday targets inside the room left, especially late in the day, after the busy London and New York overlap.
- Stop sanity check. A stop wider than a full ADR on an intraday trade is really a multi-day position; size it like one.
- Session planning. When the Asian session alone has used a large share of the ADR, a London breakout has less distance to run. Our London breakout guide uses ADR as its target for exactly this reason.
ADR vs ATR: which one should you use?
Use ADR for intraday room and ATR for stops and position sizing across sessions. The difference is gaps. ADR only sees each day’s high minus low. ATR uses the true range, which also counts the jump between yesterday’s close and today’s price.
J. Welles Wilder introduced the true range and ATR in his 1978 book New Concepts in Technical Trading Systems, and the StockCharts ChartSchool entry on ATR walks through the same three true-range cases.
Both lines run close together until the gap, then ATR steps up while ADR stays flat, because nothing about the gap day’s own high and low was unusual.
| Average daily range (ADR) | Average true range (ATR) | |
|---|---|---|
| What it averages | High minus low of each day | True range: includes gaps from the prior close |
| Smoothing | Plain average of N days | Wilder’s smoothing, slower to react |
| Timeframe | Daily candles only | Any timeframe |
| Best question it answers | How much room is left today? | How far could price swing against my stop? |
| Weak spot | Blind to weekend and news gaps | Runs high after gaps, which can oversize stops |
- Average daily range (ADR)
- High minus low of each day
- Average true range (ATR)
- True range: includes gaps from the prior close
- Average daily range (ADR)
- Plain average of N days
- Average true range (ATR)
- Wilder’s smoothing, slower to react
- Average daily range (ADR)
- Daily candles only
- Average true range (ATR)
- Any timeframe
- Average daily range (ADR)
- How much room is left today?
- Average true range (ATR)
- How far could price swing against my stop?
- Average daily range (ADR)
- Blind to weekend and news gaps
- Average true range (ATR)
- Runs high after gaps, which can oversize stops
For a deeper look at the stop side, see our ATR stops guide.
Which ADR setting and daily candle should you trust?
Pick a lookback that fits how long your trades last, and check that your broker’s daily candles are real trading days. A short window, about a week, reacts quickly after volatility changes. A month-long window is steadier but notices a new regime late.
The candle check is the part most guides skip. Brokers whose server clock is not aligned to the New York close often print a short Sunday candle. That thin day counts as a full day in the average and drags ADR down, so the room left looks bigger than it is. Look at a week of daily bars: five candles is what you want. If you see six, count ranges by hand or pick an ADR build that skips Sundays.
When does the ADR reading mislead you?
ADR misleads most on days when the reason for trading is new information. It describes the past few days, not today’s calendar. A central bank decision or the US jobs report, which the Bureau of Labor Statistics publishes at 8:30 a.m. Eastern on its Employment Situation release schedule, can push a pair well past one ADR in minutes.
The order matters: the news check comes before the arithmetic, because on a release day the room-left number is the least reliable thing on your chart.
Treat a used-up ADR as a reason not to start a new trade in that direction, not as a reason to take the other side. If you want to trade against the move, you still need a real level, a close that confirms it, and a stop beyond the day’s extreme. Our guide to daily high and low trading covers those levels.
The history does not repaint. Past ADR values come from completed days, so they stay fixed. Only today’s progress moves, because today’s high and low are still forming.
Where RelicusRoad Pro fits
ADR tells you how big a normal day is. It does not show where yesterday’s range sat or which level price is testing right now. RelicusRoad Pro includes the Daily High Low tool, which carries yesterday’s high, low and today’s open across every intraday bar on MT4 and MT5, so you can hold today’s move up against both yesterday’s range and your ADR at a glance. Its signals are fixed once a candle closes. Your stop and position size still decide what a loss costs.
Frequently asked questions
What is the average daily range indicator?
The average daily range indicator, or ADR, takes the high minus the low of each of the last few trading days and averages them. The result is the size of a typical day for that instrument, usually shown in pips or points. Traders use it to judge whether today’s move is still normal or already larger than usual, and to set intraday targets that fit how far the market tends to travel.
How do you calculate average daily range?
Write down the high and the low of each of the last N completed daily candles, subtract the low from the high for each day, add those ranges together and divide by N. With a 10-day setting you add ten ranges and divide by ten. Use completed days only. Today’s candle is still open, so its range is not final and does not belong in the average.
What is the difference between ADR and ATR?
ADR averages each day’s high minus low. ATR, the average true range from J. Welles Wilder’s 1978 book, uses the true range, which also counts any gap between yesterday’s close and today’s price. On a day that opens far from the previous close, ATR rises and ADR does not. ATR also uses Wilder’s smoothing rather than a plain average, so it reacts a little more slowly.
What is a good ADR setting?
There is no single correct number. A short lookback, around one trading week, follows fresh changes in volatility but jumps around after one big day. A longer lookback, around a month, is steadier but slow to notice that a quiet market has woken up. Pick one, keep it fixed, and learn what normal looks like on your pair before you act on the reading.
Does the ADR indicator repaint?
A correctly built ADR does not repaint its history. Each past value comes from completed days, so it stays fixed once the day closes. The only moving part is today’s progress, how much of the ADR price has covered so far, which updates as today’s high and low change. If past ADR values shift after you reload the chart, the indicator is using the open day or is badly built.
Want yesterday’s range and today’s open on every bar while you measure the room left? See what’s inside RelicusRoad Pro.
Written for RelicusRoad by RelicusDigital.com.
Keep going on this topic
The Best Trading Indicators for MT4, MT5 and TradingView in 2026
An honest breakdown of trading indicators for MT4, MT5 and TradingView: which categories add real edge, which are noise, and how many you actually need.
- EMA vs SMA: Which Moving Average Fits Your Trading?
- Chande Kroll Stop Indicator: Read Both Stop Lines
- Awesome Oscillator Indicator: How to Read Momentum Without the False Signals
- Balance of Power Indicator: Read Buying vs Selling Pressure
- Bollinger %B Indicator: Read Band Position, Not Guesses
- Camarilla pivot points: how the reversal and breakout levels work
- The CCI Indicator: Reading the Commodity Channel Index Without Chasing
- Chaikin Money Flow Indicator: How to Read Buying and Selling Pressure
- Chaikin oscillator indicator: reading the volume behind a move
- The Chande Momentum Oscillator: A Cleaner Read on Momentum Than RSI?
- Chandelier Exit Indicator: How to Trail Stops Without Getting Shaken Out
- Choppiness Index Indicator: How to Spot Trending vs Ranging Markets
- Connors RSI indicator: a plain guide to the mean-reversion oscillator
- Coppock curve indicator: how to read the market's slowest buy signal
- Darvas Box Indicator: How the Box Breakout Works (and Where It Fails)
- DEMA vs TEMA: which fast average lags less?



