
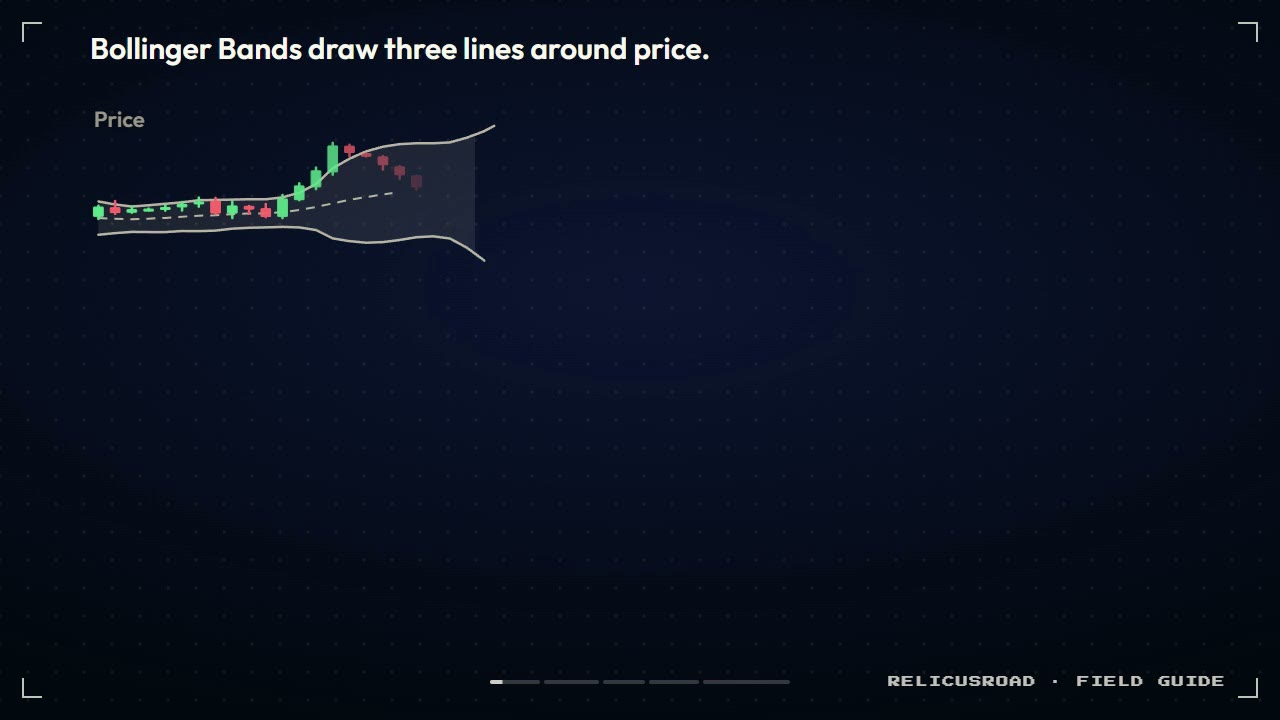
You see price pinned against the upper Bollinger Band and your eye says “stretched”. Then it closes above the band again, and again. Was that stretch or strength? Eyeballing the bands cannot settle it, because the bands themselves keep moving.
The Bollinger %B indicator answers one narrow question with one number: where did this candle close inside the bands? By the end of this guide you will know what readings above 1 and below 0 tell you, when to leave them alone, and how to spot the W-bottom that John Bollinger described.
Key Findings
- %B is band position as a number: 1 means the close sat on the upper band, 0.5 on the middle band, and 0 on the lower band.
- Outside the bands is a question, not a trade: a close above 1 or below 0 often marks trend strength, so check that volume or momentum is weakening before you trade against it.
- Position and width are different reads: %B tracks where price sits, BandWidth tracks how far apart the bands are, and each misses what the other shows.
- A settled %B value never changes: it comes from closed candles, so any history that shifts after a reload means the tool is built wrong.
What does the Bollinger %B indicator measure?
%B measures where the last close sits between the lower and upper Bollinger Bands, scaled so the lower band is 0 and the upper band is 1. To get it, subtract the lower band from the close, then divide by the distance between the two bands.
John Bollinger introduced %B alongside BandWidth as two indicators derived from his bands, and set out how to use them in his 2001 book Bollinger on Bollinger Bands (Wikipedia summary; BollingerBands.com). The bands underneath are a moving average with an envelope set by standard deviation, the width engine we unpacked in the standard deviation indicator guide.
Watch the lower panel. When price touches the lower band, %B sits at 0. When price closes above the upper band, %B pokes above 1. The value is unbounded, so it can go past either edge.
How do you read %B above 1 or below 0?
A close above 1 or below 0 means price finished outside a band. That tells you the move was large relative to recent volatility. It does not tell you the move is finished, and in a trend it usually means the opposite.
This is the reading that costs traders money. The bands are statistical, not a ceiling, and in a strong trend price can keep closing along the upper band for many candles while %B stays near or above 1. Selling every close above 1 is the same mistake as selling every time price rides the upper Keltner Channel line, which we covered in the Keltner Channel guide.
In Bollinger on Bollinger Bands (2001), Bollinger recommends confirming band signals with an indicator that is not built from the same data, and names volume indicators as a good fit (BollingerBands.com). The Money Flow Index is a common partner because it weighs price moves by volume.
Neither branch is a trade on its own. If MFI rises with price, do not sell against the move; if it falls, wait for price to close back inside the band before acting.
%B vs BandWidth vs RSI: which question does each answer?
%B answers “where is price inside its volatility range?” BandWidth answers “how wide is that range?” and RSI answers “how strong has recent momentum been?” They look alike on a chart pane but measure different things.
| Indicator | What it measures | Typical use | Blind spot |
|---|---|---|---|
| Bollinger %B | Close position between the bands | How far price has run, relative highs and lows, W-bottoms | Says nothing about band width |
| Bollinger BandWidth | Band width relative to the middle band | Spotting contraction before expansion | Says nothing about where price sits |
| RSI | Ratio of recent gains to losses | Momentum and divergence | Ignores volatility bands entirely |
| Stochastic | Close position within the high-low range | Range timing | Uses raw range, not standard deviation |
- What it measures
- Close position between the bands
- Typical use
- How far price has run, relative highs and lows, W-bottoms
- Blind spot
- Says nothing about band width
- What it measures
- Band width relative to the middle band
- Typical use
- Spotting contraction before expansion
- Blind spot
- Says nothing about where price sits
- What it measures
- Ratio of recent gains to losses
- Typical use
- Momentum and divergence
- Blind spot
- Ignores volatility bands entirely
- What it measures
- Close position within the high-low range
- Typical use
- Range timing
- Blind spot
- Uses raw range, not standard deviation
%B and the stochastic look like cousins because both measure position inside a range. They differ in the range they use. The stochastic uses the highest high and lowest low, while %B uses bands that widen and shrink with volatility. If you trade the contraction side, the Bollinger squeeze strategy is where BandWidth does its work.
How does the W-bottom show up on %B?
A W-bottom on %B is a higher low while price makes a lower low. The first low closes below the lower band, so %B dips under 0. The second low goes lower in price but holds inside the band, so %B stays above 0.
That is the pattern Bollinger described for W-bottoms in his book, and %B makes it easier to see than the bands alone. On the price chart the two lows can look almost identical. On %B the difference is plain.
The second low sitting inside the band suggests selling pressure is weakening relative to volatility. It is a setup, not an entry. Many traders wait for price to close back above the middle band before they consider buying, and place the stop under the second low. In a sideways market, the mean reversion trading strategy uses the middle band the other way round, as the target.
The mirror image, an M-top, works the same way upside down: a first high above 1, then a second high that fails to reach the upper band.
What settings should you use for %B?
%B uses whatever settings the Bollinger Bands use, and the standard is a 20-period moving average with bands two standard deviations away. Change the bands, never the %B formula, and keep both panes on identical settings.
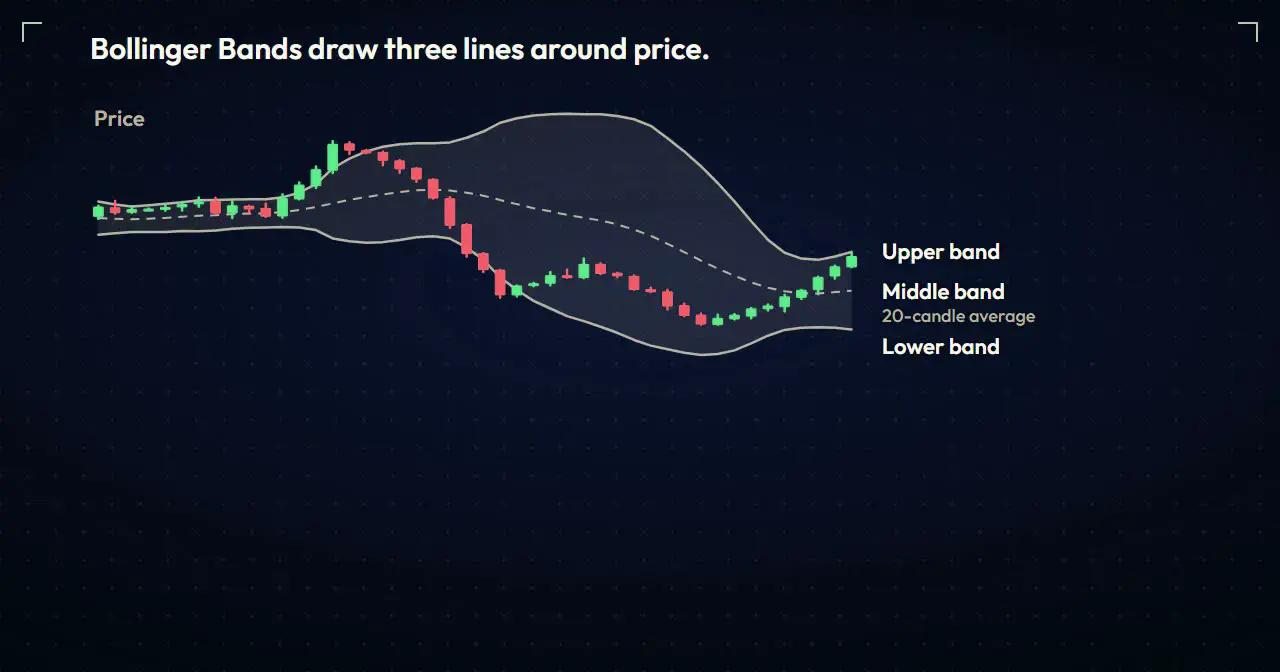
A longer period makes %B slower and less jumpy, so extremes are rarer and carry more weight. A shorter period hits 0 and 1 more often, which suits range work but floods a trend with false alarms. Pick one setting per timeframe and leave it, because a %B reading only means something against its own history.
Can you trust %B on a live chart?
A correctly built %B does not repaint. It uses the close and bands built from completed candles, so once a candle closes its %B value is locked.
While the current candle is still open, its %B moves with every tick. That is normal and not repainting. The warning sign is history that changes: mark a past %B value, reload the chart, and check it is still there. We walked through that test in the non-repaint indicator explainer.
Where does RelicusRoad Pro fit next to %B?
%B tells you how far a close has run from the average. It does not tell you where a trade is wrong. RelicusRoad Pro is built for that second job: its levels and signals are fixed once the candle closes, so the stop and target you plan against do not shift after you commit.
Our view is simple. An oscillator like %B shows you how far price has run, while the plan around it, including position size, the stop, and where you step aside, still decides the outcome. RelicusRoad Pro runs on MT4, MT5 and TradingView, which lets you check a %B read and a level on the platform you already use.
Frequently asked questions
What is the Bollinger %B indicator? Bollinger %B is an oscillator that shows where the latest close sits relative to the Bollinger Bands. It divides the distance from the lower band to price by the full width of the bands. A value of 1 means price is on the upper band, 0.5 means it is on the middle band, and 0 means it is on the lower band. It turns a visual judgement into one comparable number.
What does it mean when %B is above 1? A %B reading above 1 means the close finished above the upper Bollinger Band. On its own it is not a sell signal. In a strong trend price can close outside the band for several candles in a row. Treat it as a question. If volume and momentum rise with price, the move is strong; if they weaken, the move may be running out, so wait before you act.
What is the difference between %B and Bollinger BandWidth? %B measures position, meaning where price sits between the bands. BandWidth measures width, meaning how far apart the bands are relative to the middle band. %B helps you judge how far price has run and spot relative highs and lows. BandWidth helps you spot contraction before a volatility expansion. Neither one gives direction by itself, so traders often watch both.
What are the best settings for Bollinger %B? %B inherits its settings from the Bollinger Bands underneath it, and the common default is a 20-period simple moving average with bands two standard deviations away. Change the band settings, not the %B formula. A longer period gives a slower, calmer reading; a shorter one reaches the extremes more often. Keep the same settings on the bands and on %B so the two always agree.
Does the Bollinger %B indicator repaint? A correctly built %B does not repaint. It uses the closing price and bands calculated from completed candles, so once a candle closes its %B value is fixed. The current candle’s value moves while that candle is still open, which is normal. If past values change after a reload, the tool is not built correctly and should not be trusted for signals.
Use %B to see how far price has run, then put your stop where the idea is wrong. See how RelicusRoad Pro fixes its levels at the close →
Written for RelicusRoad by RelicusDigital.com.
Keep going on this topic
The Best Trading Indicators for MT4, MT5 and TradingView in 2026
An honest breakdown of trading indicators for MT4, MT5 and TradingView: which categories add real edge, which are noise, and how many you actually need.
- Envelopes indicator: how to size and trade MA envelopes
- Standard Deviation Indicator: How to Read Market Volatility
- Camarilla pivot points: how the reversal and breakout levels work
- The CCI Indicator: Reading the Commodity Channel Index Without Chasing
- Chaikin Money Flow Indicator: How to Read Buying and Selling Pressure
- Chaikin oscillator indicator: reading the volume behind a move
- The Chande Momentum Oscillator: A Cleaner Read on Momentum Than RSI?
- Chandelier Exit Indicator: How to Trail Stops Without Getting Shaken Out
- Choppiness Index Indicator: How to Spot Trending vs Ranging Markets
- Connors RSI indicator: a plain guide to the mean-reversion oscillator
- Coppock curve indicator: how to read the market's slowest buy signal
- Darvas Box Indicator: How the Box Breakout Works (and Where It Fails)
- DEMA vs TEMA: which fast average lags less?
- The DeMarker Indicator: Reading Exhaustion Before Price Turns
- Detrended price oscillator: reading market cycles without chasing trend
- The Donchian Channel Indicator: A Trader's Guide to Breakouts That Hold



