
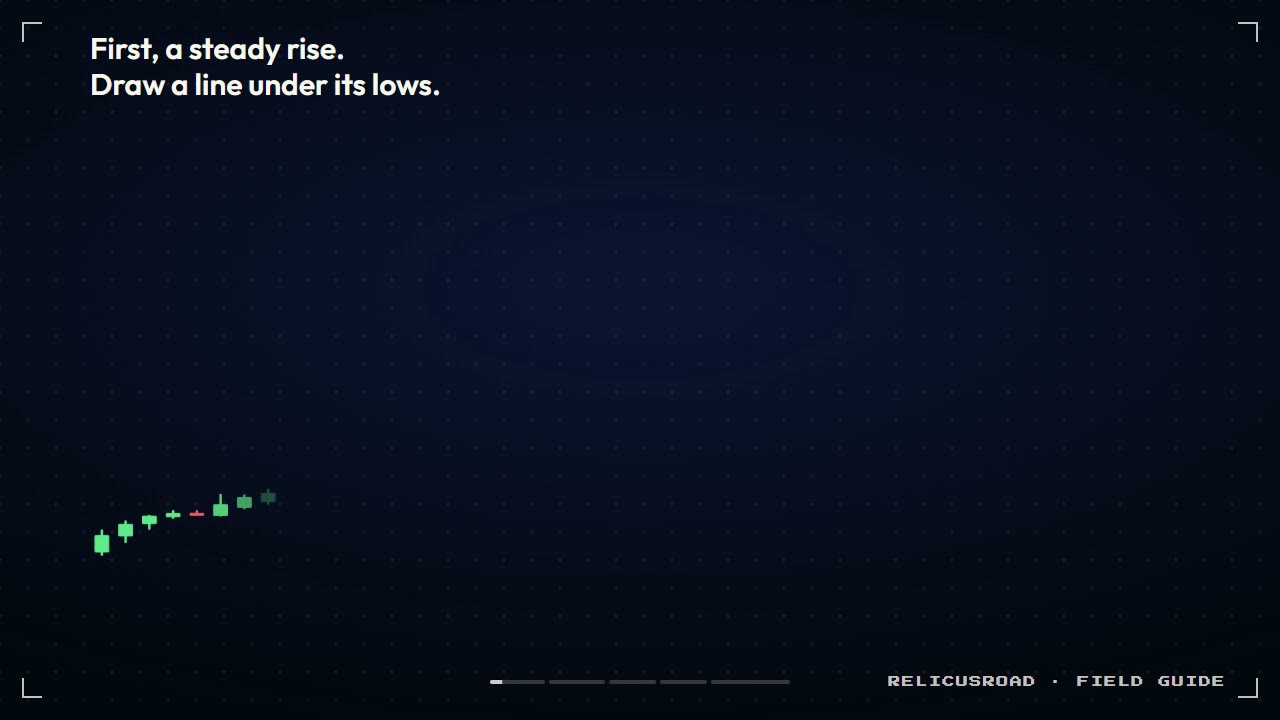
You saw the rally go vertical and sold the top. Price kept climbing for three more candles, your stop went, and only then did the whole thing collapse. The read was right. The timing was a guess.
The bump and run reversal pattern is built for exactly that situation. A steady trend speeds up into a steep “bump”, tops out, and then falls back through the trendline it started from. The pattern tells you to wait for that trendline break instead of picking the top. By the end, you’ll be able to mark the three phases live and know where the sell, the stop and the first target go.
Key Findings
- Three phases: a gentle lead-in rise along a trendline, a much steeper bump, and a run that falls back through that trendline.
- The bump is not the sell: a steep rise warns that buyers are getting carried away, but it can keep going for longer than your stop allows.
- The close is the signal: the trade starts when a candle closes below the lead-in trendline, after the bump has already topped.
- The bump start is the first target: price often falls back to the low where the fast rise began.
What is a bump and run reversal pattern?
It is a trend that speeds up too much and then breaks. Price rises at a steady pace along a trendline, then suddenly climbs far faster. When that steep rise ends, price drops back through the original line and keeps going. The three parts are called the lead-in, the bump and the run.
Thomas Bulkowski introduced the pattern in Technical Analysis of Stocks & Commodities magazine in 1997 and later gave both versions their own chapters in Encyclopedia of Chart Patterns (2nd edition, 2005). His bump and run reversal top page sets out the identification rules this post follows. The idea behind it is simple. The lead-in is normal buying. The bump is excitement, often after news, when late buyers pile in. The run is what happens when they stop.
Watch the order in that clip. The line comes first, the bump second, and the trade only after a candle closes below the line.
How do you spot the three phases?
Draw the lead-in line first, before anything looks exciting. Connect at least two lows of the steady rise. Then watch for a section that climbs much faster than that line. Bulkowski’s guideline is that the bump should rise at least twice as high above the trendline as the lead-in ever did.
| Phase | What you see | What it means | What you do |
|---|---|---|---|
| Lead-in | Steady rise, lows sitting on one line | Normal, orderly buying | Draw the trendline under the lows |
| Bump | Price climbs much faster, candles get bigger | Late buyers rushing in | Wait. Don’t sell the top |
| Run | A candle closes below the lead-in line | The rush is over | Sell on that close |
- What you see
- Steady rise, lows sitting on one line
- What it means
- Normal, orderly buying
- What you do
- Draw the trendline under the lows
- What you see
- Price climbs much faster, candles get bigger
- What it means
- Late buyers rushing in
- What you do
- Wait. Don’t sell the top
- What you see
- A candle closes below the lead-in line
- What it means
- The rush is over
- What you do
- Sell on that close
A word on steepness. Some guides give angles in degrees for each phase, but the angle of a line on your screen changes when you squeeze or stretch the chart. Compare the bump with the lead-in on the same chart instead. If the bump doesn’t look obviously steeper than the lead-in, it isn’t a bump.
What should you do in each phase?
Draw, wait, then act. The lead-in gives you the line, the bump gives you a warning, and only the run gives you a trade. Most losses on this pattern come from acting one phase too early.
The red box in the middle is the one to remember. A bump is where the urge to sell is strongest and the evidence is weakest.
How do you trade a bump and run reversal top?
Sell when a candle closes below the lead-in trendline. Put the stop a little above the high of the break candle and the candle before it. Aim first for the low where the bump began, because price often returns there.
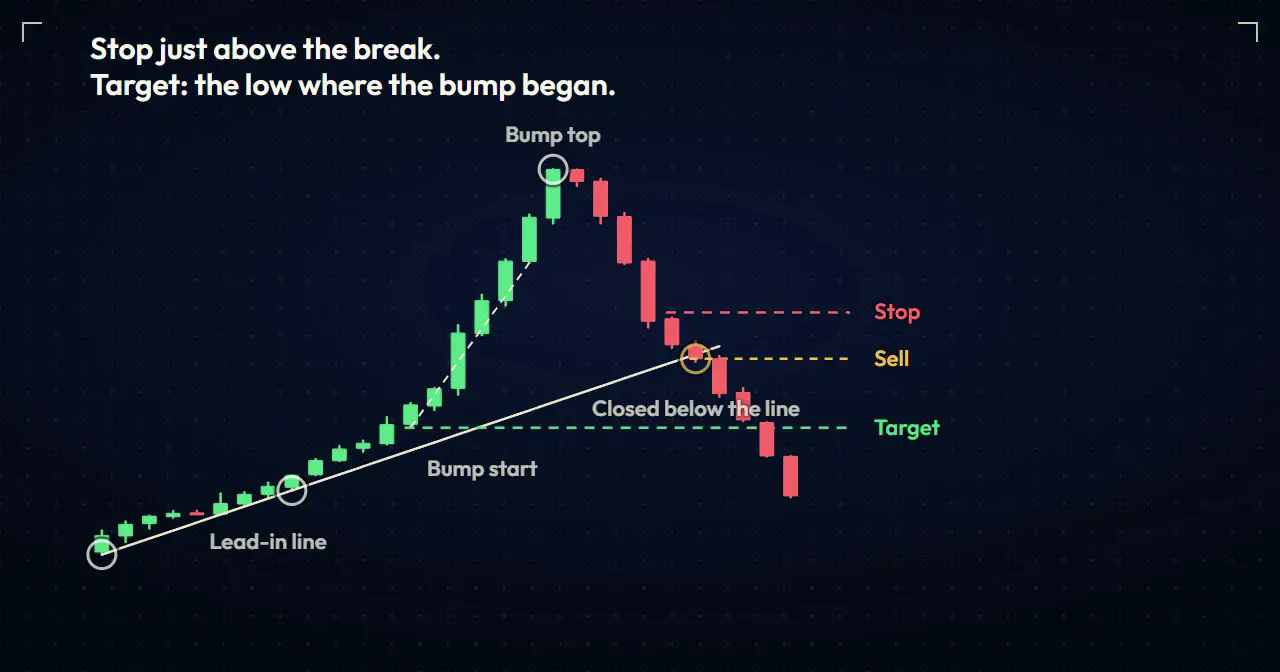
The plan, written out:
- Entry: the close of the first candle that ends below the lead-in line after the bump has topped.
- Stop: a little above the highs of the break candle and the one before it. If price climbs back over them, the break has failed.
- Target: the bump start, the last lead-in low before the steep rise. Bulkowski notes that price often falls to this level and sometimes well past it.
Why not put the stop above the bump top? It’s safer, but the top can sit so far away that the risk dwarfs the target. Size the trade from your stop distance using the position sizing routine, not from how good the pattern looks.
If a candle closes back above the lead-in line, get out. A run that can’t stay below the line is not a run.
How is it different from other reversal patterns?
The bump and run is about speed, not shape. A head and shoulders or a double top needs price to make specific highs. A bump and run only needs a trend that gets too steep and a trendline that breaks.
| Pattern | What forms first | Where you act |
|---|---|---|
| Bump and run reversal | A steady trend, then a much steeper rise | Close below the lead-in trendline |
| Head and shoulders | Three highs, the middle one highest | Close below the neckline |
| Diamond top | Swings that widen, then narrow | Close below the right-hand line |
| Plain trendline break | Any trend with a clean line | Close through the line, often then a retest |
- What forms first
- A steady trend, then a much steeper rise
- Where you act
- Close below the lead-in trendline
- What forms first
- Three highs, the middle one highest
- Where you act
- Close below the neckline
- What forms first
- Swings that widen, then narrow
- Where you act
- Close below the right-hand line
- What forms first
- Any trend with a clean line
- Where you act
- Close through the line, often then a retest
Sometimes they overlap. A bump can top out with a small head and shoulders on it, and when both agree, the case for the trade is stronger. The bump and run adds one thing the others don’t: it tells you to be suspicious of steep rallies before any top has formed.
What about a bump and run bottom?
It is the same pattern after a fall, traded the other way. A steady decline along a down trendline speeds up into a steep drop, then price recovers and closes above the lead-in line. That close is the buy, with the stop below the break and the first target at the high where the steep drop began.
In my experience the bottom version is harder to sit through, because the steep drop feels like a crash and the instinct is to buy the low. The rule stays the same, so wait for the close above the line.
Where does RelicusRoad Pro fit?
The hard part is drawing an honest lead-in line before the bump makes everything look obvious. RelicusRoad Pro draws automatic trendlines from confirmed swing points, so you have a line that was on the chart before the excitement started, not one you drew afterwards to fit the drop. It also marks support and resistance zones, which helps you check whether the bump start lines up with a real level.
It won’t tell you when the bump ends. The close below the line still decides, and you still set the stop before you sell.
Frequently asked questions
What is a bump and run reversal pattern? A reversal pattern that forms when a steady trend suddenly speeds up. Price rises gently along a trendline (the lead-in), climbs much faster (the bump), tops out, and falls back through the original line (the run). Thomas Bulkowski first described it in 1997, and the close below the lead-in line is the usual signal.
Is the bump and run reversal bullish or bearish? The top version, after a rise, is bearish. The bottom version, after a steep fall, is bullish once price closes back above the lead-in downtrend line.
When do you sell a bump and run reversal top? When a candle closes below the lead-in trendline after the bump has topped. Selling during the bump means guessing where a fast market stops.
Where should the stop and target go? The stop goes a little above the high of the break candle and the one before it. The first target is the low where the bump began, where Bulkowski notes price often returns.
How steep does the bump need to be? Clearly steeper than the lead-in on the same chart. Bulkowski’s guideline is a bump at least twice as high above the trendline as the lead-in. Compare the two parts rather than measuring angles, since angles change with chart scaling.
Next time a rally goes vertical, draw the lead-in line and wait for the close below it. To compare your line with automatic trendlines drawn from confirmed swings, see RelicusRoad Pro.
Written for RelicusRoad by RelicusDigital.com.
Keep going on this topic
Support and Resistance Mastery: Zones, Breaks and Retests
Master support and resistance zones with repeatable drawing rules, breakout and retest confirmation, invalidation, position sizing and common mistakes.
- Island Reversal Pattern: How to Trade the Gap Trap
- Diamond Chart Pattern: How to Spot and Trade It
- Dark cloud cover pattern: the depth test most traders skip
- Hanging man candlestick pattern: how to trade the warning
- Harami candlestick pattern: most of them are not worth trading
- Kicker Candlestick Pattern: How to Trade the Gap Reversal
- Marubozu candlestick: when a no-wick candle means it
- NR7 Trading Strategy: Trade the Quietest Candle in 7
- Price Channel Pattern: Trade Rising and Falling Channels
- Rising Three Methods Pattern: How to Trade the Pause
- Rounding Bottom Pattern: How to Trade a Base, Not a Bounce
- Shooting star candlestick pattern: one rejected high is not a top
- Spinning top candlestick pattern: the indecision candle
- Three white soldiers pattern: real reversal or exhausted run?
- Triangle chart pattern: trade the flat side, not the shape
- Triple Top and Triple Bottom Pattern: Trade the Third Test



