You moved your stop up under the last swing, felt disciplined about it, and got taken out by one ordinary wick. The trend carried on without you.
The Chande Kroll stop indicator exists to stop that from happening. It is a trailing stop that sets its distance from how far the market is moving right now, then draws two lines so you can see which side of the trend you are on. By the end of this you will know how each line is built, how to read price against both, and which candle to trust when they cross.
Key Findings
- Definition: the Chande Kroll stop is a pair of trailing-stop lines, one hung below recent highs for longs and one hung above recent lows for shorts, each offset by average true range.
- Origin: Tushar Chande and Stanley Kroll set it out in their 1994 book The New Technical Trader.
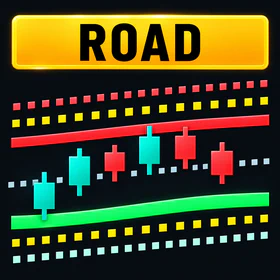
- Reading rule: a close above both lines is an uptrend read, below both is a downtrend read, and between them means the lines disagree.
- Timing: the live candle can move both the line and the wick, so a stop hit or a line flip only counts once the bar has closed.
How is the Chande Kroll stop indicator built?
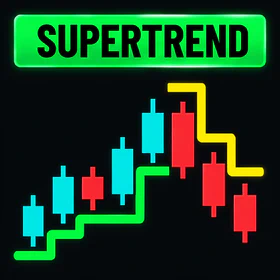
In two passes. First, take the highest high of a recent window and subtract a multiple of average true range. Then take the highest value of that result over a second, shorter window. The mirror image, lowest low plus the ATR offset, gives the second line.
The red line never lands on the high itself. It sits one slice of volatility beneath it. That slice is average true range, the typical size of a bar including gaps. When bars get bigger, the slice gets bigger and the stop backs off.
The second pass is what makes this indicator different. Without it, the line would wobble every time one bar shrank the range. With it, the line holds its level until a genuinely new extreme arrives or an old one ages out of the window, so it moves in clean steps instead of jitter.
How do you read price against both lines?
Look at where the candle closed relative to the pair. TradingView’s Chande Kroll Stop reference page describes the common use plainly: buying is typical when price crosses above both lines and selling when it crosses below both. Everything in between is the market refusing to commit.
That middle row deserves more respect than it gets. When the close sits between the lines, one says the trend is up and the other says it is down. In a range that state can last for days. Treating it as a signal to guess is where most of the whipsaw losses with this tool come from.
The lines crossing each other is the other event worth noticing. When the line built from the lows rises above the line built from the highs, the recent range has shifted upward far enough that both stops agree on direction. It is a trend-change read, not an entry trigger on its own.
Chande Kroll, Chandelier Exit or Parabolic SAR?
All three trail price, but they decide the distance differently, and that difference decides how often you get shaken out.
| Trailing stop | How it sets the distance | Moves when | Strength | Weak spot |
|---|---|---|---|---|
| Chande Kroll stop | ATR offset from the recent extreme, then a second smoothing window | A new extreme appears or an old one leaves the window | Steady steps, fewer twitches on single bars | Slower to react when a trend really turns |
| Chandelier Exit | ATR multiple below the highest high (or above the lowest low) | Every bar the high or ATR changes | Simple, widely used, easy to verify by hand | Can jump around on one wide bar |
| Parabolic SAR | Accelerates toward price the longer the trend lasts | Every bar, faster over time | Tightens hard on mature trends | Chops badly in ranges, ignores volatility |
| Fixed pip stop | A number chosen before the trade | Only when you move it | Easy to size | Knows nothing about current conditions |
- How it sets the distance
- ATR offset from the recent extreme, then a second smoothing window
- Moves when
- A new extreme appears or an old one leaves the window
- Strength
- Steady steps, fewer twitches on single bars
- Weak spot
- Slower to react when a trend really turns
- How it sets the distance
- ATR multiple below the highest high (or above the lowest low)
- Moves when
- Every bar the high or ATR changes
- Strength
- Simple, widely used, easy to verify by hand
- Weak spot
- Can jump around on one wide bar
- How it sets the distance
- Accelerates toward price the longer the trend lasts
- Moves when
- Every bar, faster over time
- Strength
- Tightens hard on mature trends
- Weak spot
- Chops badly in ranges, ignores volatility
- How it sets the distance
- A number chosen before the trade
- Moves when
- Only when you move it
- Strength
- Easy to size
- Weak spot
- Knows nothing about current conditions
My take: the Chande Kroll stop suits traders who hold through normal pullbacks and hate being clipped by noise. If you scalp tight moves, the extra smoothing will feel sluggish, and the Chandelier Exit or a structure stop will serve you better.
Which candle should you trust?
The closed one. On the live bar, a fresh high lifts the line, a wider range pushes it away, and a wick can dip through it and snap back before the close. None of that is final until the candle finishes.
The left panel is the moment most traders panic. The right panel is what the bar became. If your rules say “exit when price closes below the stop,” the wick on the left changes nothing.
This is also why a broker-side stop order and an indicator stop are not the same thing. A hard stop at the line fills on the wick. A close-based rule waits for the verdict. Neither is wrong, but pick one on purpose and test the version you trade live. If you want to see how many of your past stops sat inside normal noise, the maximum adverse excursion method measures it from your own journal.
What settings should you start with?
Your platform’s defaults, after you have checked what they are. Implementations differ in window lengths and ATR multiple, and TrendSpider’s Chande Kroll Stop guide walks through the same three inputs under different names.
The trade-off runs one way. Longer windows and a bigger multiple give a wider stop that survives more pullbacks and gives back more when the trend ends. Shorter and smaller does the opposite. There is no setting that avoids both costs, only one that fits your holding period.
Where does RelicusRoad Pro fit?
A trailing stop answers one question, which is when you are wrong about a trade you already hold. It does not tell you where to get in, and a stop trailing a bad entry only manages a bad trade politely.
RelicusRoad Pro handles the other half. Its signals lock when the candle closes and stay where they printed on MT4, MT5 and TradingView, so the entry you log is the entry you could have taken. Pair that with a close-based trailing stop like Chande Kroll, and both ends of the trade are judged on the same finished bars.
Frequently asked questions
What is the Chande Kroll stop indicator? It is a volatility-based trailing stop drawn as two lines on the price chart. One hangs below the recent high and trails longs; the other hangs above the recent low and trails shorts. The distance is a multiple of average true range, so the stop widens in noisy markets and tightens in calm ones.
How do you read the two Chande Kroll lines? Check where the candle closed. Above both lines reads as an uptrend and supports holding a long. Below both reads as a downtrend. Between them means the lines disagree, which is common in ranges and early reversals, and waiting beats forcing a direction.
What is the difference between the Chande Kroll stop and the Chandelier Exit? Both subtract an ATR multiple from a recent high. The Chandelier Exit stops there. The Chande Kroll stop adds a second pass over another window, so the line moves in cleaner steps and reacts less to one noisy bar, at the cost of a slightly slower response to a real turn.
Does the Chande Kroll stop repaint? Closed-bar values do not change, because the highs, lows and ranges behind them are fixed. On the current bar, a new high or a wider range moves the line while the candle is open. Treat live values as provisional and act on the close.
What settings should I use for the Chande Kroll stop? Start with your platform’s defaults and confirm what they are, since implementations differ. Longer windows and a larger ATR multiple survive more noise but give back more on reversals. Test any change on your own instrument and timeframe first.
Put the Chande Kroll lines under your next trade, judge every exit on the close, and let RelicusRoad Pro give you entries that hold still long enough to trail.
Written for RelicusRoad by RelicusDigital.com.
Keep going on this topic
Position Sizing: The Boring Math That Keeps Traders Alive
A plain-English guide to position sizing forex with worked examples: turn a fixed percentage of risk into a lot size on any pair, and keep your losses uniform.
- Risk Reward Ratio: Why 1:3 Alone Won't Save You
- Monte Carlo simulation trading: what backtests hide
- EUR/JPY Price Forecast: How to Trade the 184.00 Zone
- Forex order types explained: what each one costs you at the fill
- How War Affects Forex: A Geopolitical Risk Framework
- Embracing the Red: How to Survive a Losing Streak
- Margin call in forex: the warning before your broker closes your trades
- Maximum Adverse Excursion: Where Your Stop Should Actually Sit
- Profit factor: the backtest number that hides your worst month
- Trading Psychology: Why Your Brain Wants You to Lose
- Pyramiding Trading Strategy: How to Add to Winners Without Giving Back the Move
- Sharpe ratio trading: what a high number hides on a short sample
- What is slippage in forex trading, and how do you cut it down?
- The Boring Secret: Why 90% of Traders Fail (No Journal)
- Ulcer Index Indicator: The Drawdown Metric Volatility Tools Miss
- Trading Through US Policy Chaos: A Risk-First Framework
Related reading: The Best Trading Indicators for MT4, MT5 and TradingView in 2026.