

Your head and shoulders had no neckline. The lows kept moving, first lower and then higher. Then price dropped hard, and you were still waiting for the line that never formed.
That shape was probably a diamond chart pattern. After a trend, the swings get wider, then narrower, and the shape they trace looks like a diamond on its side. It is a reversal pattern, but only a close outside the right-hand lines makes it tradeable. By the end, you’ll be able to tell a real diamond from the shapes it gets confused with, and you’ll know where the sell, the stop and the target go.
Key Findings
- Two halves: a diamond is a widening set of swings followed by a narrowing set, and it needs both.
- Trend first: it is a reversal pattern, so it only counts after a clear move up (a top) or down (a bottom).
- The close decides: the trade starts when a candle closes outside one of the two right-hand lines.
- Height sets the target: the distance from the highest high to the lowest low, measured from the break, is the usual first target.
What is a diamond chart pattern?
It is a widening pattern that turns into a narrowing one. After a trend, price makes a higher high and a lower low, so the swings spread out. Then the swings shrink, with lower highs and higher lows. Draw lines across those highs and lows and you get four sides that meet at points on the left and right.
The idea is old. Robert Edwards and John Magee covered it in Technical Analysis of Stock Trends (1948), and it is easiest to picture as a broadening formation that turns into a symmetrical triangle. Thomas Bulkowski later gave diamond tops and diamond bottoms their own chapters in Encyclopedia of Chart Patterns (2nd edition, 2005), and his diamond tops page uses the same height-based target this post uses.
How do you spot a diamond top?
Look for swings that get bigger, then smaller, after a rise. You need a higher high and a lower low on the left, then a lower high and a higher low on the right. Join the points and the shape should close in toward a point on the right side.
- Confirm the trend. Price should have been rising for a while before any of this.
- Mark the left half: a swing high, a pullback low, a higher high, then a lower low.
- Mark the right half: a lower high, then a higher low.
- Draw four lines through those points. The two on the right should meet a little ahead of price.
In that clip the left half comes first, then the right half, then the close. The trade levels come last.
Is it really a diamond, or something else?
Ask three questions in order: was there a trend, did the swings widen and then narrow, and has a candle closed outside the right-hand lines? A “no” to any of them means the shape is something else, or the trade isn’t ready yet.
Most mistakes happen at the second question. Traders see half the pattern and call it a diamond. Here’s how the usual look-alikes differ:
| Diamond | Head and shoulders | Broadening formation | Symmetrical triangle | |
|---|---|---|---|---|
| Swing highs | Rise, then fall | Shoulder, head, shoulder | Keep rising | Keep falling |
| Swing lows | Fall, then rise | Roughly level (neckline) | Keep falling | Keep rising |
| Bottom edge | Two lines meeting at the lowest low | One neckline | One line sloping down | One line sloping up |
| Where you act | Close outside a right-hand line | Close through the neckline | Hard to say; ranges keep widening | Close outside either line |
- Diamond
- Rise, then fall
- Head and shoulders
- Shoulder, head, shoulder
- Broadening formation
- Keep rising
- Symmetrical triangle
- Keep falling
- Diamond
- Fall, then rise
- Head and shoulders
- Roughly level (neckline)
- Broadening formation
- Keep falling
- Symmetrical triangle
- Keep rising
- Diamond
- Two lines meeting at the lowest low
- Head and shoulders
- One neckline
- Broadening formation
- One line sloping down
- Symmetrical triangle
- One line sloping up
- Diamond
- Close outside a right-hand line
- Head and shoulders
- Close through the neckline
- Broadening formation
- Hard to say; ranges keep widening
- Symmetrical triangle
- Close outside either line
The head and shoulders pattern is the closest cousin. If the lows line up along one neckline, trade it as a head and shoulders instead. If the swings never stop widening, you’re looking at a broadening formation, and that is a sizing problem more than an entry setup. A small cluster at the top cut off by a gap on each side is an island reversal, confirmed by the gaps rather than by lines. And if the rise into the top went suddenly steep after a calm start, compare it with a bump and run top, which is traded off the original trendline.
How do you trade a diamond top breakdown?
Sell when a candle closes below the lower right-hand line. Put the stop just above the last high inside the diamond. For the target, measure the diamond from its highest high to its lowest low and subtract that height from the breakdown close.
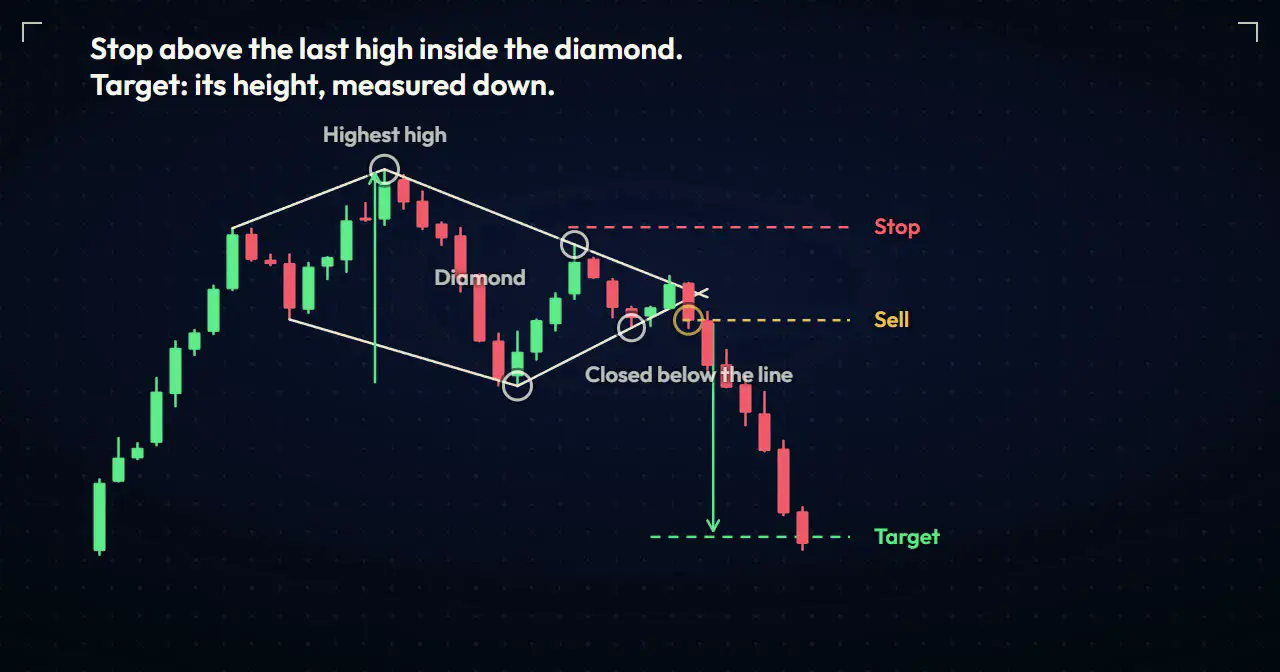
The plan, written out:
- Entry: the close of the first candle that ends below the lower right-hand line.
- Stop: just above the most recent lower high inside the diamond. Above it, the narrowing has failed.
- Target: the height at the widest part, measured down from the entry close.
Why not a stop above the highest high? It’s safer against noise, but on a big diamond it can make the risk larger than the target. That’s a trade you shouldn’t take at all. Size the position from the stop distance with the position sizing routine, not from how sure the pattern looks.
If a candle closes back inside the diamond after the break, get out. The right half of a diamond is a squeeze, and a squeeze can break one way, fail, and run the other way.
What about a diamond bottom?
A diamond bottom is the same shape after a fall, traded the other way. Buy when a candle closes above the upper right-hand line. The stop goes just below the last low inside the diamond, and the target is the diamond’s height added to the breakout close.
The same three questions apply. In my experience, bottoms are the harder of the two to see live, because the widening half often looks like the downtrend getting more volatile. Wait for the right half to show you lower highs and higher lows before you draw anything.
Where does RelicusRoad Pro fit?
The hard part of a diamond is drawing honest lines while the pattern is still forming. RelicusRoad Pro draws automatic trendlines and support and resistance zones on the chart, so you have a second set of lines to compare with yours before the break. If you want only the lines, the standalone Trendlines tool for MT4 and MT5 fits channels through confirmed swing pivots, and the Support Resistance tool helps you check that your stop sits above a real swing high.
None of it picks the direction. The close outside the diamond still decides, and you still choose the stop before you click sell.
Frequently asked questions
What is a diamond chart pattern? A reversal shape after a trend. The swings get bigger (a higher high, a lower low), then smaller (lower highs, higher lows). Joining them draws a diamond on its side, and a close outside the right-hand lines is the signal.
Is a diamond top bullish or bearish? It forms after a rise and usually warns the rise is ending, so it reads as bearish. It can still break upward, so let the close outside the diamond decide.
How do you set a target for a diamond pattern? Measure from the highest high to the lowest low. Subtract that height from the breakdown close on a top, or add it to the breakout close on a bottom. It’s a first target, not a promise.
Where should the stop go on a diamond top? Just above the last high inside the diamond, the most recent lower high on the right side. If price gets back above it, the narrowing has failed.
How is a diamond different from a head and shoulders? A head and shoulders has one neckline under it. A diamond’s lows fall and then rise, so its bottom edge is two lines meeting at the lowest low.
Open your chart at the last big top you traded and check it against the three questions: trend, widen then narrow, close outside. To compare your hand-drawn lines with swing-based trendlines and zones, see RelicusRoad Pro.
Written for RelicusRoad by RelicusDigital.com.
Keep going on this topic
Support and Resistance Mastery: Zones, Breaks and Retests
Master support and resistance zones with repeatable drawing rules, breakout and retest confirmation, invalidation, position sizing and common mistakes.
- Bump and Run Reversal Pattern: How to Trade It
- Island Reversal Pattern: How to Trade the Gap Trap
- Hanging man candlestick pattern: how to trade the warning
- Harami candlestick pattern: most of them are not worth trading
- Kicker Candlestick Pattern: How to Trade the Gap Reversal
- Marubozu candlestick: when a no-wick candle means it
- NR7 Trading Strategy: Trade the Quietest Candle in 7
- Price Channel Pattern: Trade Rising and Falling Channels
- Rising Three Methods Pattern: How to Trade the Pause
- Rounding Bottom Pattern: How to Trade a Base, Not a Bounce
- Shooting star candlestick pattern: one rejected high is not a top
- Spinning top candlestick pattern: the indecision candle
- Three white soldiers pattern: real reversal or exhausted run?
- Triangle chart pattern: trade the flat side, not the shape
- Triple Top and Triple Bottom Pattern: Trade the Third Test
- Tweezer top and bottom pattern: the level matters more than the candles



