
Your buy signal came from price closing back above a 20 EMA. Your friend uses a 20 SMA on the same chart, and their line said wait. Same length, same candles, two different answers. EMA vs SMA is not a style choice; it decides when your moving average says the trend has changed.
In short, the EMA weighs recent candles more, so it turns sooner and gives more false turns. The SMA weighs every candle the same, so it is slower and steadier. By the end you will know which one fits the job you need the line to do.
Key Findings
- Different weights, same length: an SMA counts every candle in its window equally; an EMA counts the newest candle most.
- The EMA turns first: after a low, a 20 EMA usually starts rising several candles before a 20 SMA does.
- The SMA can move on old news: when a big candle leaves its window, the SMA shifts even if today's price is flat.
- Choose by job: SMA for a steady trend filter, EMA for pullback entries, neither in a sideways market.
What is the difference between an EMA and an SMA?
The difference is how each line weighs the candles it averages. A simple moving average adds up the last 20 closes and divides by 20. An exponential moving average gives the newest close the largest share and lets each older close count a little less. Same inputs, different weights.
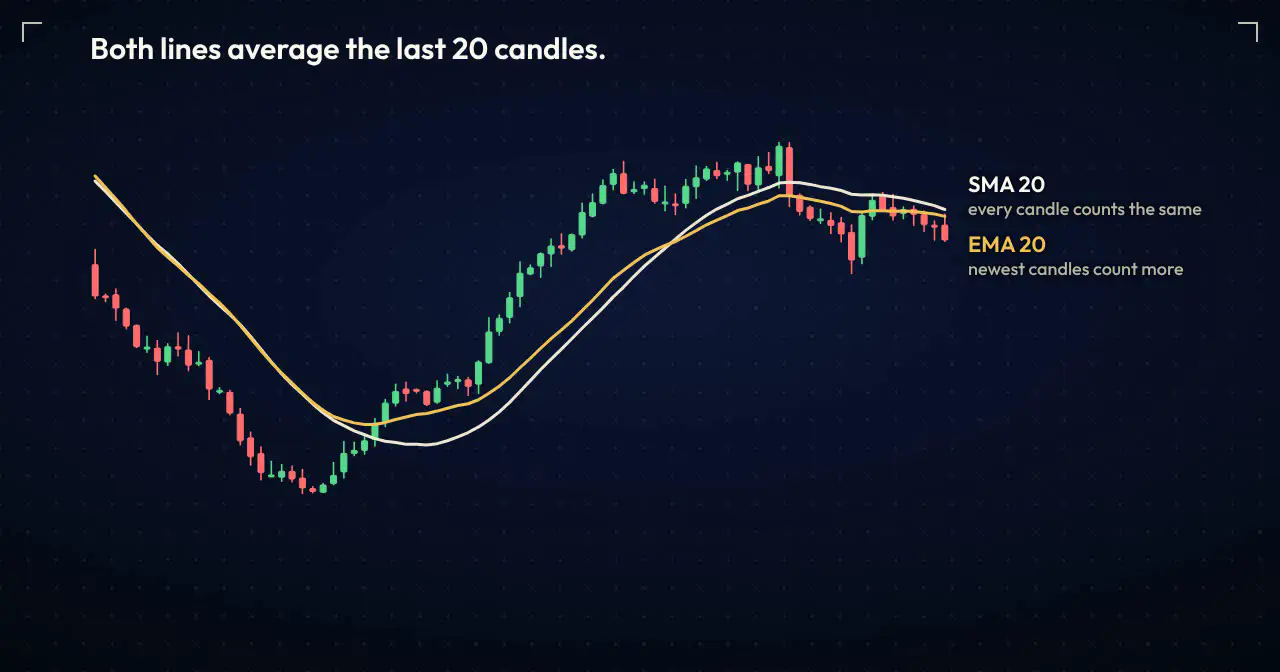
How big is the gap? StockCharts’ ChartSchool guide to moving averages gives the EMA multiplier as 2 divided by (length + 1). For a 20-period EMA that is about 9.5% of the line for the newest close, against an even 5% per close in a 20 SMA.
| 20-period SMA | 20-period EMA | |
|---|---|---|
| Weight of the newest close | 1/20, same as every other | 2/21, almost double |
| Candles older than 20 bars | Ignored completely | Still count, but very little |
| Distance from price in a trend | Further away | Closer |
| Reaction to a sudden move | Slower | Faster |
- 20-period SMA
- 1/20, same as every other
- 20-period EMA
- 2/21, almost double
- 20-period SMA
- Ignored completely
- 20-period EMA
- Still count, but very little
- 20-period SMA
- Further away
- 20-period EMA
- Closer
- 20-period SMA
- Slower
- 20-period EMA
- Faster
Why does the EMA turn before the SMA?
Because a fresh move pulls the EMA harder. When price turns up from a low, the newest closes are the rising ones. The EMA gives them extra weight, so it bends up sooner. The SMA still carries the falling closes from earlier in its window at full weight, so it keeps sinking for a while.
In this chart the SMA turned six candles after the EMA. That gap is lag, the delay between price changing direction and the line admitting it. The exact number changes with every chart; the order does not.
Faster is not free. The same extra weight that turns the EMA early also turns it on small pullbacks that come to nothing.
What is the SMA drop-off effect?
An SMA can move when price does nothing. Each new bar, the SMA adds today’s close and drops the close from 20 bars ago. If that old candle was huge, its exit shifts the average on its own. A trader reading the slope sees a turn that today’s price never made.
The EMA avoids this. Old candles never leave it at once; their weight shrinks a little every bar, so a big candle fades out slowly instead of falling off a cliff. That is one honest point in the EMA’s favour beyond speed.
EMA vs SMA: which one should you use?
Pick the average for the job the line has to do. If it is a trend filter you check before every trade, the SMA’s slow, steady turn is what you want. If you buy pullbacks to the line, the EMA sits closer to price and gives tighter entries. In a sideways market, neither helps.
The flow comes down to one question: what will you do when price touches the line? If the answer is “nothing, I only check which side price is on”, use the slower line.
| Job | Better choice | Why |
|---|---|---|
| Trend filter (only buy above, only sell below) | SMA | Turns less often, so fewer false flips |
| Pullback entry (buy near the line in an uptrend) | EMA | Stays closer to price, so the stop can be tighter |
| Trailing a stop in a fast trend | EMA | Follows the move sooner |
| Sideways, no clear trend | Neither | Price crosses both lines back and forth |
- Better choice
- SMA
- Why
- Turns less often, so fewer false flips
- Better choice
- EMA
- Why
- Stays closer to price, so the stop can be tighter
- Better choice
- EMA
- Why
- Follows the move sooner
- Better choice
- Neither
- Why
- Price crosses both lines back and forth
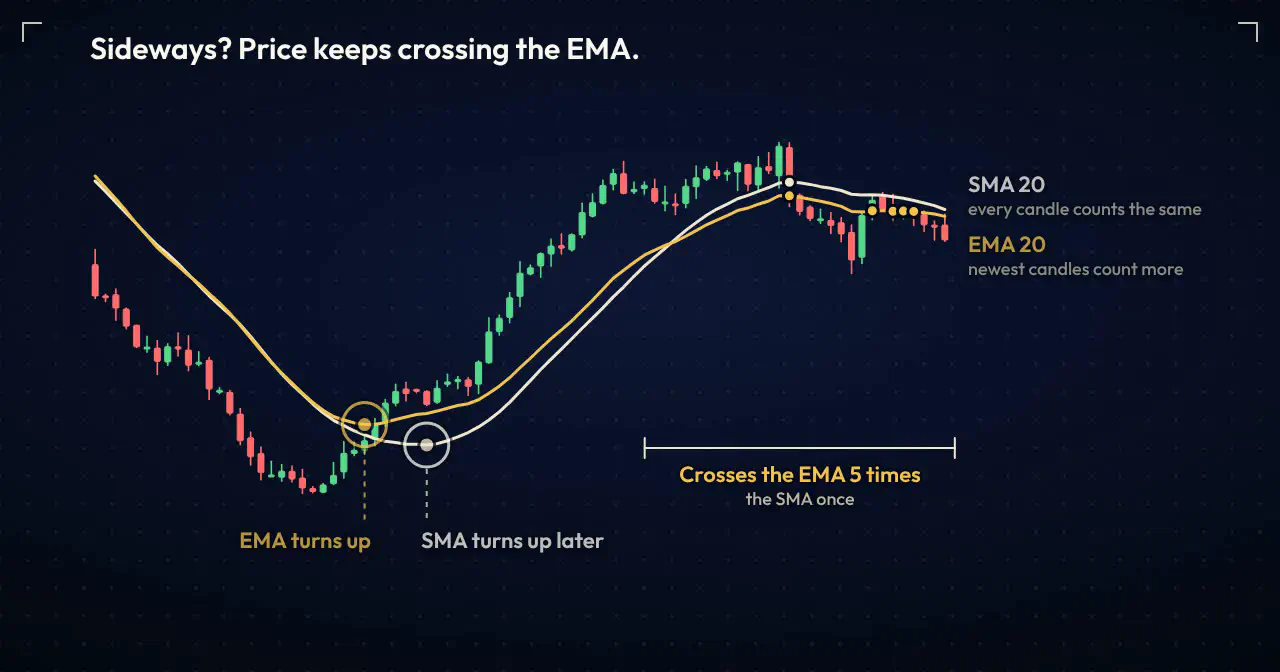
That sideways stretch shows the cost of speed. Closes crossed the EMA five times and the SMA once. Each EMA cross could look like an entry signal. In a range, that adds up to a string of small losses. If you trade crossovers, the moving average crossover guide covers how to filter them.
Does the length matter more than the type?
Yes. Length changes a moving average far more than EMA or SMA does. A 20 EMA and a 20 SMA sit close together; a 20 and a 100 of either type are different tools. Choose the length for your holding time first, then the type.
The research record backs testing over opinion. Brock, Lakonishok and LeBaron’s 1992 Journal of Finance paper, “Simple Technical Trading Rules and the Stochastic Properties of Stock Returns”, tested simple moving-average rules on long runs of Dow Jones data. It covered a US stock index from 1897 to 1986, not today’s currency markets, so treat it as a reason to test your own pair, not as proof of an edge.
If you want even less lag than an EMA, the DEMA and TEMA guide explains what that costs.
Where RelicusRoad Pro fits
A moving average tells you the side of the trend. It does not tell you where price is likely to stall. RelicusRoad Pro adds support and resistance levels that are set once a candle closes and stay where they were drawn.
So the workflow stays simple. Use your SMA or EMA to decide whether you are looking for buys or sells. Use the levels to decide where the entry, stop and target go. Neither tool replaces a stop.
Frequently asked questions
What is the difference between an EMA and an SMA?
Both average recent closing prices. A simple moving average (SMA) adds up the last N closes and divides by N, so every candle counts the same. An exponential moving average (EMA) gives the newest close the largest weight and lets older closes count for less and less. With the same length, the EMA sits closer to price and turns sooner.
Is the EMA better than the SMA for day trading?
Not automatically. The EMA reacts faster, which helps when you buy pullbacks in a fast intraday trend. It also turns on small wiggles, so it gives more false signals in a quiet or sideways session. A common split is an EMA for entries and a slower average, often an SMA, as the trend filter.
Why does the EMA react faster than the SMA?
Because the newest close carries more weight. In a 20-period SMA each close is one twentieth of the average. In a 20-period EMA the newest close gets a weight of 2 divided by 21, close to double that, so a fresh move pulls the EMA further, sooner.
What is the SMA drop-off effect?
An SMA moves when a new close enters its window and also when an old close leaves it. When a very large candle from 20 bars ago drops out, the SMA can jump or dip even if today’s price is quiet. The EMA does not have this problem because old candles never drop out at once; their weight shrinks a little each bar.
Should I use a 20 EMA or a 20 SMA?
Decide what the line is for first. If it is a trend filter you only check before buying or selling, a 20 SMA is steadier. If you buy pullbacks to the line, a 20 EMA stays closer to price. Whichever you pick, test it on your own pair and timeframe and keep the same setting long enough to judge it.
Pick one average for your trend filter, then check your entries against the close-confirmed levels in RelicusRoad Pro.
Written for RelicusRoad by RelicusDigital.com.
Keep going on this topic
The Best Trading Indicators for MT4, MT5 and TradingView in 2026
An honest breakdown of trading indicators for MT4, MT5 and TradingView: which categories add real edge, which are noise, and how many you actually need.
- T3 moving average: what the volume factor really changes
- DEMA vs TEMA: which fast average lags less?
- The Fisher Transform Indicator: A Trader's Guide to Cleaner Turning Points
- Force Index Indicator: How to Read Volume-Backed Momentum
- Fractal Adaptive Moving Average (FRAMA): A Trader's Guide
- Gann Fan Indicator: How to Draw and Trade It Without Guessing the Angles
- Gann HiLo activator indicator: how to read trend flips without the lag
- Gator Oscillator Guide: How to Read the Alligator's Bite
- Guppy Multiple Moving Average (GMMA): How to Read Trend Strength
- HalfTrend Indicator Explained: Reading Trend Flips and the Repaint Question
- The repaint backtest trap: why a perfect history can lie
- Hull Moving Average Indicator: Faster Signals Without the Lag Trap
- Kagi charts explained: reading trend reversals without the noise of time
- Kaufman Adaptive Moving Average: Speed in Trends, Calm in Chop
- Keltner Channels: How to Read Volatility Without Chasing the Move
- Klinger Volume Oscillator: How to Read Volume-Driven Reversals



