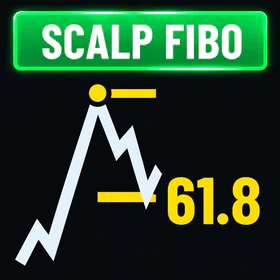
You caught the trend early, price ran hard in your favor, then it stalled and started sliding back toward your entry. Now the question that decides the trade: is this the pullback you add into, or the reversal you should be running from? Guess wrong and you either bail on a winner or hold a loser all the way down.
Fibonacci retracement exists to give that decision a map. It will not tell you the trend has ended, but it marks the depths where a normal pullback tends to run out of room. By the end of this guide you will be able to anchor the tool cleanly, read the levels that matter, and know when a fib line is worth trading and when it is just a line.
Key Findings
- It maps pullback depth, not direction: fibonacci retracement measures a finished swing and flags where a pullback is likely to pause, chiefly at 38.2%, 50% and 61.8%.
- 50% is a convention, not a Fibonacci number: it stays on the tool because traders watch the halfway point of any move.
- Confluence is what gives it weight: a fib level matters when it overlaps prior structure, and means little sitting in open space.
- The levels do not repaint: anchored to two fixed points, the grid is arithmetic and stays where you drew it.
What is a fibonacci retracement, really?
A fibonacci retracement is a grid of horizontal lines that splits a completed price move into percentages, marking where a pullback might stall. You take one clear swing, anchor the tool from where the move started to where it ended, and the tool divides that vertical distance into set ratios. In an uptrend you draw from the swing low up to the swing high. In a downtrend you flip it.
The percentages come from the Fibonacci number sequence, where each number is the sum of the two before it. The ratio between neighbouring numbers settles near 0.618, the figure often called the golden ratio, and its companions 0.382 and 0.236 fall out of the same math. Whether markets “obey” these numbers for any deep reason is genuinely debatable. What is not debatable is that a great many traders draw the same levels, and a level a crowd is watching becomes a place where orders cluster.
One honest caveat before you lean on it. The 50% line is not a Fibonacci ratio at all. It sits on the tool by tradition, a nod to the old idea that markets often give back half a move. Charles Dow wrote about halfway retracements long before anyone bolted Fibonacci onto a trading platform. It earns its keep, but do not let anyone tell you it is sacred geometry.
Which fibonacci retracement levels actually matter?
Three levels do most of the work: 38.2%, 50% and 61.8%. A pullback that holds shallow, near 38.2%, is the signature of a strong, one-directional trend that barely pauses for breath. When price digs deeper, the 50% to 61.8% band is where continuation traders do most of their hunting, because a move that holds there has corrected meaningfully without breaking down. That band is what many call the golden pocket.
Two levels sit at the edges. The shallow 23.6% line is often just noise on its own, useful mainly to confirm a very strong trend that barely retraces. The deep 78.6% line is the last stand: price that slices through it has retraced nearly the whole move, and most traders stop calling that a pullback and start calling it a reversal. John J. Murphy’s Technical Analysis of the Financial Markets (1999) treats the 38.2%, 50% and 61.8% trio as the working set, and decades of charts since have not dislodged them.
How do you draw a fibonacci retracement without fooling yourself?
Anchor the tool to one obvious swing and leave it alone. The single biggest error is drawing the swing that makes the levels land where you already wanted to buy. That is not analysis, it is decorating a decision you already made. Pick the dominant leg on the timeframe you actually trade, use a consistent reference every time (either always wicks or always closes), and judge the pullback against that fixed grid.
Keep the timeframe honest too. A fib grid drawn on a five-minute chart maps a five-minute pullback, not the daily trend. If you trade the swing, draw the swing. Redrawing the anchors every time price makes a fresh high is how traders convince themselves the tool “works,” when all they did was move the goalposts. The confluence trap guide covers this bias in more depth: a level only counts if you would have drawn it before, not after, price arrived. The same anchor discipline applies to diagonal tools; a Gann fan swings every one of its angles the instant you move the pivot, so a loose anchor there rewrites all your levels at once.
Fibonacci retracement vs support and resistance: which do you trust?
They are strongest together, not apart. A fibonacci level is a prediction of where a pullback might end. A horizontal support or resistance zone is a record of where price has already reacted. When the two overlap, you have a level built from both math and memory, which is far more reliable than either alone. A fixed intraday grid such as camarilla pivot points is another watched map that can supply that overlap: a fib line landing on a camarilla reversal level is a spot two different crowds are eyeing at once.
| Factor | Fibonacci retracement | Horizontal support / resistance | Moving average |
|---|---|---|---|
| What defines the level | Percentages of a chosen swing | Prior price reactions | A rolling average of price |
| Adapts as price moves | No, fixed to the anchors | No, until you redraw | Yes, it slides with price |
| Objective or subjective | Subjective swing, fixed math | Subjective zone drawing | Fully objective |
| Best used for | Pullback depth targets | Reaction zones and breaks | Dynamic trend context |
| Repaints | No | No | No |
- Fibonacci retracement
- Percentages of a chosen swing
- Horizontal support / resistance
- Prior price reactions
- Moving average
- A rolling average of price
- Fibonacci retracement
- No, fixed to the anchors
- Horizontal support / resistance
- No, until you redraw
- Moving average
- Yes, it slides with price
- Fibonacci retracement
- Subjective swing, fixed math
- Horizontal support / resistance
- Subjective zone drawing
- Moving average
- Fully objective
- Fibonacci retracement
- Pullback depth targets
- Horizontal support / resistance
- Reaction zones and breaks
- Moving average
- Dynamic trend context
- Fibonacci retracement
- No
- Horizontal support / resistance
- No
- Moving average
- No
Read that table with one thing in mind: a fib level with nothing around it is the weakest entry on the page. The tool earns trust when it stacks with the reaction zones you would already mark from the support and resistance mastery guide. And once the pullback holds and the trend resumes, the same math projects your exit, which is where fibonacci extensions take over from retracements. Those same ratios sit underneath bigger frameworks too: an automatic Elliott wave count measures its wave targets off these very percentages, which is why a fib level and a wave label so often point at the same zone.
Does fibonacci retracement repaint?
No, and this is one of its genuine strengths. Once the tool is anchored to a swing low and a swing high, the levels are simple arithmetic on two fixed points. They cannot shift on their own, redraw after a reload, or quietly relocate the way a badly built indicator can. What you drew is what stays.
The only thing that “moves” is you. If price makes a new high and you re-anchor the top of the tool, every level slides, because you changed the inputs. That is a decision, not a repaint. The discipline is the same one that keeps any non-repainting method honest: fix your reference on a completed swing and stop nudging it. A level you keep adjusting to fit price was never a level, it was a running commentary.
How does RelicusRoad Pro fit with fibonacci levels?
The weak point in fib trading is the guesswork around which swing to draw and whether a level lines up with anything real. RelicusRoad Pro is built to take that judgement call off your plate by plotting structure directly on the chart. Its Road Levels and Action Levels mark the zones where price has actually reacted, so when a fib line lands on top of one of them, you have the overlap that turns a hopeful percentage into a location worth trading. You are checking confluence, not conjuring it.
That is the honest limit worth stating plainly. A tool can show you where structure sits and lock its levels so they do not drift, but it cannot size your position, set your stop, or tell you the trend idea was sound in the first place. That part stays yours. What it removes is the temptation to redraw a fib grid five times until a level appears exactly where you wanted to buy.
Frequently asked questions
What is a fibonacci retracement? A fibonacci retracement is a set of horizontal lines drawn across a completed price swing to mark where a pullback might pause. You anchor the tool from the start of a move to its end, and it splits that distance into percentages taken from the Fibonacci number sequence: 23.6%, 38.2%, 61.8% and 78.6%, with the non-Fibonacci 50% added by convention. The idea is that after a strong leg up or down, price often retraces part of the way before resuming, and these percentages flag the depths where buyers or sellers tend to step back in. It is a reference grid, not a signal by itself.
What are the most important fibonacci retracement levels? For most traders the levels that matter are 38.2%, 50% and 61.8%. A shallow pullback that holds around 38.2% signals a strong trend with little hesitation. The 61.8% level, tied to the golden ratio, marks the deepest pullback still considered healthy, so many treat the 50% to 61.8% band as the prime area to look for a continuation entry. The 78.6% level is a last-chance zone before the move is usually treated as failed. The 23.6% level is shallow and less reliable on its own.
How do you draw a fibonacci retracement correctly? Pick one clean, obvious swing and anchor the tool from its start to its end: swing low to swing high in an uptrend, swing high to swing low in a downtrend. Use the same reference each time, either candle closes or wicks, so your levels stay consistent. The most common mistake is cherry-picking a swing that makes the levels land where you already want to trade. Draw the dominant move on the timeframe you actually trade, then judge the pullback against it rather than fishing for a swing that fits your bias.
Does fibonacci retracement repaint? No. Once you anchor the tool to two fixed points, the levels are pure arithmetic and they do not move. That makes fibonacci retracement one of the few tools with no repaint risk in the calculation itself. The catch is human, not technical: if you keep redrawing the swing to a new high or low, the levels shift because you moved the anchors, not because the tool redrew itself. Fix your anchors on a completed swing and the grid stays exactly where you placed it.
Is fibonacci retracement actually reliable? On its own, only loosely. Price does not respect these percentages because of any physical law, and a level in empty space with nothing else around it is weak. The reliability comes from confluence: a fib level gains weight when it overlaps a prior support or resistance zone, a round number, or a level other traders are watching. Used as one input inside a plan with defined invalidation, it is a useful map of where a pullback might end. Used as a standalone buy or sell trigger, it disappoints.
Fibonacci retracement is a ruler for pullbacks, not a crystal ball for reversals. Draw it on a clean swing, trust the levels that overlap real structure, and it earns a place in your process.
See how RelicusRoad Pro plots the structure your fib levels need to line up with →
Keep going on this topic
Support and Resistance Mastery: Zones, Breaks and Retests
Master support and resistance zones with repeatable drawing rules, breakout and retest confirmation, invalidation, position sizing and common mistakes.
- Market profile trading: how to read value areas and point of control
- Forex Candlestick Patterns: Read the Sequence, Not One Bar
- The Engulfing Candle: The Only Reversal Signal You Need
- The Inside Bar: Coiled Spring Strategy
- The Fakeout: Why Breakout Trading is Dead (and what to do instead)
- Break and Retest Strategy: Wait for the Level to Flip
- Trendline Trading Strategy: Draw It Right, Then Trade It
- Pullback Trading Strategy: Buy the Dip Inside a Trend
- Mean Reversion Trading Strategy: Trade Back to the Average
- Mind the Gap: Trading Weekly Opens and Fair Value Gaps
- Dynamic Reversals: How to Catch the Turn Without Getting Wrecked
- Fractal Arrows Strategy: The 'Chaos Theory' of Market Turns
- Volume Profile Explained: Finding Value in the Noise
- Stop Trading Patterns: Why Order Flow Rules the Market
- The Russian Doll: Mastering Multi-Timeframe Analysis
- Multi-TF Trend Bar: Seeing the 'Matrix' of Market Trends