Most retail traders have a chart full of indicators. Moving averages, momentum oscillators, volatility bands. Every one of them is calculated from price that has already printed. Every one of them is, structurally, late.
Institutional desks do not trade from lagging price math. They trade from order flow – where large orders sit, where liquidity is pooled, and where the market will likely hunt stops before reversing. That gap in method is exactly what an institutional forex indicator tries to close. By the end of this post you’ll have a one-minute test you can run yourself to tell a genuine smart-money tool from a relabelled retail one.
Key Findings
- Lagging vs leading: Standard retail indicators calculate from closed price and confirm moves after the fact. Institutional tools model where liquidity and orders sit before a move unfolds.
- What "smart money" means structurally: Large participants cannot fill orders at a single price without moving the market against themselves, so they accumulate near defined structural zones. Institutional indicators map those zones.
- Non-repainting is non-negotiable: An indicator built on order-flow logic is worthless if its signals change retroactively. Genuine tools lock signals at bar close.
- Retail access exists: RelicusRoad Pro translates institutional structure into signals on MT4, MT5, and TradingView without requiring an institutional data feed.
What does “institutional” actually mean in a forex indicator?
The word gets abused. Every second vendor calls their product “institutional-grade.” In practice, an honest one means two things.
First, the tool models the market the way a professional desk thinks about it: as an auction that moves to find liquidity. Where there are clusters of stop-loss orders, pending entries, or breakout positions, there is liquidity. Large orders need that liquidity to fill without pushing price against themselves. An institutional indicator maps those clusters before price arrives, instead of describing the move after it ends.
Second, it is grounded in how orders actually behave – imbalances between buyers and sellers, structural levels drawn from swing highs and lows, the price areas that traded the most volume – rather than simple price smoothing. The Bank for International Settlements 2022 Triennial Survey recorded global FX daily turnover at $7.5 trillion, the majority generated by non-dealer financial institutions: hedge funds, asset managers, and prop desks. These participants do not time entries off a smoothed momentum reading. They track where their own orders, and their counterparties’ orders, are resting.
How do retail indicators fall short?
This is not a criticism of standard tools. A moving average does exactly what it promises: it smooths price over a set number of bars. The problem is what it tells you – where price was, not where the orders are.
| Feature | Typical retail indicator | Institutional-style indicator |
|---|---|---|
| What it reads | The price that already printed | Price structure, swing levels, or where volume traded |
| Signal timing | Lagging – confirms after the move | Leading – maps zones before the reaction |
| Logic basis | Mathematical smoothing | Auction behaviour and order flow |
| Repaint risk | Common | Non-repainting by design |
| How you use it | Confirmation filter | Entry trigger and zone target |
The cost of that is concrete. A trend-following crossover tells you a trend has started – but by the time it signals, the move large participants entered has often already run. A liquidity-zone tool shows you the level before price gets there, which is exactly where the big orders plan their fills.
What is order flow and why do institutional tools map it?
Order flow is the net balance of buying and selling pressure at a price. When buyers overwhelm sellers at a level, price advances. When a cluster of sell stops sits above an obvious resistance, price tends to spike through just far enough to fill them – the classic liquidity grab – then reverse.
A retail-accessible tool cannot see the actual order book that banks watch; that data sits behind institutional broker connections most traders will never have. What it can do is reconstruct the same picture from the chart itself: a run of higher highs with thin wicks shows strong buying; a cluster of equal highs flags a pool of stops resting just above them. When the tool marks that level, it is pointing to where orders are most likely concentrated, not where price happened to close on some arbitrary count of bars.
RelicusRoad Pro
Have you been trading for a while but have never made consistent profits or are you new to FOREX trading and want to get a head start? Try RelicusRoad and you'll never look back.
Get RelicusRoad ProWhat is a liquidity indicator and how does it work?
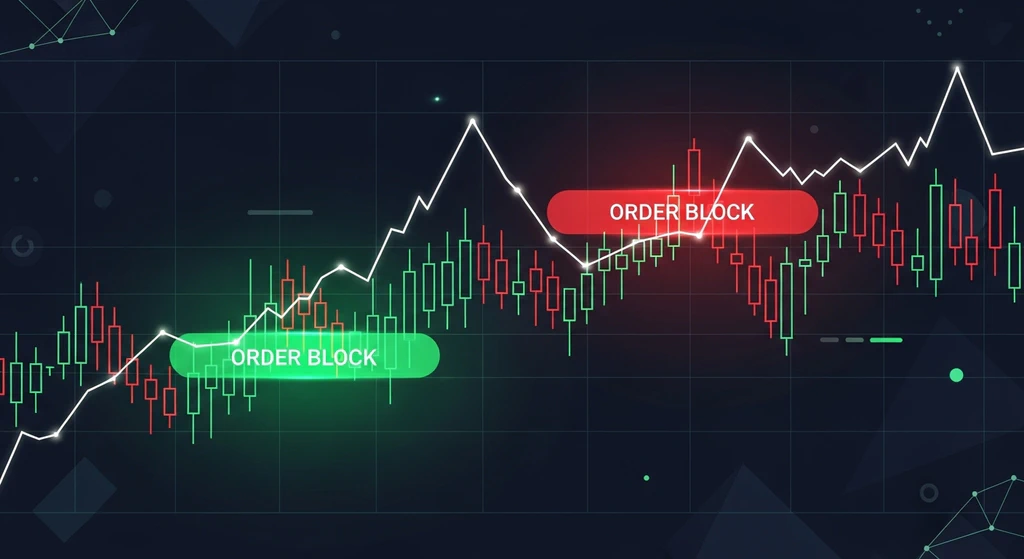
A liquidity indicator identifies the price levels where stop-loss orders and pending entries are most likely clustered. Those levels fall into two broad kinds.
Structural liquidity sits above obvious swing highs or below obvious swing lows – wherever traders following standard breakout rules have parked their stops. A row of equal highs is a dense pool, because breakout buyers, stop-hunters, and trend-followers all pile orders into the same spot at once.
Engineered liquidity appears when the market manufactures a false breakout to collect those orders before turning. A good tool does not pretend to predict whether the sweep happens; it marks the level so you can plan for either outcome. If price sweeps and rejects, that reaction is your entry. If price breaks and holds, the level has flipped and becomes a fresh zone in the new direction. See the order flow vs patterns guide for how these setups sit alongside traditional chart reading.
Does “institutional grade” mean the indicator does not repaint?
It should. A tool built to model forward-looking order structure has no excuse for rewriting its own past signals. A repainting indicator turns the historical record into fiction, and you cannot review or refine a system built on fiction.
So here is the one-minute test for any tool claiming institutional logic. Screenshot the signals on a handful of already-closed bars, walk away for a couple of hours, then come back and compare. If arrows moved or quietly disappeared, the “smart money” label is marketing – the tool is changing its story after the fact.
RelicusRoad Pro settles its entry signals when the candle closes and then locks them. An arrow on a closed bar does not drift on later ticks or bars. That is what makes the historical chart worth studying: you are reviewing what the tool genuinely showed in the moment, not a tidied-up version painted in with hindsight.
How can retail traders access institutional-grade tools?
Retail traders will never get the live order book or the private flow data a bank desk watches. What they can get is structural price analysis that reconstructs the same ideas from the chart: where liquidity is pooled, where buyers and sellers fall out of balance in the swing structure, and where the market is most likely to react.
RelicusRoad Pro puts those ideas on the chart in MT4, MT5, and TradingView. The Road Levels feature maps the zones where liquidity gets absorbed as the move happens. The Dynamic Reversals signal prints when a candle closes and structural conditions line up. Paired with supply and demand zone analysis and multi-timeframe confirmation , it walks the same confluence the desks do: find the zone, wait for direction to confirm, then execute with a defined stop.
An indicator cannot fix poor risk management – that is on you. What it can do is hand you a structural reason for an entry, instead of a lagging reading that tells you the trend already started.
Frequently asked questions
What is an institutional forex indicator?
An institutional forex indicator models how large participants – banks, hedge funds, prop desks – leave footprints in price action. It maps liquidity zones, order flow imbalances, or market microstructure concepts rather than simply smoothing price data.
How does an institutional indicator differ from a retail one?
Most retail indicators – momentum readings, moving averages, volatility bands – are calculated from price that already printed, so they lag by definition. Institutional tools map where large orders are likely resting or where liquidity will be hunted, so they lead rather than confirm.
What is a smart money indicator?
A smart money indicator identifies price areas where institutional participants are most likely accumulating or distributing positions. These areas often align with liquidity pools above swing highs or below swing lows.
Does “institutional” mean the indicator does not repaint?
Not by definition, but it should. Any indicator claiming to reflect real order flow must lock its signal at bar close – repainting would mean the signal is rewriting history, which defeats the purpose of forward-looking structural analysis.
Can retail traders use institutional-grade indicators on MT4 or MT5?
Yes. Tools like RelicusRoad Pro translate order flow and liquidity concepts into visual signals that work directly inside MT4, MT5, and TradingView without needing a live order book or an institutional data feed.
Ready to trade structure rather than lagging averages? Try RelicusRoad Pro and see where orders actually sit.