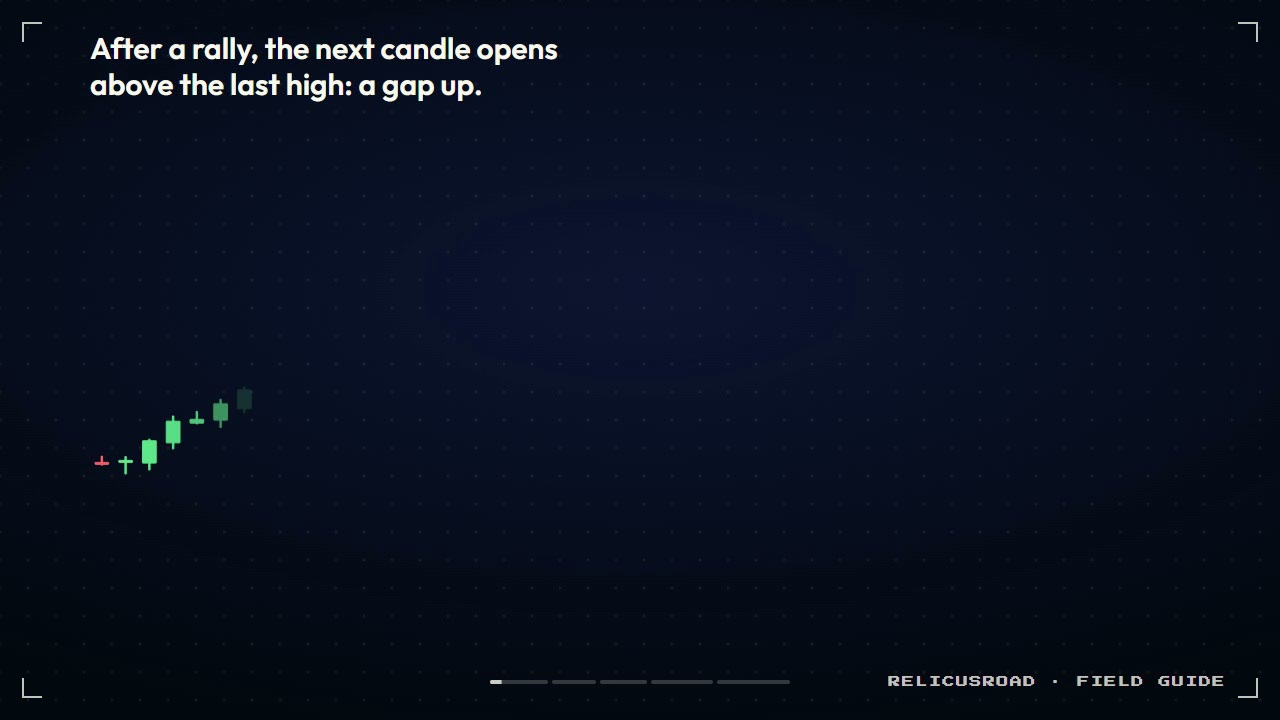
You bought the gap up. The rally looked healthy, the open jumped above yesterday’s high, and price held there for a few sessions. Then one morning it opened below everything you bought, with no trading in between. That cluster you were caught in is an island, and you are now on the wrong side of it.
By the end of this guide you will be able to spot an island reversal pattern while it forms, know exactly which close confirms it, and decide where the stop and target go before you sell.
Key Findings
- Two gaps, opposite directions: an island reversal is a cluster of candles cut off from the chart by a gap on the way in and a gap the other way on the way out.
- The close confirms it: the second gap counts only if the candle that opens it closes without trading back into the island.
- The stop is wide by design: for an island top the stop sits above the island's high, so position size, not stop distance, is what you adjust.
- Market hours decide how often it appears: charts that close overnight print islands regularly, while 24-hour forex charts mostly show them only at the Sunday open.
What is an island reversal pattern?
An island reversal pattern is a group of candles separated from the rest of the chart by a gap on each side. In an island top, price gaps up after a rally, moves sideways, then gaps down. The cluster in the middle sits alone above the chart, with no trading connecting it to the candles before or after.
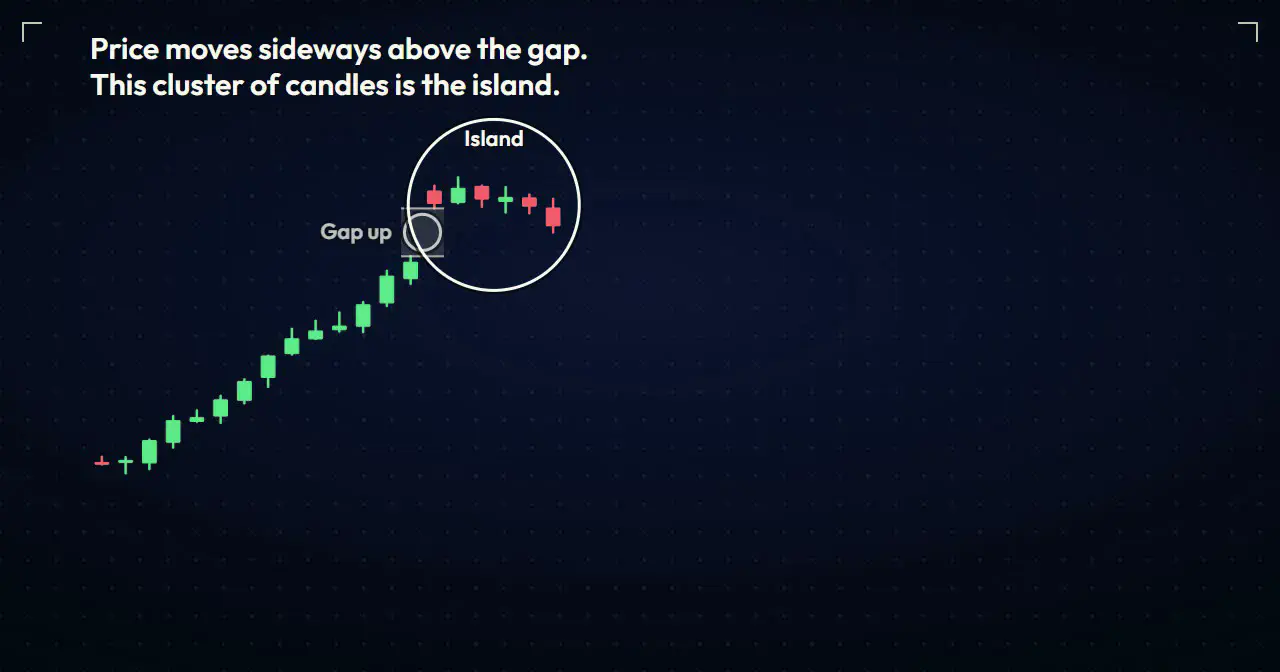
The circled candles are the island. Nobody who bought there can sell at that price again unless the market comes all the way back up through the second gap.
Edwards and Magee covered the pattern in their chapter on gaps in Technical Analysis of Stock Trends (first published 1948). They sort gaps into four kinds, and the island makes more sense once you know which two it is built from. Investopedia’s island reversal entry describes the same two-gap structure.
| Gap type | Where it appears | What it tells you |
|---|---|---|
| Common gap | Inside a quiet range | Little; these usually fill quickly |
| Breakaway gap | At the start of a new move | A range has ended and a trend may begin |
| Runaway gap | In the middle of a strong trend | The trend still has buyers (or sellers) |
| Exhaustion gap | Late in a long trend | The last push; often the first gap of an island |
- Where it appears
- Inside a quiet range
- What it tells you
- Little; these usually fill quickly
- Where it appears
- At the start of a new move
- What it tells you
- A range has ended and a trend may begin
- Where it appears
- In the middle of a strong trend
- What it tells you
- The trend still has buyers (or sellers)
- Where it appears
- Late in a long trend
- What it tells you
- The last push; often the first gap of an island
An island top is an exhaustion gap up followed by a breakaway gap down. The first gap is the crowd’s last burst of buying. The second gap is the market leaving without them. When the island is a single candle and the next one opens past that candle’s open, many traders read the pair as a kicker reversal instead.
Why does it hurt the traders inside it?
Because every position opened on the island is stuck behind a price nobody traded. Buyers who entered after the gap up now see the market open below their entry, with no fills in between where a stop could have worked at a sensible price.
That is the real force behind the pattern. Those trapped buyers become sellers on any bounce toward the gap, which is why a clean island often keeps falling instead of snapping back.
When is the second gap confirmed?
At the close of the candle that opens below the island. If that candle climbs back into the island before it closes, the gap has filled and there is no island. If it closes below the gap, the cluster is cut off and the pattern is complete.
Both charts open in the same place. The close is the only difference, and it decides whether you have a trade or a filled gap.
Where do entry, stop and target go?
Sell at the close of the candle that makes the gap down, as long as that candle has not traded back up into the island. Put the stop above the highest high inside the island. Set the target at a fixed multiple of your risk, such as 2R (twice the amount you stand to lose).
The clip runs in the order you should check things in real time, with the gap up first, then the island, then the gap down and its close. The sell line only appears after the gap-down candle has closed, because a gap that fills before the close is not a second gap at all.
There is no standard measured-move target for islands the way there is for a double top, so a risk multiple is the honest choice. If an older swing low sits closer than 2R, treat it as the first place price may stall.
The stop is wide, since it has to clear the whole island plus the gap. Keep the money at risk the same as on any other trade and let the lot size shrink to fit; the risk-reward ratio guide walks through that arithmetic.
Why do forex charts rarely show islands?
Spot forex trades around the clock from Sunday evening to Friday evening, New York time, so each candle opens close to where the last one closed. Without a nightly close, there is rarely a gap on either side of a cluster.
The gold dots mark every open that starts after a break in trading. Stocks get five a week; forex gets one. The New York Stock Exchange runs its regular session from 9:30 a.m. to 4 p.m. Eastern, which leaves an overnight hole before every open.
| Market | Daily close? | How often islands appear |
|---|---|---|
| Individual stocks | Yes, every night | Regularly, often around earnings or news |
| Stock index CFDs and futures | Short daily break | Sometimes, mostly on daily charts |
| Spot forex | No, only at the weekend | Rarely; the Sunday open is the usual gap |
| Crypto spot | Never closes | Almost never on exchange charts |
- Daily close?
- Yes, every night
- How often islands appear
- Regularly, often around earnings or news
- Daily close?
- Short daily break
- How often islands appear
- Sometimes, mostly on daily charts
- Daily close?
- No, only at the weekend
- How often islands appear
- Rarely; the Sunday open is the usual gap
- Daily close?
- Never closes
- How often islands appear
- Almost never on exchange charts
So if you trade forex, treat an island on a one-hour chart with suspicion. It may be a data gap from your broker’s feed rather than a real market gap. A weekly island built around a Sunday open is the version worth taking seriously, and the gap trading guide covers how weekend gaps behave.
How is an island different from a double top?
A double top tests the high twice; an island never revisits it. Both mark the end of a rally, but they form in opposite ways and give you different information about who is trapped.
| Island top | Double top | |
|---|---|---|
| Shape | Cluster cut off by two gaps | Two peaks at about the same price |
| Confirmation | Gap down holds through the close | Close below the low between the peaks |
| Who is trapped | Everyone who bought on the island | Buyers at the second peak |
| Usual target | A risk multiple (no standard height) | Height of the pattern, measured down |
- Island top
- Cluster cut off by two gaps
- Double top
- Two peaks at about the same price
- Island top
- Gap down holds through the close
- Double top
- Close below the low between the peaks
- Island top
- Everyone who bought on the island
- Double top
- Buyers at the second peak
- Island top
- A risk multiple (no standard height)
- Double top
- Height of the pattern, measured down
Thomas Bulkowski’s Encyclopedia of Chart Patterns (2nd edition, 2005) treats island reversals and double tops as separate patterns, and his pattern site catalogues them separately too. The gaps are what change how the trade behaves.
Where RelicusRoad Pro fits
An island is decided at the close, so the tools you check it against need to be decided at the close too. RelicusRoad Pro fixes its levels and signals once a candle has finished and does not move them afterwards, which means the support level you saw before the gap down is still there when you review the trade.
It will not find islands for you. What it gives you is a stable set of levels to judge the gap against: did price open below a level that held for weeks, or below a random candle? The non-repaint indicator explainer shows how to test that yourself.
Frequently asked questions
What is an island reversal pattern?
An island reversal is a group of one or more candles separated from the rest of the chart by a price gap on each side. In an island top, price gaps up after a rally, trades sideways for a while, then gaps down and leaves that cluster stranded above the chart. An island bottom is the mirror image after a decline. Edwards and Magee described it in Technical Analysis of Stock Trends (first published 1948) as a reversal that follows an exhaustion gap.
Is an island reversal bullish or bearish?
It depends on which way it points. An island top forms after a rally and is bearish, because the gap down traps everyone who bought above it. An island bottom forms after a decline and is bullish, because the gap up leaves recent sellers short below a price that was never revisited. The direction of the second gap tells you which one you have.
How do you trade an island reversal?
Wait for the candle that makes the second gap to close without filling it. For an island top, sell at that close, place the stop above the highest high inside the island, and aim for a target of at least twice the money at risk. Size the position from the stop distance, because the island’s full height usually makes the stop wider than on a normal pullback trade.
Can an island reversal form on forex charts?
Rarely on intraday or daily charts. Spot forex trades from Sunday evening to Friday evening New York time without a daily close, so each candle opens near the last one’s close and there is no overnight gap to strand a cluster. The weekend is the exception, because a big Sunday open can create one side of an island. Stock, index and futures charts that close every night produce them far more often.
What is the difference between an island reversal and an exhaustion gap?
An exhaustion gap is one gap at the end of a trend, the last push before buyers or sellers run out. An island reversal is what happens when that exhaustion gap is followed by a gap in the opposite direction, leaving the candles in between cut off. Every island top starts with an exhaustion gap, but most exhaustion gaps never become islands.
Caught on an island before? Mark the gap on your last losing trade, then compare it with the close-confirmed levels in RelicusRoad Pro to see whether the warning was there before the open.
Written for RelicusRoad by RelicusDigital.com.
Keep going on this topic
Support and Resistance Mastery: Zones, Breaks and Retests
Master support and resistance zones with repeatable drawing rules, breakout and retest confirmation, invalidation, position sizing and common mistakes.
- Bump and Run Reversal Pattern: How to Trade It
- Diamond Chart Pattern: How to Spot and Trade It
- Kicker Candlestick Pattern: How to Trade the Gap Reversal
- Marubozu candlestick: when a no-wick candle means it
- NR7 Trading Strategy: Trade the Quietest Candle in 7
- Price Channel Pattern: Trade Rising and Falling Channels
- Rising Three Methods Pattern: How to Trade the Pause
- Rounding Bottom Pattern: How to Trade a Base, Not a Bounce
- Shooting star candlestick pattern: one rejected high is not a top
- Spinning top candlestick pattern: the indecision candle
- Three white soldiers pattern: real reversal or exhausted run?
- Triangle chart pattern: trade the flat side, not the shape
- Triple Top and Triple Bottom Pattern: Trade the Third Test
- Tweezer top and bottom pattern: the level matters more than the candles
- VWAP: The Institutional Price Tag
- Wolfe Wave Pattern: Entry at Point 5, Target on Line 1-4