
You sold the bounce in a falling market. The next morning the price opened far above yesterday’s open, never came back down, and your stop went in the first hour.
That opening candle was probably a kicker candlestick pattern. It is a reversal where the second candle opens with a gap past the first candle’s open and runs the other way. By the end of this page you’ll be able to tell a real kicker from the look-alikes, plan where the buy, stop and target go, and judge whether your market can even print one.
Key Findings
- Gap past the open: a kicker's second candle opens beyond the first candle's open, not only beyond its close.
- No overlap: the two candle bodies never touch; if they do, the pattern is an engulfing candle.
- Plan on the close: buy (or sell) when the kicker candle closes, with the stop past its far end.
- Market matters: 24-hour forex rarely gaps, so most forex kickers form at the weekly open or on news.
What is a kicker candlestick pattern?
A kicker is two candles of opposite colour with a gap between them. In a bullish kicker, a red candle closes in a downtrend. The next candle opens above that red candle’s open and closes green, with its low still above the red open. A bearish kicker is the mirror image after a rise.
The older name is “kicking.” Greg Morris lists it in Candlestick Charting Explained (3rd edition, 2006) as two marubozu candles, meaning candles with little or no wick, separated by a gap. Thomas Bulkowski covers bullish and bearish kicking in Encyclopedia of Candlestick Charts (Wiley, 2008), and his candlestick pattern index lists the candle patterns he tested. Most traders today use “kicker” more loosely and don’t demand bare candles. The gap past the open is the part nobody drops.
Why does it matter? Because the gap means something happened while the market was shut or thin. Buyers who were happy to sell yesterday now refuse to sell anywhere near yesterday’s prices. That change of mind is what you are trading.
How is a kicker different from an engulfing candle?
An engulfing candle overlaps the first candle; a kicker never does. A bullish engulfing candle opens at or below the red close and climbs through the red body. A bullish kicker skips the red body completely, because it opens above the red open.
Watch where each green candle opens. On the left, sellers still get to trade at yesterday’s prices before buyers take over. On the right, they never get the chance.
| Bullish kicker | Bullish engulfing | Island reversal | |
|---|---|---|---|
| Candles needed | 2 | 2 | A cluster, cut off by two gaps |
| Where candle 2 opens | Above candle 1’s open | At or below candle 1’s close | Gap away from the cluster |
| Bodies overlap? | No | Yes, candle 2 covers candle 1 | No, gaps on both sides |
| Common in forex? | Rare, mostly weekly opens | Common | Rare |
| Where the stop goes | Under the kicker candle’s low | Under the engulfing candle’s low | Past the island’s extreme |
- Bullish kicker
- 2
- Bullish engulfing
- 2
- Island reversal
- A cluster, cut off by two gaps
- Bullish kicker
- Above candle 1’s open
- Bullish engulfing
- At or below candle 1’s close
- Island reversal
- Gap away from the cluster
- Bullish kicker
- No
- Bullish engulfing
- Yes, candle 2 covers candle 1
- Island reversal
- No, gaps on both sides
- Bullish kicker
- Rare, mostly weekly opens
- Bullish engulfing
- Common
- Island reversal
- Rare
- Bullish kicker
- Under the kicker candle’s low
- Bullish engulfing
- Under the engulfing candle’s low
- Island reversal
- Past the island’s extreme
If you see overlap, read the engulfing candle guide instead. If the reversal took several candles and left a gap on both sides, it is closer to an island reversal.
How do you trade a bullish kicker?
Buy when the kicker candle closes, put the stop under its low, and aim for at least twice the risk. Don’t buy the open. A candle that gaps up can still drop back into the gap before it closes, and then it isn’t a kicker.
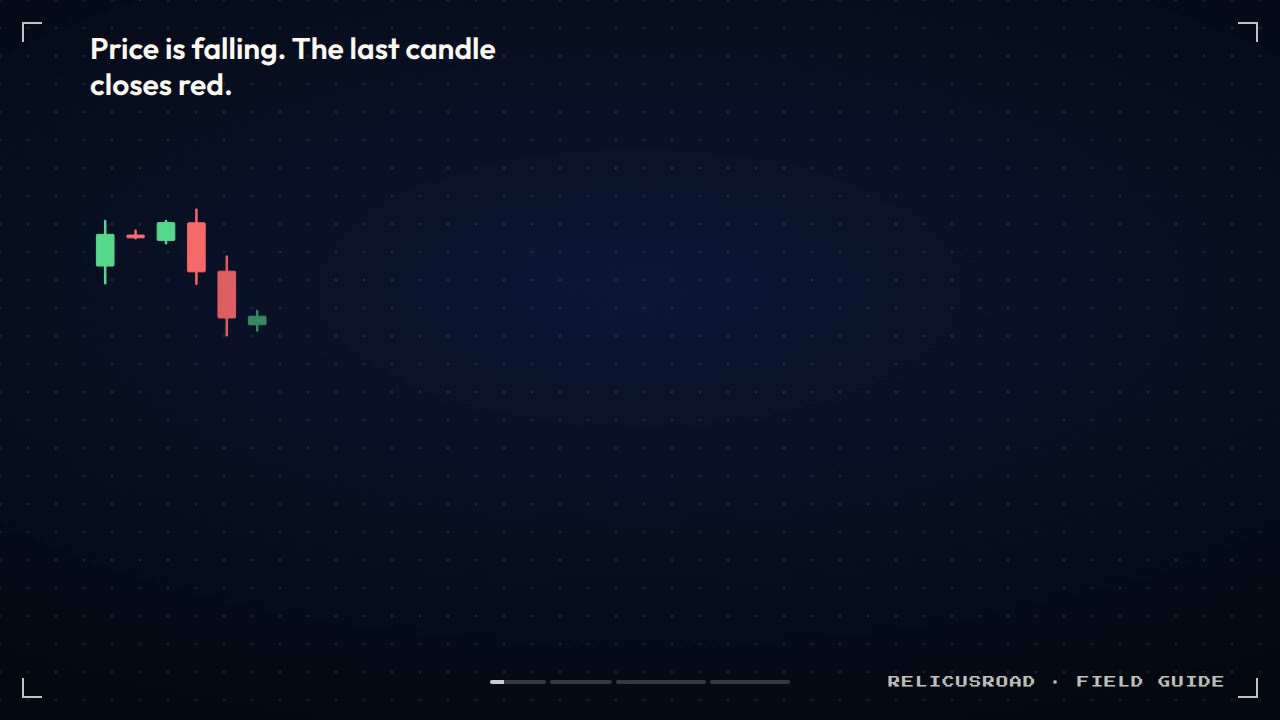
The clip shows the fall first, then the gap, then the levels, and last the candles that reach the target. Here is the same plan in words:
- Check the trend. There should be a clear fall before the red candle. A kicker in a sideways range has nothing to reverse.
- Check the open. The green candle must open above the red candle’s open, not only above its close.
- Wait for the close. If the low of the green candle stays above the red open all session, the gap held.
- Buy the close. Put the stop a few points under the kicker candle’s low.
- Measure the risk (1R). Your target is at least 2R above the entry, ideally at a level the chart already shows, such as an old swing high.
That last point is where most kicker trades go wrong. The pattern looks so strong that traders keep their usual lot size and risk far more than they planned. Work the position size out from the stop with the position sizing routine, then decide.
What about the bearish kicker?
A bearish kicker is the same idea after a rise, traded the other way. A green candle closes in an uptrend, then the next candle opens below the green candle’s open and closes red, with its high still under that open. Sell on the close, put the stop a little above the kicker’s high, and target at least 2R below.
Bearish kickers often come from bad news released while the market is closed: a weak earnings report, a surprise rate decision. That is also why they are hard to catch from the right side. By the time the candle closes, a big part of the move may already be done, and the 2R target may sit too far away to be realistic. If it does, let this one go.
Can you trade kickers on forex charts?
Yes, but you’ll see them far less often than on stocks. Spot forex trades around the clock from Sunday evening to Friday evening, so most candles open right where the last one closed. A true gap needs a break in trading, and the weekend is the main one.
| Market | How often real kickers form | Where to look |
|---|---|---|
| Spot forex | Rarely | Sunday open, surprise central bank news |
| Stocks and ETFs | More often | Daily open after earnings or news |
| Index and commodity futures | Sometimes | After the daily or weekend close |
| Crypto | Rarely on spot | Gaps appear mostly on futures that close |
- How often real kickers form
- Rarely
- Where to look
- Sunday open, surprise central bank news
- How often real kickers form
- More often
- Where to look
- Daily open after earnings or news
- How often real kickers form
- Sometimes
- Where to look
- After the daily or weekend close
- How often real kickers form
- Rarely on spot
- Where to look
- Gaps appear mostly on futures that close
Some brokers also show small gaps that are only spread widening at rollover. Those aren’t kickers. A real one shows a clear jump on more than one broker’s feed, which is worth checking before you act. The gaps trading guide covers weekend opens in more detail.
Where does RelicusRoad Pro fit?
A kicker tells you that the mood changed. It doesn’t tell you where the move is likely to stall. RelicusRoad Pro draws support and resistance zones and key levels on MT4 and MT5, so you can see before entry whether there is room for a 2R target or a zone sitting right above the kicker. The standalone Support Resistance tool does that one job if it’s all you need.
The pattern still has to be real, and you still set the stop before you click buy. The tools help you decide if the trade is worth taking at all.
Frequently asked questions
What is a kicker candlestick pattern? A two-candle reversal. The second candle opens with a gap past the first candle’s open and runs the other way without trading back into the first body. Bullish kickers turn a fall up; bearish kickers turn a rise down.
Is a kicker the same as an engulfing candle? No. An engulfing candle opens inside or below the first candle and climbs through it, so the bodies overlap. A kicker opens past the first candle’s open, leaving a gap and no overlap.
Where do you put the stop on a bullish kicker? Under the kicker candle’s low. Below it, price is heading back into the gap and the reason for the trade is gone.
Why don’t I see kicker patterns on forex charts? Forex trades from Sunday evening to Friday evening without a break, so candles rarely gap. Look at the weekly open, surprise news, or markets that close each day.
Is a kicker a reliable pattern? No candlestick pattern works alone. A kicker shows a sharp change of mind, but it can still fail, so set the stop first and size the trade from it.
Pull up the last sharp reversal on your chart and check where the second candle opened: above the red open, or inside the red body? To see whether a kicker has room to run before you buy it, look at RelicusRoad Pro.
Written for RelicusRoad by RelicusDigital.com.
Keep going on this topic
Support and Resistance Mastery: Zones, Breaks and Retests
Master support and resistance zones with repeatable drawing rules, breakout and retest confirmation, invalidation, position sizing and common mistakes.
- Rising Three Methods Pattern: How to Trade the Pause
- Marubozu candlestick: when a no-wick candle means it
- NR7 Trading Strategy: Trade the Quietest Candle in 7
- Price Channel Pattern: Trade Rising and Falling Channels
- Rounding Bottom Pattern: How to Trade a Base, Not a Bounce
- Shooting star candlestick pattern: one rejected high is not a top
- Spinning top candlestick pattern: the indecision candle
- Three white soldiers pattern: real reversal or exhausted run?
- Triangle chart pattern: trade the flat side, not the shape
- Triple Top and Triple Bottom Pattern: Trade the Third Test
- Tweezer top and bottom pattern: the level matters more than the candles
- VWAP: The Institutional Price Tag
- Wolfe Wave Pattern: Entry at Point 5, Target on Line 1-4
- Supply and Demand Zones: The Only Support & Resistance That Matters
- Candlestick patterns cheat sheet: bullish, bearish, neutral
- Bullish candlestick patterns: 9 that matter, ranked



