
MACD vs RSI: Differences, Signals and When to Use Each
The MACD vs RSI question has no universal winner. MACD describes the relationship between moving averages, while RSI compares the strength of recent gains with recent losses. They process the same price history differently, so each can highlight a different part of market behavior.
Use MACD when you need trend and momentum context. Use RSI when you need a normalized view of momentum or want to test overbought, oversold and divergence conditions. Use them together only when each indicator has a separate job.
If you are comparing RSI vs MACD for a trading plan, begin with the decision you need to make. Neither indicator creates reliable buy and sell signals on its own. Their value comes from making one technical-analysis rule measurable, then checking it against price action and trading costs.
What is the difference between MACD and RSI?
MACD, or Moving Average Convergence Divergence, is built from exponential moving averages. RSI, or Relative Strength Index, converts recent upward and downward price changes into an oscillator between 0 and 100. MACD has no fixed upper or lower boundary; RSI does.
The full name Relative Strength Index, or RSI, is sometimes shortened in searches to “strength index RSI.” It measures internal momentum in one market; it does not compare the instrument with another asset. Moving Average Convergence Divergence (MACD), meanwhile, measures the relationship between a fast and slow exponential moving average.
| Feature | MACD | RSI |
|---|---|---|
| Main calculation | Difference between moving averages | Ratio of recent gains and losses |
| Display | Lines and histogram around a zero line | Oscillator from 0 to 100 |
| Common signals | Line crossover, zero-line position, histogram change | 70/30 levels, midpoint, divergence |
| Typical strength | Trend and momentum context | Momentum extremes and relative strength |
| Typical weakness | Delayed after rapid moves | Can remain extreme during strong trends |
- MACD
- Difference between moving averages
- RSI
- Ratio of recent gains and losses
- MACD
- Lines and histogram around a zero line
- RSI
- Oscillator from 0 to 100
- MACD
- Line crossover, zero-line position, histogram change
- RSI
- 70/30 levels, midpoint, divergence
- MACD
- Trend and momentum context
- RSI
- Momentum extremes and relative strength
- MACD
- Delayed after rapid moves
- RSI
- Can remain extreme during strong trends
Both are derived from past price. Calling RSI “leading” and MACD “lagging” can hide the real trade-off: a more sensitive setting reacts sooner but also reacts to more noise. If raw RSI’s noise is your main complaint, a smoothed variant like the QQE indicator sits between the two, keeping RSI’s read while borrowing some of MACD’s calm.
How does RSI work?
RSI compares average gains and average losses over a selected period, commonly 14 candles. A reading above 70 is often labelled overbought and below 30 oversold, but those labels describe recent momentum rather than a required reversal. J. Welles Wilder introduced RSI in his 1978 book New Concepts in Technical Trading Systems and recommended the 14-period setting and the 70 and 30 lines (Wikipedia summary).
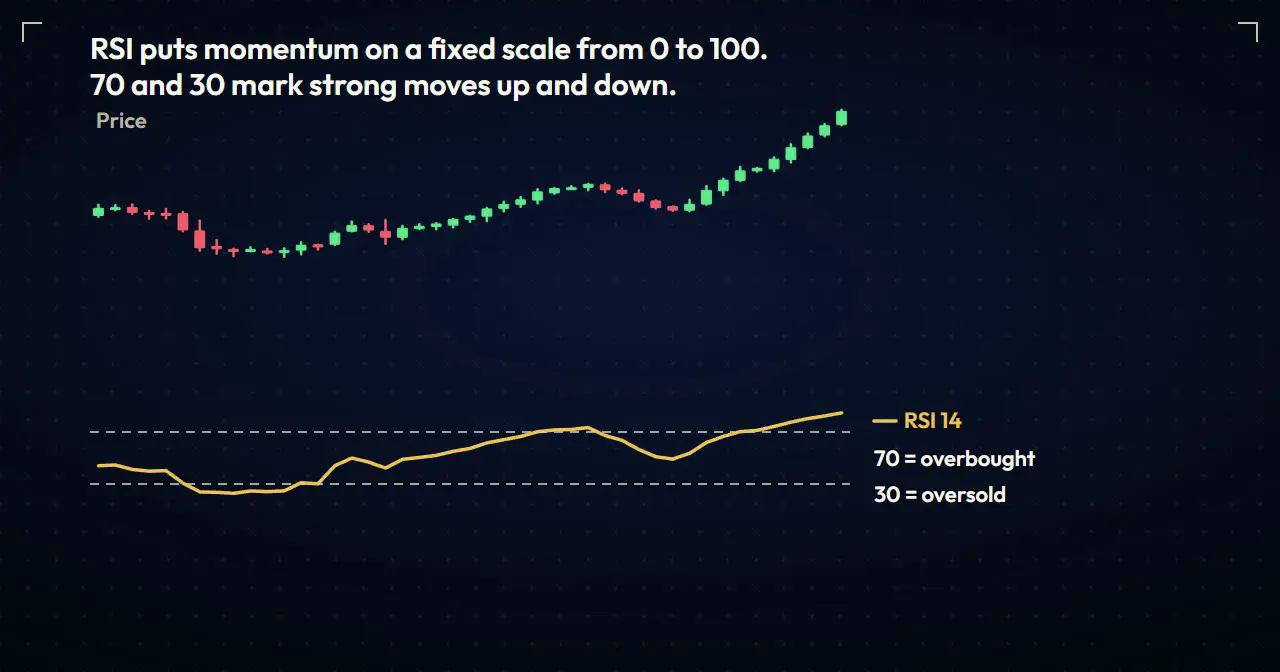
RSI can support three distinct tests:
- Momentum range: Is RSI holding mainly above or below 50?
- Extreme and recovery: Does price confirm after RSI exits an extreme area?
- Divergence: Is price making a new extreme while momentum is not?
The RSI settings guide compares periods 2, 9, 14 and 21 by responsiveness, timeframe and market condition. The setting should be part of the written rule, not changed after each losing trade.
How does MACD work?
The standard MACD subtracts a slower exponential moving average from a faster one and applies a signal-line average to the result. Gerald Appel created it in the late 1970s, and the common settings are 12, 26 and 9: a 12-period and a 26-period EMA, and a 9-period signal line (Wikipedia summary). The histogram shows the distance between the MACD line and signal line. A growing positive histogram means that distance is increasing; it does not guarantee price will continue higher. Because MACD reports that distance in the instrument’s own price units, its scale shifts with how expensive the market is. For the same read on a percentage scale that holds across different symbols, PPO, the percentage version of MACD, plots the gap as a percent of the slower average.
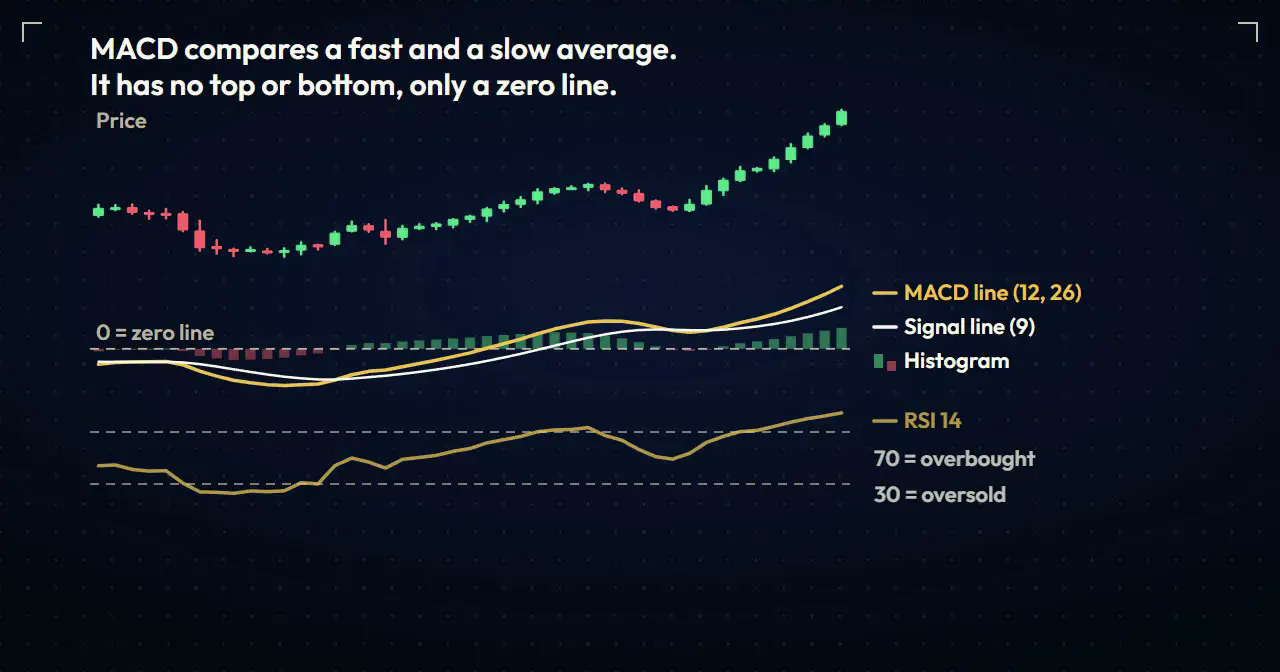
Three common MACD observations are:
- Signal-line crossover: The MACD line crosses its signal line.
- Zero-line position: The faster average is above or below the slower average.
- Histogram contraction: The distance between the lines is narrowing.
A crossover can arrive after a large part of the move has occurred, particularly after a sharp candle. Check price location and invalidation instead of treating the crossover as an entry by itself.
A bullish MACD crossover occurs when the MACD line crosses above the signal line; a bearish crossover occurs when it crosses below the signal line. These events are often described as a buy signal or sell signal, but that label is incomplete. MACD settings, the long-term trend and the location of the crossover determine whether the event is useful or simply a false signal inside congestion.
Is MACD or RSI better in a trending market?
MACD often provides clearer trend context because its zero-line position and moving-average relationship show direction. RSI can still help, but an overbought reading during a strong uptrend is not automatically a sell signal. In trends, RSI may be more useful as a pullback or momentum-range filter than as a reversal trigger.
One testable trend workflow is:
- Use higher-timeframe structure to define direction.
- Require MACD to remain on the same side of zero as that direction.
- Wait for RSI to pull back toward a predefined level.
- Enter only after price confirms that the pullback is ending.
- Exit if price reaches the structural invalidation point.
MACD is context in this example, RSI is timing and price is the trigger. That separation makes the rule easier to audit.
Is RSI or MACD better in a range?
RSI may be easier to interpret in a range because its bounded scale highlights momentum near repeated price extremes. MACD crossovers can multiply when moving averages flatten, creating alternating signals with little follow-through.
Even in a range, do not buy simply because RSI is below 30. First mark the range boundary using support and resistance zones, then require price to reject the area. If price closes beyond the range and holds, stop applying the range rule.
How do you read MACD and RSI together?
Read MACD and RSI together by giving each indicator a separate job. MACD can define trend and momentum context while RSI marks a pullback or momentum condition. Price should still trigger the entry and define invalidation. If both indicators merely repeat “bullish,” the second signal may add delay instead of useful confirmation.
Both indicators are transformations of price, and both can respond to the same candle. A useful combination assigns a separate decision to each tool and compares the combined version with a simpler baseline.
Trend-pullback framework
Use MACD for trend context and RSI for the pullback:
- Higher-timeframe structure and MACD agree on direction.
- RSI moves against that direction without breaking the structural trend.
- Price forms a defined rejection or continuation trigger.
- The stop sits beyond price invalidation, not at an indicator value.
- Position size is calculated from the stop distance.
This framework does not claim the indicators improve performance. It creates a hypothesis that can be tested.
For a MACD and RSI strategy, write separate entry and exit rules instead of waiting for both indicators to “look good.” For example, MACD can define direction, RSI can define the pullback condition and a break of price structure can trigger entry. The exit should still come from invalidation, a tested target or a risk rule rather than from whichever indicator changes first.
Divergence framework
Price can diverge from RSI, MACD or both. Divergence shows that the selected momentum measure is not confirming the latest price extreme, but a trend can continue after divergence appears.
Treat divergence as an alert:
- Mark the mismatch between price and the indicator.
- Wait for price to break or reject a relevant structure level.
- Define the point that disproves the reversal idea.
- Avoid entering if the available target does not justify the planned risk.
The RSI divergence guide covers confirmation and invalidation in more detail.
When do MACD and RSI give false signals?
MACD can cross repeatedly when price is choppy, and it can confirm late after a sudden move. RSI can remain overbought or oversold during a persistent trend and becomes increasingly noisy with shorter periods.
Common failure conditions include:
- Trading a low-timeframe crossover without considering spread or slippage.
- Trading against a strong trend solely because RSI reached 70 or 30.
- Treating histogram contraction as proof of an imminent reversal.
- Adding more indicators until a past chart looks perfect.
- Entering without a price-based invalidation point.
See leading vs lagging indicators for a clearer way to think about reaction speed, confirmation and repaint risk.
How should you test MACD vs RSI?
Build three versions of the same strategy: price plus MACD, price plus RSI, and price plus both. Keep the market, timeframe, stop, exit and risk assumptions constant. This shows whether the second indicator adds information or merely reduces the number of trades.
Record net outcome after costs, average win and loss, drawdown, losing sequences and the number of valid setups. Then validate the rule on a later period that was not used to tune the settings.
Avoid optimizing only for win rate. A high win rate can still produce a losing strategy if the average loss is much larger than the average win.
Key takeaways
- MACD emphasizes trend and changes in moving-average momentum.
- RSI normalizes recent gains and losses and often reacts faster.
- Neither indicator predicts a reversal or removes market risk.
- Combining them is useful only when each tool has a distinct job.
- Price confirmation, invalidation and position sizing remain essential.
Trading leveraged products can produce losses quickly. This article is educational and is not financial advice.
Next step: Compare the indicator roles with the leading vs lagging guide before adding another signal to your chart.
Keep going on this topic
The Best Trading Indicators for MT4, MT5 and TradingView in 2026
An honest breakdown of trading indicators for MT4, MT5 and TradingView: which categories add real edge, which are noise, and how many you actually need.
- MACD: It's Not Just a Crossover Signal
- Best RSI Settings for Scalping: 2, 9, 14 or 21?
- RSI Divergence: The Early Warning System
- Stochastic Oscillator for Forex: A Range Map You Can Trust
- The Stochastic RSI Indicator: Speed Without the Whipsaw
- The Bollinger Squeeze: Catching the Explosion
- Moving Average Crossover Strategy: Rules and Whipsaw Filters
- Parabolic SAR: The Idiot-Proof Trailing Stop
- The Ichimoku Cloud: The 5-Second Scan Strategy
- Currency Strength Meter: How to Read It Without Chasing False Signals
- Signal Lines Strategy: The 'Heartbeat' of Market Momentum
- Signal Cloud Strategy: Visualizing the 'Mood' of the Market
- Super Trend Indicator Guide: The 'Traffic Light' for Market Trends
- The Supertrend Indicator: Trading Trend Flips Without Chasing the Repaint
- Tick Volume vs Real Volume: What Your Forex Chart Actually Counts
- Cumulative volume delta: what it shows and what it can't



