Price drops hard, closes well under the lower Bollinger Band, and you buy because it “has to bounce”. It does not. It keeps falling, and your stop goes with it. A mean reversion trading strategy can work, but only when the market is moving sideways and only after price shows it has stopped running.
In short, you confirm the market is in a range, wait for a close outside the band, then buy only when a candle closes back inside. Put the stop below the low and aim for the middle band. By the end you will know when to use this setup and when to leave it alone.
Key Findings
- Range first: mean reversion only pays when the 20-candle average is flat and price keeps crossing it.
- The close back inside is the entry: a close outside the band warns you; the next close back inside tells you the run has paused.
- The average is the target: you aim for the middle band, so the reward is set by the chart, not by you.
- Trends break it: repeated closes outside the band mean the range is over, and buying more only makes the loss bigger.
What is a mean reversion trading strategy?
It is a bet that a sharp move away from the average will come back toward it. You buy after price falls far below its recent average, or sell after it rises far above it, and you take profit at the average. The whole method depends on the market having a stable middle to return to.
Most traders measure that middle with Bollinger Bands, created by John Bollinger and laid out in his 2001 book Bollinger on Bollinger Bands. The middle band is a 20-candle simple average. The upper and lower bands sit two standard deviations away, a measure of how much price has been swinging. When price closes outside a band, it has moved unusually far from the average for that market.
The idea has academic roots. Poterba and Summers’ 1988 paper in the Journal of Financial Economics, “Mean reversion in stock prices”, found signs of it in stock returns over periods of several years. That is a long way from an H1 chart. On short timeframes, the pull back to the average only shows up while the market is moving sideways.
When does mean reversion work, and when does it fail?
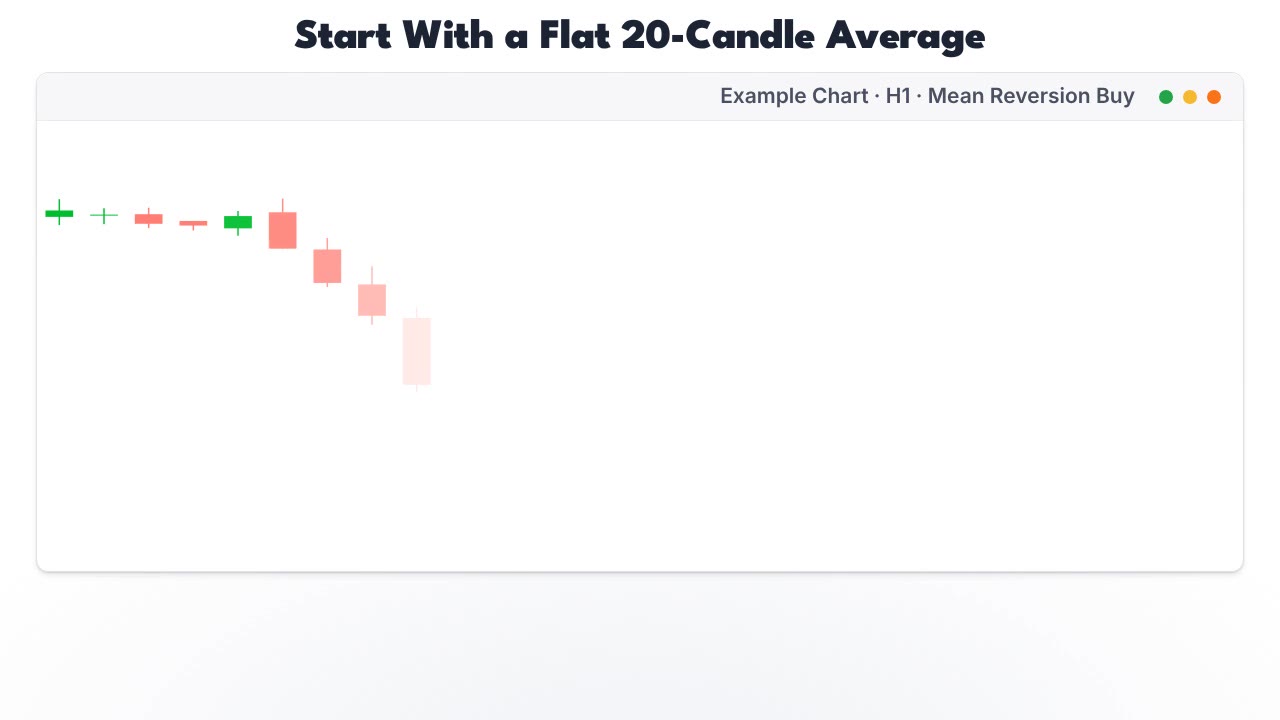
It works in a range and fails in a trend. Before any trade, look at the 20-candle average. If it is flat and price crosses it again and again, you are in a range. If it slopes and price closes on one side, you are in a trend, and a close outside the band can be the start of a bigger move.
Only the left column gets a trade. The right column is where most mean reversion losses come from.
If you want a number for “flat”, the choppiness index measures how much a market is going sideways rather than trending. A simpler check is to count how many times price crossed the middle band in the last 30 candles.
How do you trade it step by step?
Wait for a close outside the band, then buy above the first candle that closes back inside. The stop goes below the lowest low of the drop and the target is the middle band. Here are the buy rules; for a sell, flip each one.
- Confirm the range. The middle band is flat and price has crossed it several times recently.
- Wait for a close below the lower band. A wick through the band does not count. You want the candle to close outside it.
- Wait for the close back inside. The next candle, or one of the next few, closes back above the lower band. That is your signal candle.
- Buy above its high. Place a buy stop order slightly above that high, so you are only filled if buyers keep pushing.
- Stop below the low of the drop. Use the lowest low since the first close outside the band, minus a small buffer. In our figures the buffer is a third of ATR, the average candle range over 14 candles.
- Target the middle band. Use its value when you enter. It moves as new candles print, so fix the price.
That check matters more here than in trend trading. The average sets your target, so you cannot stretch it to make the numbers look better.
What does a winning trade look like?
A close below the band, a close back inside, then a steady climb to the middle band. The clip below runs the rules on a sideways chart: the blue lines are the upper and lower bands, the purple line is the middle band.
The buy filled at 1.0742 with the stop at 1.0712, under the low of the drop. The target at 1.0806 was the middle band on the signal candle, a bit more than twice the risk. It was hit five candles after entry. These are made-up example prices to show the rules, not a trade we took. Many real setups give a smaller target than this, which is why the quick test above comes first.
Mean reversion vs pullback vs breakout: which fits the market?
Match the method to the market you are looking at. Mean reversion suits a range. A pullback entry suits a trend. A breakout suits the moment a range ends. Use the wrong one and good rules still lose.
| Mean reversion | Pullback | Breakout | |
|---|---|---|---|
| Market it needs | Sideways, flat average | Clear trend | A range about to end |
| What you trade | A move away from the average | A dip inside the trend | Price clearing a level |
| Where the target is | The average | A multiple of the risk, or the next level | A multiple of the risk |
| Main risk | The range turns into a trend | The dip turns into a reversal | The breakout fails |
- Mean reversion
- Sideways, flat average
- Pullback
- Clear trend
- Breakout
- A range about to end
- Mean reversion
- A move away from the average
- Pullback
- A dip inside the trend
- Breakout
- Price clearing a level
- Mean reversion
- The average
- Pullback
- A multiple of the risk, or the next level
- Breakout
- A multiple of the risk
- Mean reversion
- The range turns into a trend
- Pullback
- The dip turns into a reversal
- Breakout
- The breakout fails
The pullback trading strategy covers the second column. To read how far price sits inside the bands as a single number, the Bollinger %B guide shows how.
What mistakes make mean reversion trades fail?
The biggest one is adding to a loser. Price closes outside the band, you buy, it closes outside again, and you buy more at a “better” price. In a range that sometimes works. In a trend it turns one stop into a much bigger loss.
John Bollinger’s own published rules for his bands make a related point: a touch of a band is not, by itself, a signal to buy or sell. The others are smaller but common:
- buying the first close outside the band instead of waiting for the close back inside
- moving the stop lower when price comes near it
- trading right before major news, such as the US jobs report, when ranges often break
- taking a setup where the middle band is closer than the stop
Where RelicusRoad Pro fits
A mean reversion buy works better when the drop stops at a level buyers have defended before. RelicusRoad Pro draws support and resistance levels once a candle closes and keeps them where they were drawn. When a close back inside the band happens on one of those levels, two separate reasons point to the same buy.
It does not tell you whether the market is ranging. That check, and the stop, stay with you.
Frequently asked questions
What is a mean reversion trading strategy?
It is a way to trade a sharp move away from an average by betting that price will come back toward it. In a sideways market you buy after price drops well below its 20-candle average and a candle closes back inside the lower Bollinger Band. The target is the average, and the stop sits below the low of the drop.
Does mean reversion work in a trend?
Usually not. In a trend, price can keep closing outside the band for many candles, and each buy against it gets stopped out. Use mean reversion when the 20-candle average is flat and price keeps crossing it. When the average slopes and closes stay on one side, switch to a trend method or stay out.
Which indicator is best for mean reversion?
Bollinger Bands are a common choice, because the middle band is the 20-candle average and the outer bands show how far price has moved from it. RSI and the Stochastic are also used to spot moves that have gone far. No indicator tells you on its own that the market is ranging, so check the average’s slope first.
Where should the stop go on a mean reversion trade?
Below the lowest low of the drop for a buy, or above the highest high of the rally for a sell, with a small buffer for normal noise. If price goes past that point, the move away from the average is still going and the idea is wrong. Size the trade from that distance.
Is mean reversion the same as buying the dip?
No. Buying the dip means buying a drop inside an uptrend and holding for the trend to continue. Mean reversion buys a drop inside a sideways market and sells at the average. The targets are different, and so are the markets each one suits.
Check the range first, wait for the close back inside the band, then see whether it landed on a level in RelicusRoad Pro.
Written for RelicusRoad by RelicusDigital.com.
Keep going on this topic
Support and Resistance Mastery: Zones, Breaks and Retests
Master support and resistance zones with repeatable drawing rules, breakout and retest confirmation, invalidation, position sizing and common mistakes.
- Pullback Trading Strategy: Buy the Dip Inside a Trend
- Trendline Trading Strategy: Draw It Right, Then Trade It
- Mind the Gap: Trading Weekly Opens and Fair Value Gaps
- Dynamic Reversals: How to Catch the Turn Without Getting Wrecked
- Fractal Arrows Strategy: The 'Chaos Theory' of Market Turns
- Volume Profile Explained: Finding Value in the Noise
- Stop Trading Patterns: Why Order Flow Rules the Market
- The Russian Doll: Mastering Multi-Timeframe Analysis
- Multi-TF Trend Bar: Seeing the 'Matrix' of Market Trends
- Institutional Forex Indicators: How Smart-Money Tools Differ From Retail Ones
- Fair Value Gap Indicator: How to Spot and Trade FVGs Without Guesswork
- Renko Charts: Filtering the Noise for Pure Price Action
- Heikin Ashi: The Trend Smoother
- Head and Shoulders Pattern: How to Trade the Reversal Without Chasing Ghosts
- Double Top and Double Bottom Pattern: Trading the Reversal Without Guessing the Turn
- Cup and Handle Pattern: How to Trade the Breakout