
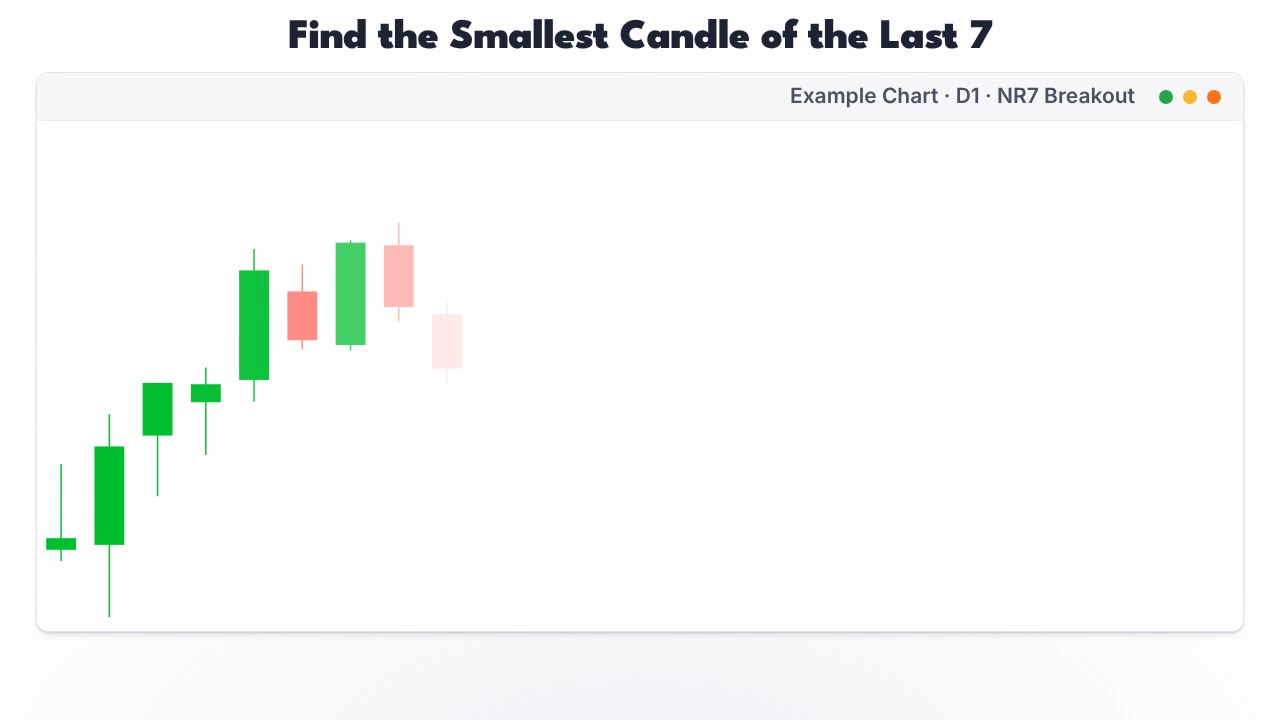
Price has been sliding sideways for days. Every candle is a little smaller than the last, and you can’t tell whether to buy, sell or close the chart. The NR7 trading strategy turns that quiet patch into a plan: find the narrowest candle of the last seven, then let price show you the direction before you commit.
By the end you’ll know how to spot an NR7, where the buy, sell and stop orders go, and which NR7 candles to leave alone.
Key Findings
- Definition: an NR7 is the candle with the smallest high-to-low range of the last seven, counting itself.
- Origin: Toby Crabel described narrow-range candles, NR4 and NR7, in his 1990 book on short-term price patterns.
- No direction: an NR7 says price has gone quiet, not which way it will break, so the plan covers both sides.
- Small risk: the stop sits on the far side of a small candle, so the distance from entry to stop is short.
What is an NR7 candle?
An NR7 is the candle whose range is the smallest of the last seven. Range means the distance from the high to the low, wicks included. Measure today’s candle and the six before it. If today’s number is the lowest, today is an NR7.
The clip shows why the body alone is the wrong thing to look at. A candle can have a tiny body and long wicks, and that is not a narrow range. Count the wicks.
The idea comes from Toby Crabel’s Day Trading with Short Term Price Patterns and Opening Range Breakout (1990). StockCharts’ ChartSchool article on the NR7 uses the same definition and credits Crabel. He also used a shorter version, the NR4: the smallest range of the last four candles. An NR7 is rarer, so it is a stricter filter.
Why does a quiet candle matter?
Quiet candles tend to come before bigger ones. Markets move between calm stretches and busy ones. When the range has shrunk to its smallest in seven candles, buyers and sellers have stopped pushing, and the next push often breaks the stalemate with a wider candle.
That is the whole edge the pattern claims, and it’s a narrow one. A wider candle can go up or down. An NR7 gives you a time to pay attention and a small candle to put a stop behind. It does not give you a direction.
How does the NR7 trading strategy place orders?
Place orders on both sides of the NR7 candle and let price pick one. After the NR7 closes, put a buy stop order a little above its high and a sell stop order a little below its low. When one fills, cancel the other. The stop goes on the far side of the NR7 candle.
| Order | Where it goes | What happens next |
|---|---|---|
| Buy stop | A little above the NR7 high | If it fills, cancel the sell order |
| Sell stop | A little below the NR7 low | If it fills, cancel the buy order |
| Stop for a buy | A little below the NR7 low | Price is back through the whole candle, so the idea failed |
| Stop for a sell | A little above the NR7 high | Same failure, the other way |
| Target | A fixed multiple of the risk, such as 2R | Or the next support or resistance level |
- Where it goes
- A little above the NR7 high
- What happens next
- If it fills, cancel the sell order
- Where it goes
- A little below the NR7 low
- What happens next
- If it fills, cancel the buy order
- Where it goes
- A little below the NR7 low
- What happens next
- Price is back through the whole candle, so the idea failed
- Where it goes
- A little above the NR7 high
- What happens next
- Same failure, the other way
- Where it goes
- A fixed multiple of the risk, such as 2R
- What happens next
- Or the next support or resistance level
R is the distance from your entry to your stop. A 2R target sits twice that distance away in the direction of the trade.
The figure shows the sell side. The NR7 low broke first, so the sell filled, the buy order was cancelled, and the target at twice the risk was reached four candles later. Flip every level and you have the buy side, which is what the banner at the top of this page walks through.
One honest caveat. The stop is tight because the candle is small, and tight stops get hit by normal noise. If the NR7 is tiny compared with recent candles, add a small buffer beyond the high and low rather than placing orders right on them.
NR7 vs inside bar vs Bollinger squeeze: what’s the difference?
All three look for a quiet market, but they measure it differently. An NR7 compares one candle’s range with the six before it. An inside bar only needs to sit inside the previous candle. A Bollinger squeeze looks at how narrow the bands are, which is a smoothed reading over many candles.
| NR7 | Inside bar | Bollinger squeeze | |
|---|---|---|---|
| What it measures | Smallest range of 7 candles | High and low inside the previous candle | Band width at a low |
| Candles involved | 7 | 2 | Usually 20 or more |
| Known when | The candle closes | The candle closes | Builds over several candles |
| Gives a direction? | No | No | No |
| Natural stop | Other side of the NR7 | Other side of the inside bar | Middle band or the opposite band |
- NR7
- Smallest range of 7 candles
- Inside bar
- High and low inside the previous candle
- Bollinger squeeze
- Band width at a low
- NR7
- 7
- Inside bar
- 2
- Bollinger squeeze
- Usually 20 or more
- NR7
- The candle closes
- Inside bar
- The candle closes
- Bollinger squeeze
- Builds over several candles
- NR7
- No
- Inside bar
- No
- Bollinger squeeze
- No
- NR7
- Other side of the NR7
- Inside bar
- Other side of the inside bar
- Bollinger squeeze
- Middle band or the opposite band
They can overlap. A candle that is both an inside bar and an NR4, often written ID/NR4, passes both tests at once. If you already trade the inside bar strategy, the NR7 is a stricter version of the same idea: wait for a quiet candle, trade the side that breaks. The Bollinger squeeze covers the slower, band-based version.
When should you skip an NR7?
Skip it when the breakout has nowhere to go or when news is about to hit. A buy above an NR7 high that sits right under strong resistance has very little room before sellers show up. The same goes for a sell right above support.
Also watch for the failed break. Price pokes above the NR7 high, fills the buy, then closes back below the NR7 low. That is your stop doing its job. Some traders then take the sell side, but that is a different trade with its own plan; the failed breakout guide covers it.
Where RelicusRoad Pro fits
An NR7 tells you when price has gone quiet. It doesn’t tell you whether the breakout has room to run. That second question is where RelicusRoad Pro helps: it draws support and resistance levels once a candle has closed and leaves them where they were drawn, so you can see whether an NR7 sits in open space or pressed against a level.
Use the NR7 for timing and the levels for room. If the nearest level is closer than your 2R target, either aim for the level or pass on the trade.
Frequently asked questions
What does NR7 mean in trading?
NR7 stands for narrow range 7. It is a candle whose range, the distance from its high to its low, is the smallest of the last seven candles including itself. Traders read it as a sign that price has gone quiet and a bigger move may be close. It does not say which direction that move will take.
Who created the NR7 pattern?
The NR7 is credited to Toby Crabel, who described narrow-range days, including NR4 and NR7, in his 1990 book Day Trading with Short Term Price Patterns and Opening Range Breakout. Later trading books and charting sites, including StockCharts’ ChartSchool, use his definition.
What is the difference between NR4 and NR7?
Only the lookback. An NR4 is the smallest range of the last four candles; an NR7 is the smallest of the last seven. NR7 candles are rarer, because the candle has to beat more neighbours, so many traders treat an NR7 as a stronger sign that price has gone quiet.
Where should the stop go on an NR7 breakout?
The common choice is the other side of the NR7 candle: below its low for a buy, above its high for a sell. Because the NR7 is small, that stop is usually close to the entry, which keeps the risk per trade small. If price breaks one side and then closes back through the other side, the setup has failed.
Does the NR7 pattern repaint?
The pattern itself cannot repaint once the candle has closed, because seven finished ranges do not change. It can look like an NR7 while the candle is still forming and then stop being one if the range widens before the close. Wait for the close before you place any orders.
Mark your next NR7, then check the nearest level in RelicusRoad Pro before you place either order.
Written for RelicusRoad by RelicusDigital.com.
Keep going on this topic
Support and Resistance Mastery: Zones, Breaks and Retests
Master support and resistance zones with repeatable drawing rules, breakout and retest confirmation, invalidation, position sizing and common mistakes.
- Murrey Math Lines: Do the 8/8 Levels Actually Hold?
- Break of Structure vs Change of Character: Which One Ends the Trend?
- Price Channel Pattern: Trade Rising and Falling Channels
- Rising Three Methods Pattern: How to Trade the Pause
- Rounding Bottom Pattern: How to Trade a Base, Not a Bounce
- Shooting star candlestick pattern: one rejected high is not a top
- Spinning top candlestick pattern: the indecision candle
- Three white soldiers pattern: real reversal or exhausted run?
- Triangle chart pattern: trade the flat side, not the shape
- Triple Top and Triple Bottom Pattern: Trade the Third Test
- Tweezer top and bottom pattern: the level matters more than the candles
- VWAP: The Institutional Price Tag
- Wolfe Wave Pattern: Entry at Point 5, Target on Line 1-4
- Supply and Demand Zones: The Only Support & Resistance That Matters
- Candlestick patterns cheat sheet: bullish, bearish, neutral
- Bullish candlestick patterns: 9 that matter, ranked



