
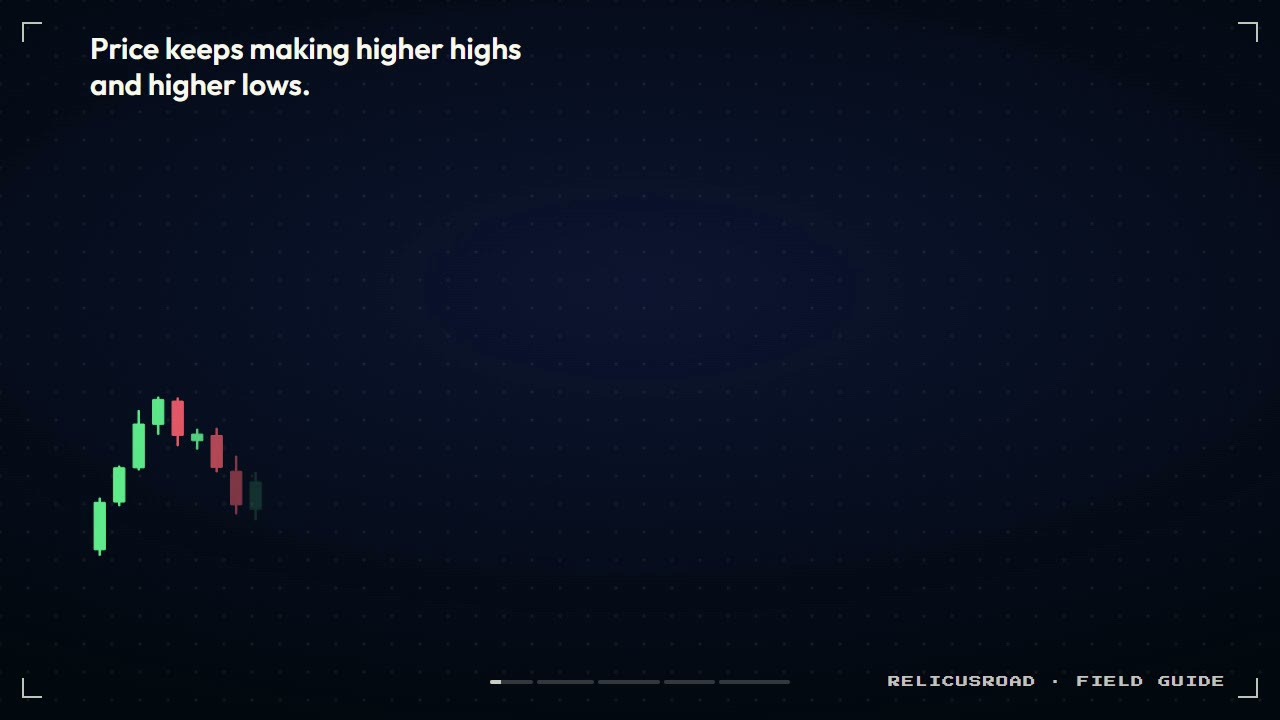
You bought the dip in a clean uptrend, and the next candle kept falling. The trend was fine. Your dip was only halfway down.
A price channel pattern fixes that. You draw the trendline under the lows, copy it up through the highs, and the trend now has a floor and a ceiling. In a rising channel you buy near the lower line, put the stop under it, and aim for the upper line. By the end you’ll know how to draw a channel that holds up, where each level goes, and what to do when price closes outside it.
Key Findings
- Two lines, one slope: a price channel is a trendline through at least two swing points plus a parallel line on the other side of price.
- Buy low in a rising channel: the entry is near the lower line, the stop sits under it, and the upper line is the first target.
- Trade with the slope: buy in rising channels, sell in falling ones, and treat flat channels as ranges.
- A close outside ends it: a candle body closing beyond the line breaks the channel, while a wick that pokes out and closes back inside does not.
What is a price channel pattern?
It is a trend with two parallel borders. A trendline joins the swing lows of a rising market (or the swing highs of a falling one). A second line, drawn at the same angle on the other side of price, marks where each swing has tended to stop. Price moves between them until a candle closes outside.
John J. Murphy calls that second line the “channel line” or “return line” in Technical Analysis of the Financial Markets (1999). He also warns that when price fails to reach the channel line in a rising trend, the trend is losing strength. We’ll come back to that.
How do you draw a channel that holds up?
Start with the trendline, not the parallel line. In an uptrend, join two swing lows where price clearly turned up. Then copy that exact slope and move it up until it touches the highest high between them. If your platform has a parallel channel tool, it does the copying for you.
- Find two higher lows with a clear rally between them.
- Draw a straight line through those two lows and extend it to the right.
- Copy the line and shift it up to the highest high in that stretch.
- Wait for price to come back to the lower line a third time. That touch is what you trade.
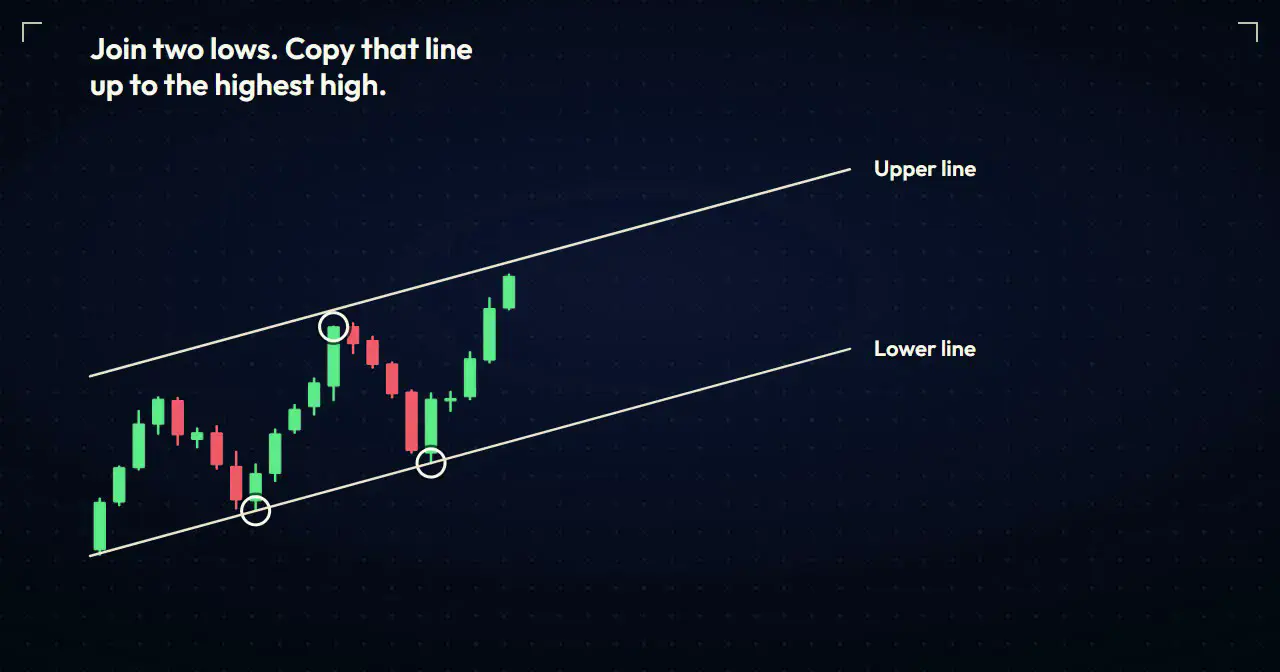
The circles mark the two lows that set the slope and the high that sets the width. Nothing else on the chart was used to place the lines.
Wicks will poke past the lines. What matters is price turning near each line more than once. The trendline trading guide covers picking the right swing points.
Where do you buy, set the stop and take profit?
In a rising channel, buy the first candle that closes up after price touches the lower line. The stop goes under that low and under the line. The first target is the upper line. In a falling channel, flip every step and sell near the upper line.
The two lines exist before the trade does, so you know your stop and target before you click buy:
- Entry: the close of the first up candle after price touches the lower line.
- Stop: a little below both the touch low and the lower line. If price closes under the line, the channel is broken anyway.
- Target: the upper line where it sits on the day you enter. It keeps rising, so some traders move the target up with it.
Size the trade from that stop distance, not from how confident the picture looks. The position sizing routine shows how to turn the stop into a lot size.
Rising, falling or flat: which way do you trade?
Trade the way the channel slopes. A rising channel is for buyers, a falling one is for sellers, and a flat one is a range you can trade both ways. Selling the top of a rising channel can work, but you are betting against the trend that built the channel.
| Channel | Main line joins | Your trade | Avoid |
|---|---|---|---|
| Ascending (rising) | Two or more higher lows | Buy near the lower line | Selling every touch of the upper line |
| Descending (falling) | Two or more lower highs | Sell near the upper line | Buying every touch of the lower line |
| Horizontal (flat) | Matching highs and matching lows | Buy low, sell high inside it | Treating it as a trend |
- Main line joins
- Two or more higher lows
- Your trade
- Buy near the lower line
- Avoid
- Selling every touch of the upper line
- Main line joins
- Two or more lower highs
- Your trade
- Sell near the upper line
- Avoid
- Buying every touch of the lower line
- Main line joins
- Matching highs and matching lows
- Your trade
- Buy low, sell high inside it
- Avoid
- Treating it as a trend
A flat channel is really a range, and it trades like the rectangle pattern: two edges, no lean, and a breakout either way.
What happens when price closes outside the channel?
Wait for the candle to close, then look at where its body ended. Back inside means the trade is still on. A close below the lower line of a rising channel means the channel is over, so you sell. A close above the upper line means the trend sped up, so take part of the profit and raise the stop.
Most mistakes happen in the middle branch: selling on the wick, then watching price close back inside and keep rising.
Remember Murphy’s warning, too. When a rising channel’s swings start stopping short of the upper line, buyers are running out of steam. That alone is not a sell, but it is a reason to tighten the stop or skip the next buy at the lower line. If you want to trade the failure itself, the failed breakout strategy covers that setup.
How is a channel different from a flag, wedge or rectangle?
All four use two lines, but they mean different things. A channel’s lines are parallel and follow the trend. A flag is a short channel tilted against the move before it. A wedge’s lines slope the same way but squeeze together. A rectangle is a flat channel.
| Price channel | Flag | Wedge | Rectangle | |
|---|---|---|---|---|
| Lines | Parallel, slope with the trend | Parallel, slope against the move | Same slope, narrowing | Flat and parallel |
| How long | Can run for weeks | Short pause | Medium | Medium |
| Main trade | Swings inside it | Breakout with the earlier move | Break against the slope | Inside, or the breakout |
| Ends when | Close outside a line | Close outside the flag | Close outside a line | Close outside the box |
- Price channel
- Parallel, slope with the trend
- Flag
- Parallel, slope against the move
- Wedge
- Same slope, narrowing
- Rectangle
- Flat and parallel
- Price channel
- Can run for weeks
- Flag
- Short pause
- Wedge
- Medium
- Rectangle
- Medium
- Price channel
- Swings inside it
- Flag
- Breakout with the earlier move
- Wedge
- Break against the slope
- Rectangle
- Inside, or the breakout
- Price channel
- Close outside a line
- Flag
- Close outside the flag
- Wedge
- Close outside a line
- Rectangle
- Close outside the box
The flag is the one people mix up most. If the “channel” is short and tilts against a sharp move, read the flag and pennant guide instead. A narrowing version belongs to the wedge pattern.
Should you let an indicator draw the channel?
Use one as a second opinion, not as the decision. Channel tools differ in one thing that matters: whether the lines you traded stay where they were. A line you draw by hand stays put until you move it. Many automatic channels refit themselves as each new candle closes.
StockCharts ChartSchool’s Andrews’ Pitchfork page shows another hand-drawn version: three parallel lines set from three pivots. On the automatic side, a sliding linear regression channel recalculates its whole history on every new bar, so judge it on live candles, not on a past chart.
Where does RelicusRoad Pro fit?
RelicusRoad Pro includes RelicusRoad Trendlines, which fits channels through confirmed swing pivots at three swing sizes and shades each line as a zone. Its pivots don’t change once confirmed. The drawn lines do get re-chosen as each bar closes, and the product page says so plainly.
Use it to check the channel you drew. If your lower line and its fitted zone agree, you have two reasons to trust the touch. The close, the stop and the size are still your call.
Frequently asked questions
What is a price channel pattern? A trend boxed in by two parallel lines. In a rising channel, the lower line joins at least two higher lows and the upper line runs parallel through the highs. Price swings between them until a candle closes outside.
Is an ascending channel bullish or bearish? Bullish while it holds, because price keeps making higher lows and higher highs. That ends once a candle closes below the lower line. A descending channel is the bearish version.
How do you trade a price channel? Trade with the slope. In a rising channel, buy the first up close after a touch of the lower line, put the stop below the line and that low, and target the upper line. In a falling channel, sell near the upper line instead.
What does it mean when price breaks out of a channel? A close below a rising channel’s lower line is the exit signal for buyers. A close above the upper line means the trend sped up, so many traders take part off and raise the stop.
How is a channel different from a flag or a wedge? A flag is a short channel tilted against the move before it. A wedge’s lines get closer together. A price channel keeps its lines parallel and can last long enough to trade the swings inside it.
Open your chart, find the last two higher lows, and draw the channel before price gets back to the lower line. To check your lines against fitted channel zones, see RelicusRoad Pro.
Written for RelicusRoad by RelicusDigital.com.
Keep going on this topic
Support and Resistance Mastery: Zones, Breaks and Retests
Master support and resistance zones with repeatable drawing rules, breakout and retest confirmation, invalidation, position sizing and common mistakes.
- Diamond Chart Pattern: How to Spot and Trade It
- Rectangle Pattern: Trade the Range or the Breakout
- Rising Three Methods Pattern: How to Trade the Pause
- Rounding Bottom Pattern: How to Trade a Base, Not a Bounce
- Shooting star candlestick pattern: one rejected high is not a top
- Spinning top candlestick pattern: the indecision candle
- Three white soldiers pattern: real reversal or exhausted run?
- Triangle chart pattern: trade the flat side, not the shape
- Triple Top and Triple Bottom Pattern: Trade the Third Test
- Tweezer top and bottom pattern: the level matters more than the candles
- VWAP: The Institutional Price Tag
- Wolfe Wave Pattern: Entry at Point 5, Target on Line 1-4
- Supply and Demand Zones: The Only Support & Resistance That Matters
- Candlestick patterns cheat sheet: bullish, bearish, neutral
- Bullish candlestick patterns: 9 that matter, ranked
- Supply and Demand Indicators: How to Read Zones Without Guessing



