You saw the trend early, but you were too late to buy the breakout. Price had already run, and buying there meant a stop far below. So you waited for a dip, bought it, and watched the dip keep going. A pullback trading strategy fixes that timing problem with three checks: is the trend still there, has the dip ended, and where is the trade wrong?
In short, you buy an uptrend only after price dips toward its average, holds above the last swing low, and closes back up. The stop goes under the pullback low. By the end you will be able to tell a healthy pullback from the start of a reversal before you risk anything.
Key Findings
- The trend comes first: a pullback strategy only buys dips in an uptrend and only sells rallies in a downtrend.
- The dip is not the signal: the entry comes after a candle closes back in the trend direction, not while price is still falling.
- The stop has a reason: it sits beyond the pullback low, the price where the uptrend stops making higher lows.
- Some dips are reversals: a break of the last swing low means no buy, however cheap price looks.
What is a pullback trading strategy?
It is a way to join a running trend at a better price. Instead of buying after a big up candle, you wait for price to dip back against the trend, then buy when the dip ends. The aim is a smaller stop for the same trend, not a lower price for its own sake.
Trends tend to move in steps, with a dip between each push. Moskowitz, Ooi and Pedersen’s 2012 Journal of Financial Economics paper, “Time series momentum”, found that past returns tended to continue across futures and currency markets over the following months. That is a reason to trade with the trend. It is not a promise that your next dip will hold.
The dip needs something to dip to. Most traders use one of these:
- a 20 EMA, a moving average that weighs recent candles more, so it stays close to price in a steady trend
- the last breakout level, an old high that price broke through earlier
- a Fibonacci retracement zone between the last swing low and swing high
This post uses the 20 EMA. The EMA vs SMA guide explains why it suits pullbacks better than a simple average.
How do you tell a pullback from a reversal?
Watch the last swing low. In an uptrend, a pullback stays above it, usually on smaller candles. A reversal breaks it, often with large candles in the new direction. Two closes in a row under the 20 EMA sit in between: the trend is in doubt, so you wait.
Only the first branch leads to an entry. The other two keep you out until price makes up its mind.
| What you see during the dip | Pullback | Reversal |
|---|---|---|
| Last swing low | Holds | Breaks |
| Candle size against the trend | Smaller than the trend candles | As large or larger |
| Closes against the 20 EMA | None, or one that recovers | Two or more in a row |
| Next move | A candle closes back up | Lower highs start to form |
- Pullback
- Holds
- Reversal
- Breaks
- Pullback
- Smaller than the trend candles
- Reversal
- As large or larger
- Pullback
- None, or one that recovers
- Reversal
- Two or more in a row
- Pullback
- A candle closes back up
- Reversal
- Lower highs start to form
None of these is proof on its own. A dip that holds the swing low on large, fast candles deserves more caution than one that drifts down quietly.
Where do the entry, stop and target go?
Enter above the high of the first candle that closes back up, put the stop under the pullback low, and aim for at least twice the risk. The entry shows buyers are back, the stop marks where the idea fails, and the target makes the risk worth taking.
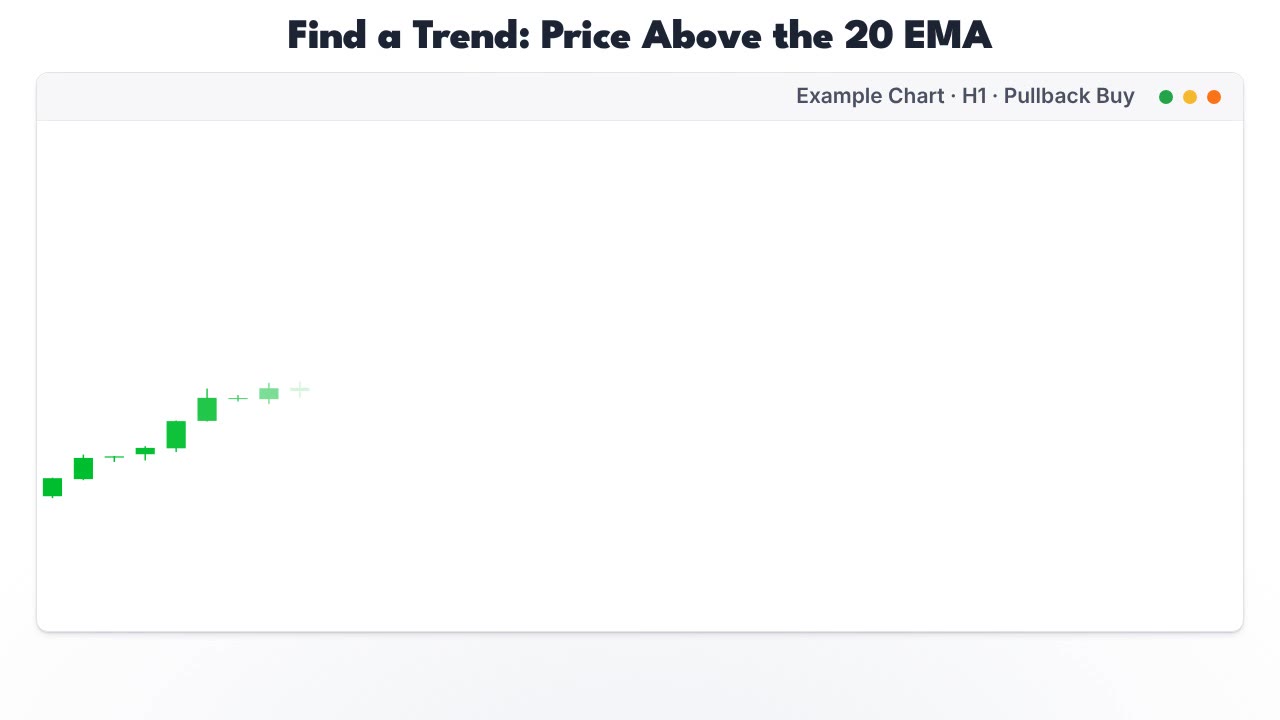
- Confirm the trend. Price has made higher highs and higher lows and closes mostly above the 20 EMA.
- Wait for the dip. Price pulls back to the 20 EMA or close to it and holds above the last swing low.
- Wait for the turn. A candle closes back up, in the trend direction. That candle is your signal candle.
- Buy above its high. A buy stop order a little above the signal candle’s high only fills if price keeps rising.
- Stop under the pullback low. Add a small buffer. In our figures the buffer is about a third of ATR, the average candle range over the last 14 candles.
- Target at least 2R. R is the distance from entry to stop. A 2R target is twice that distance above the entry.
Position size comes from that stop distance. The position sizing guide shows how to turn it into a lot size that risks the same amount every time.
Does it work in a downtrend too?
Yes, the rules flip. In a downtrend you sell a rally, not buy a dip. Price bounces up toward the 20 EMA, stays below the last swing high, and a candle closes back down. You sell below that candle’s low and put the stop above the bounce high.
In this example the sell filled at 1.0317 with the stop at 1.0393, above the bounce high. The target at 1.0165 is twice the risk below the entry and was reached four candles later. The chart is synthetic data, built to show the rules, not a record of a real trade.
Pullback, breakout or break and retest: which entry fits?
Pick the entry by what you can tolerate missing. A pullback entry gives a tighter stop but misses trends that never dip. A breakout entry catches every move but needs a wider stop. A break and retest sits between them.
| Pullback | Breakout | Break and retest | |
|---|---|---|---|
| Where you enter | After a dip inside a trend | As price clears a level | When price returns to the broken level |
| Stop distance | Small, under the pullback low | Larger, under the range | Small, under the retested level |
| Trades you miss | Strong trends that never dip | Few | Breakouts that never return |
| Main risk | The dip is the start of a reversal | The breakout fails | The retest breaks back through |
- Pullback
- After a dip inside a trend
- Breakout
- As price clears a level
- Break and retest
- When price returns to the broken level
- Pullback
- Small, under the pullback low
- Breakout
- Larger, under the range
- Break and retest
- Small, under the retested level
- Pullback
- Strong trends that never dip
- Breakout
- Few
- Break and retest
- Breakouts that never return
- Pullback
- The dip is the start of a reversal
- Breakout
- The breakout fails
- Break and retest
- The retest breaks back through
The break and retest strategy covers the third column. It waits for one broken level rather than any dip in a trend.
What makes pullback trades fail?
Most losses come from buying a dip that was never a pullback. The trend was already over, or there was no trend at all. In a sideways market price crosses the 20 EMA again and again, and every cross looks like a dip worth buying.
Other common mistakes are smaller but add up:
- moving the stop lower when price comes close to it
- buying the third or fourth pullback in a trend that is already far above its average
- trading the dip on a fast chart against the trend on the slower one
That last point is why Alexander Elder’s Triple Screen method, set out in his 1993 book Trading for a Living, reads the trend on a longer timeframe and times entries against it on a shorter one. The multi-timeframe analysis guide shows how to set that up.
Where RelicusRoad Pro fits
A pullback trade needs to know where the dip is likely to stop and where the trade is wrong. RelicusRoad Pro draws support and resistance levels once a candle closes and leaves them where they were drawn. When a dip reaches one of those levels and a candle closes back up, you have a place to buy and a place for the stop.
It does not decide whether the trend is real. That check, and the stop, stay with you.
Frequently asked questions
What is a pullback trading strategy?
It is a way to join a trend that is already running by waiting for price to dip back against it, then entering when the dip ends. In an uptrend you buy after price pulls back toward a moving average or an old level and a candle closes back up. The stop goes under the pullback low.
How do I know if it is a pullback or a reversal?
Check the last swing low in an uptrend. A pullback stays above it, usually on smaller, quieter candles. A reversal breaks it, often with large candles in the new direction. Two closes in a row under the 20 EMA are a warning sign: wait until price shows which one it is.
Which moving average is best for pullbacks?
Many traders use a 20 EMA on the chart they trade, because it stays close to price in a steady trend. A 50-period average suits slower, deeper pullbacks. No setting is best everywhere, so pick one, test it on your own market and timeframe, and keep it long enough to judge.
Where should I put the stop on a pullback trade?
Beyond the pullback low for a buy, or the pullback high for a sell, with a small buffer for normal noise. That is the price where the higher low (or lower high) fails and the trend you were trading is in question. Size the position so that distance risks the amount you planned.
Is buying the dip the same as a pullback strategy?
Not quite. Buying the dip often means buying any drop. A pullback strategy only buys dips inside a clear uptrend, only after a candle closes back up, and always with a stop under the pullback low. The rules decide when the dip is worth buying and when it is not.
Find the trend, wait for the close back up, then check whether the dip stopped on a level in RelicusRoad Pro.
Written for RelicusRoad by RelicusDigital.com.
Keep going on this topic
Support and Resistance Mastery: Zones, Breaks and Retests
Master support and resistance zones with repeatable drawing rules, breakout and retest confirmation, invalidation, position sizing and common mistakes.
- Trendline Trading Strategy: Draw It Right, Then Trade It
- Break and Retest Strategy: Wait for the Level to Flip
- Mind the Gap: Trading Weekly Opens and Fair Value Gaps
- Dynamic Reversals: How to Catch the Turn Without Getting Wrecked
- Fractal Arrows Strategy: The 'Chaos Theory' of Market Turns
- Volume Profile Explained: Finding Value in the Noise
- Stop Trading Patterns: Why Order Flow Rules the Market
- The Russian Doll: Mastering Multi-Timeframe Analysis
- Multi-TF Trend Bar: Seeing the 'Matrix' of Market Trends
- Institutional Forex Indicators: How Smart-Money Tools Differ From Retail Ones
- Fair Value Gap Indicator: How to Spot and Trade FVGs Without Guesswork
- Renko Charts: Filtering the Noise for Pure Price Action
- Heikin Ashi: The Trend Smoother
- Head and Shoulders Pattern: How to Trade the Reversal Without Chasing Ghosts
- Double Top and Double Bottom Pattern: Trading the Reversal Without Guessing the Turn
- Cup and Handle Pattern: How to Trade the Breakout