You bought the break above the range, and three candles later price was back in the middle of it. The range was real. Your entry wasn’t.
A rectangle pattern is a flat box on the chart: price hits the same top at least twice and the same bottom at least twice, then eventually closes outside. You can trade it two ways. Buy low and sell high inside the box, or wait for a candle to close outside it and trade the break. By the end you’ll know which one fits the box in front of you, and where each trade’s stop belongs.
Key Findings
- Two tops, two bottoms: a rectangle is drawn only after price has tested both the ceiling and the floor twice at roughly the same levels.
- No built-in direction: the box is neutral until a candle closes outside it, which is how StockCharts ChartSchool treats the pattern too.
- Box height sets the target: add the height of the box to the top for an upside break, the classic measured move.
- A close back inside ends it: once price closes back in the box after a break, the breakout has failed.
What is a rectangle pattern?
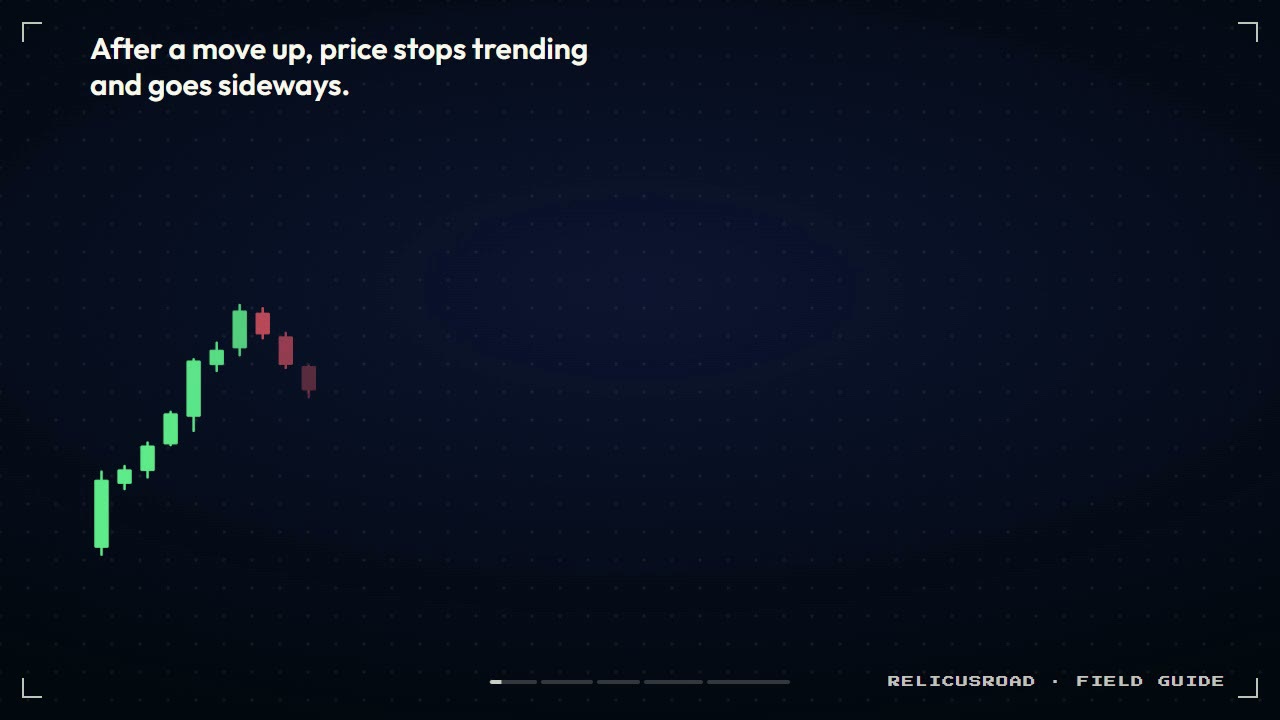
It is a pause between two flat lines. After a move, buyers and sellers reach a truce: sellers step in at the same price each time it rises, buyers step in at the same price each time it falls. Price bounces between those two levels until one side gives up, and the first close outside the box shows who won.
The pattern is old. Robert Edwards and John Magee described rectangles as trading-range formations in Technical Analysis of Stock Trends (1948), and Thomas Bulkowski later catalogued rectangle tops and bottoms in Encyclopedia of Chart Patterns (2nd edition, 2005). StockCharts ChartSchool’s rectangle page sums up the modern view: the pattern is neutral, the break should count only on a close, and the target comes from the height of the box.
How do you spot a real rectangle?
Look for two tops at about the same price and two bottoms at about the same price, with price turning at each one. Two touches on one side and one on the other is not a rectangle yet. It’s a range that hasn’t proved itself. Three tops at one price after a long rise can also be read as a three-test reversal called a triple top, but only once price closes below the lows between them.
- Find the move that came before. A rectangle is a pause in something.
- Mark the highs where price turned down. You need at least two, close together in price.
- Mark the lows where price turned up. Again, at least two.
- Draw a horizontal line through the tops and another through the bottoms. That’s your box.
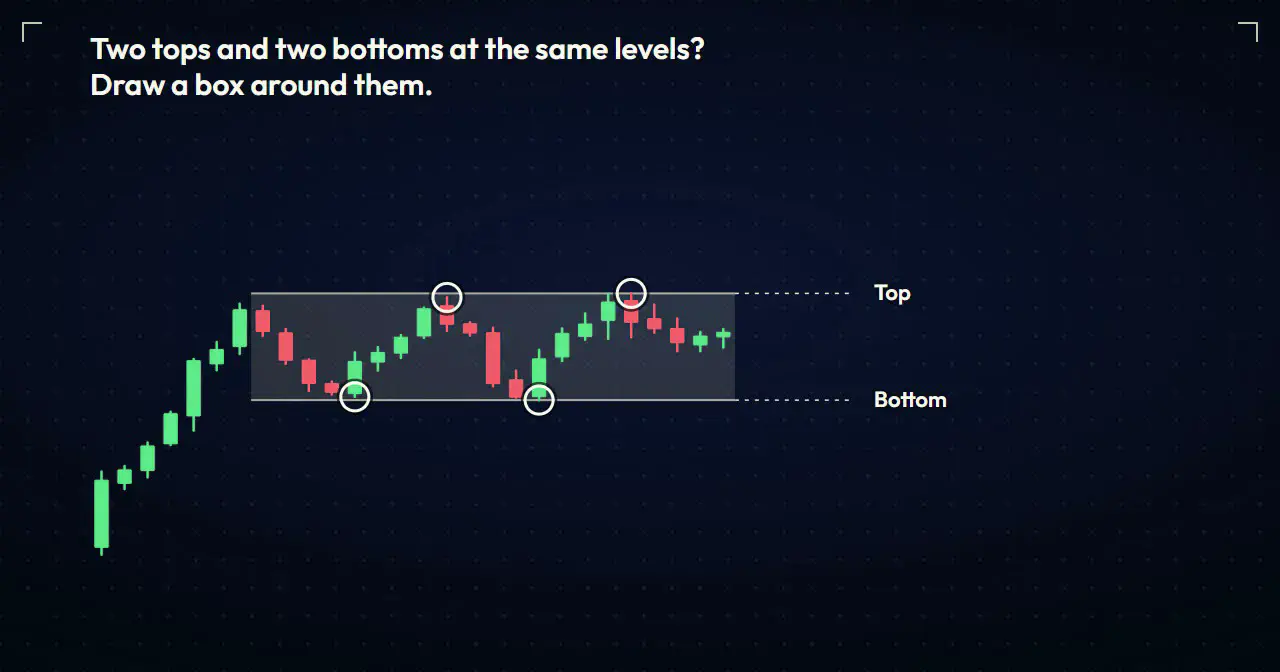
Don’t expect the touches to be exact. Wicks will poke a little past the lines. What you want is price turning near the same level more than once, not a perfect ruler line.
People often confuse it with a Darvas box, which also looks like a rectangle. The Darvas box only forms after a fresh high and is traded upward. A rectangle can form after a fall too, and can break either way.
Should you trade inside the box or wait for the breakout?
It depends on how tall the box is. Inside the box, you buy near the bottom and sell near the top, so the trade only pays if the height of the box is several times your stop distance. In a narrow box that math fails, and waiting for the break is the better choice.
Read the two columns side by side. The inside trade has a tight stop under the bottom, but its target is capped by the top of the box. The breakout trade gives up that tight stop in exchange for room to run.
In my view, most traders do better picking one plan per box before price gets near either edge. Deciding halfway through a candle is how people end up buying the top of the range.
How do you trade the rectangle breakout?
Wait for a candle to close above the top, then buy that close. Put the stop in the middle of the box and set the target one box height above the top. For a break below the bottom, flip every step and sell.
Watch the order in that clip. The box comes first, then the close, and only then the trade levels. Here’s the plan written out:
- Entry: the close of the first candle that ends above the top of the box.
- Stop: the middle of the box. If price gets back there, the break has failed.
- Target: the height of the box, added to the top. ChartSchool calls this the measured move.
Why the middle and not below the bottom? A stop under the bottom survives more noise, but it roughly doubles your risk and halves your position. If you want it anyway, fine: size down using the position sizing routine and check the risk reward ratio against the measured target before you click.
What happens when the breakout fails?
A close back inside the box means the break failed, and you should be out. A wick that dips in and recovers is normal. A full candle body closing below the top, followed by more selling toward the middle, is the market telling you the buyers didn’t have enough.
The edges of a rectangle are obvious lines that many traders watch, so a break through them can fail and reverse hard. That move back through the box can be sharp, and some traders trade that reversal on purpose; the failed breakout strategy covers that setup. For the breakout buyer, the rule is simpler: respect the stop, and don’t buy the same box a second time on the next poke above the top unless it closes there again.
How does a rectangle compare with a triangle or a flag?
All three are pauses, but they say different things. A rectangle has flat edges and no lean. A triangle squeezes into a point. A flag slopes against the move before it and usually lasts only a short time.
| Rectangle | Triangle | Flag | |
|---|---|---|---|
| Shape | Flat top, flat bottom | Lines that meet at a point | Short channel sloping against the trend |
| Direction before the break | None | Depends on the type | Leans toward the earlier trend |
| Entry | Close outside the box | Close outside the lines | Close outside the channel |
| Target idea | Box height past the break | Widest part of the triangle | Length of the move before the flag |
| Can you trade inside it? | Yes, if the box is tall | Rarely, it keeps narrowing | No, it is too short |
- Rectangle
- Flat top, flat bottom
- Triangle
- Lines that meet at a point
- Flag
- Short channel sloping against the trend
- Rectangle
- None
- Triangle
- Depends on the type
- Flag
- Leans toward the earlier trend
- Rectangle
- Close outside the box
- Triangle
- Close outside the lines
- Flag
- Close outside the channel
- Rectangle
- Box height past the break
- Triangle
- Widest part of the triangle
- Flag
- Length of the move before the flag
- Rectangle
- Yes, if the box is tall
- Triangle
- Rarely, it keeps narrowing
- Flag
- No, it is too short
The flat edges are what make the rectangle useful: you can trade inside it, which you can’t really do with the others. The triangle chart pattern guide covers the squeezing version and its targets.
Where does RelicusRoad Pro fit?
The hardest part of a rectangle is being honest about the top and bottom. RelicusRoad Pro includes the Support Resistance tool, which builds zones from swing points and grades each one Verified, Weak or Untested from its recent tests. That gives you a second opinion on whether your box edges have really been tested twice, before you draw anything by hand.
It won’t pick the direction for you. The close outside the box still decides, and the stop still goes where the idea is wrong.
Frequently asked questions
What is a rectangle pattern in trading? Sideways price boxed in by a flat top and a flat bottom. Price reaches the same ceiling at least twice and the same floor at least twice, until one side wins and price closes outside the box.
Is a rectangle pattern bullish or bearish? Neither on its own. After a rise it often breaks up and after a fall it often breaks down, but that is only a tendency. StockCharts ChartSchool treats it as neutral until a close outside the box.
How do you set a target for a rectangle breakout? Measure the box from bottom to top and add that height to the top for an upside break, or subtract it from the bottom for a downside break. It’s a first target, not a promise.
Where should the stop go on a rectangle breakout? This post uses the middle of the box. A stop below the bottom handles more noise but makes the risk about twice as large, so trade a smaller size.
How is a rectangle different from a Darvas box? A Darvas box forms only after a new high and is traded upward. A rectangle can form after a rise or a fall, can break either way, and needs two tests of both edges.
Find the last sideways stretch on your chart, count the touches on each edge, and decide now whether you’d trade inside it or wait for the close outside. To check your box edges against graded zones, see RelicusRoad Pro.
Written for RelicusRoad by RelicusDigital.com.
Keep going on this topic
Support and Resistance Mastery: Zones, Breaks and Retests
Master support and resistance zones with repeatable drawing rules, breakout and retest confirmation, invalidation, position sizing and common mistakes.
- Diamond Chart Pattern: How to Spot and Trade It
- Price Channel Pattern: Trade Rising and Falling Channels
- Hammer candlestick pattern: how to trade the reversal signal
- Doji candlestick pattern: what the indecision candle really tells you
- Morning star candlestick pattern: how to read the three-candle bottom
- Market profile trading: how to read value areas and point of control
- Break of Structure vs Change of Character: Which One Ends the Trend?
- Broadening formation: why breakouts keep failing inside a megaphone
- Bump and Run Reversal Pattern: How to Trade It
- Dark cloud cover pattern: the depth test most traders skip
- Hanging man candlestick pattern: how to trade the warning
- Harami candlestick pattern: most of them are not worth trading
- Island Reversal Pattern: How to Trade the Gap Trap
- Kicker Candlestick Pattern: How to Trade the Gap Reversal
- Marubozu candlestick: when a no-wick candle means it
- NR7 Trading Strategy: Trade the Quietest Candle in 7