Best RSI Settings for Scalping: 2, 9, 14 or 21?
The best RSI settings for scalping are not a secret number. A shorter period such as RSI 2 or 5 reacts quickly but creates more noise, while RSI 14 or 21 moves more slowly and filters more small price changes. Your timeframe, market condition and confirmation rule determine which trade-off is useful.
This guide compares RSI 2, 9, 14 and 21 without treating any setting as a guaranteed signal. You will learn what changes when the period changes, how to match it to a trading style and how to test it safely.
The Relative Strength Index (RSI) is a technical-analysis oscillator scaled from 0 to 100. It compares the magnitude of recent gains with the magnitude of recent losses over the selected period. That makes the period a sensitivity control, not a forecast of where price must go next.
What does changing the RSI period actually do?
J. Welles Wilder introduced RSI in his 1978 book New Concepts in Technical Trading Systems, recommended a 14-period setting and marked 70 and 30 as the overbought and oversold lines (Wikipedia summary). Every other period is a change from that default.
The RSI period controls how many recent price changes contribute to the calculation. A shorter period gives recent candles more influence, so the oscillator reaches extreme levels and crosses its midpoint more often. A longer period smooths those changes, reducing signal frequency but also reacting later. Some tools take that smoothing a step further and wrap the result in a trailing band, which is the whole premise behind the QQE indicator.
That creates a simple trade-off:
| RSI period | Responsiveness | Signal frequency | Typical use to test | Main risk |
|---|---|---|---|---|
| 2-5 | Very fast | Very high | Short mean-reversion experiments | Noise and repeated false turns |
| 9 | Fast | High | M5-M15 momentum or pullback setups | Overreacting during volatility |
| 14 | Balanced baseline | Medium | General comparison and rule development | Treating 70/30 as automatic reversal levels |
| 21 | Smooth | Lower | H1-H4 trend and swing filtering | Late confirmation and wider price movement |
- Responsiveness
- Very fast
- Signal frequency
- Very high
- Typical use to test
- Short mean-reversion experiments
- Main risk
- Noise and repeated false turns
- Responsiveness
- Fast
- Signal frequency
- High
- Typical use to test
- M5-M15 momentum or pullback setups
- Main risk
- Overreacting during volatility
- Responsiveness
- Balanced baseline
- Signal frequency
- Medium
- Typical use to test
- General comparison and rule development
- Main risk
- Treating 70/30 as automatic reversal levels
- Responsiveness
- Smooth
- Signal frequency
- Lower
- Typical use to test
- H1-H4 trend and swing filtering
- Main risk
- Late confirmation and wider price movement
These are starting points for testing, not performance rankings. RSI settings cannot repair an entry rule that ignores trend, volatility or risk.
What does the RSI calculation measure?
RSI first separates positive and negative price changes, averages them across the chosen lookback, then converts their relationship to the 0-to-100 scale. A shorter lookback lets the newest changes dominate. A longer lookback distributes their effect across more candles. If you want speed without shortening the lookback at all, the Laguerre RSI indicator swaps the window for a four-stage filter and a single gamma setting.
This explains why average gain and average loss values can change sharply on RSI 2 while the same move produces a smaller change on RSI 21. The calculation does not measure order flow, news or market value. It summarizes recent price behavior, so every RSI signal still needs a price-based reason and invalidation point.
What are the best RSI settings for scalping?
For scalping, RSI 5 or 9 is often a more practical starting test than jumping directly to RSI 2. The faster setting can identify momentum shifts earlier, but it also produces many more RSI crossings. On a one-minute chart, spread, slippage and one delayed candle can matter more than the indicator period.
Use this testing sequence:
- Start with RSI 9 and the standard 70/30 levels as a baseline.
- Test RSI 5 with the same price-action trigger, stop and target.
- Test RSI 2 only if the strategy is explicitly designed for fast mean reversion, and compare it against a purpose-built mean-reversion oscillator like Connors RSI before you settle on a period.
- Compare net results after spreads, commissions and realistic slippage.
- Reject any version that depends on perfect fills or one unusually favorable session.
The phrase rsi scalping settings often implies that the setting itself is the strategy. It is not. The period only changes sensitivity; entry location, market regime, execution and position size still determine the trade.
RSI settings by time frame: a starting-point table
Treat every row below as a first test, not a recommendation. The point of a baseline is to give you something to compare against.
| Chart | Period to start with | Levels to start with | What you are trying to see | Main failure mode |
|---|---|---|---|---|
| M1 | 5 (2 only for deliberate mean reversion) | 90/10 or 85/15 | Momentum exhaustion inside a defined zone | Spread and slippage exceed the move |
| M5 | 9 | 70/30 | Pullbacks inside the session trend | Trading every crossing in a trend |
| M15 | 9 or 14 | 70/30 | Sustained intraday momentum | Treating 70/30 as a reversal order |
| H1-H4 | 14 | 70/30 | Swing timing and divergence | Late exits from a slow period |
| Daily | 14, compared against 21 | 70/30 | Trend filtering and divergence | Wide stops, slow feedback |
- Period to start with
- 5 (2 only for deliberate mean reversion)
- Levels to start with
- 90/10 or 85/15
- What you are trying to see
- Momentum exhaustion inside a defined zone
- Main failure mode
- Spread and slippage exceed the move
- Period to start with
- 9
- Levels to start with
- 70/30
- What you are trying to see
- Pullbacks inside the session trend
- Main failure mode
- Trading every crossing in a trend
- Period to start with
- 9 or 14
- Levels to start with
- 70/30
- What you are trying to see
- Sustained intraday momentum
- Main failure mode
- Treating 70/30 as a reversal order
- Period to start with
- 14
- Levels to start with
- 70/30
- What you are trying to see
- Swing timing and divergence
- Main failure mode
- Late exits from a slow period
- Period to start with
- 14, compared against 21
- Levels to start with
- 70/30
- What you are trying to see
- Trend filtering and divergence
- Main failure mode
- Wide stops, slow feedback
These are conventional defaults, not backtested results. They are here to give you a defensible place to start, and the “main failure mode” column is the part worth taking seriously. Two rules make the table usable: change one variable at a time, and keep the entry trigger, stop, target and cost assumptions identical between tests.
RSI settings for a one-minute chart
M1 charts contain more short-lived movement and execution noise. If you test RSI 2-5, require a second condition such as a higher-timeframe direction, a predefined support or resistance area, or a price rejection pattern. Trading every oversold condition in a downtrend can create a chain of losses.
Because a short period reaches 70 and 30 constantly on M1, some scalpers widen the thresholds to 85/15 or 90/10 instead of shortening the period further. The wider band does not improve the signal; it simply raises the bar for what counts as overextended, which reduces the number of alerts you have to filter by hand.
The M1 scalping guide covers the operational risks that an oscillator cannot solve: spread expansion, latency, rapid decision pressure and overtrading.
If you would rather read the momentum condition off the chart than off a separate oscillator pane, the scalping arrows feature documents how RelicusRoad Pro marks the same M1 exhaustion points on price itself, including what it does and does not signal.
RSI settings for a 5-minute chart
RSI 9 with the standard 70/30 levels is the usual baseline on M5. It reacts sooner than RSI 14 while still smoothing more than a 2-5 period, which suits pullback entries inside a session trend rather than counter-trend reversals.
Keep the thresholds at 70/30 for the first comparison. If you move the period and the levels together, you cannot tell which change produced the result.
RSI settings for a 15-minute chart
On M15, compare RSI 9 against RSI 14 directly. RSI 9 gives earlier notice of a momentum shift; RSI 14 gives the move more time to develop and produces fewer signals per session. Neither is better in isolation, and the honest answer for most rule sets is that the difference is smaller than the difference made by where you place the entry.
M15 is also where the 50 midline becomes more useful than the outer bands. If RSI pulls back but holds above 50 through a session, buyers are still in control; if it repeatedly fails to clear 50, sellers are. Using the midline as a directional filter is easier to test than a vague instruction to trade with momentum, and it is the same logic the scalping arrows feature applies when it decides whether an intraday pullback still counts as with-trend.
RSI 9 vs 14: which should you use?
RSI 9 uses nine periods of price change and RSI 14 uses fourteen, so RSI 9 crosses its midpoint more often and reaches extremes sooner. That is the whole difference. It is a sensitivity setting, not a quality setting.
| RSI 9 | RSI 14 | |
|---|---|---|
| Reacts | Sooner | Later |
| Signals per session | More | Fewer |
| False turns | More | Fewer |
| Suits | M5-M15 pullback timing | M15 and above, divergence, filtering |
| Cost of being wrong | Repeated small losses from noise | Missing the first part of a move |
- RSI 9
- Sooner
- RSI 14
- Later
- RSI 9
- More
- RSI 14
- Fewer
- RSI 9
- More
- RSI 14
- Fewer
- RSI 9
- M5-M15 pullback timing
- RSI 14
- M15 and above, divergence, filtering
- RSI 9
- Repeated small losses from noise
- RSI 14
- Missing the first part of a move
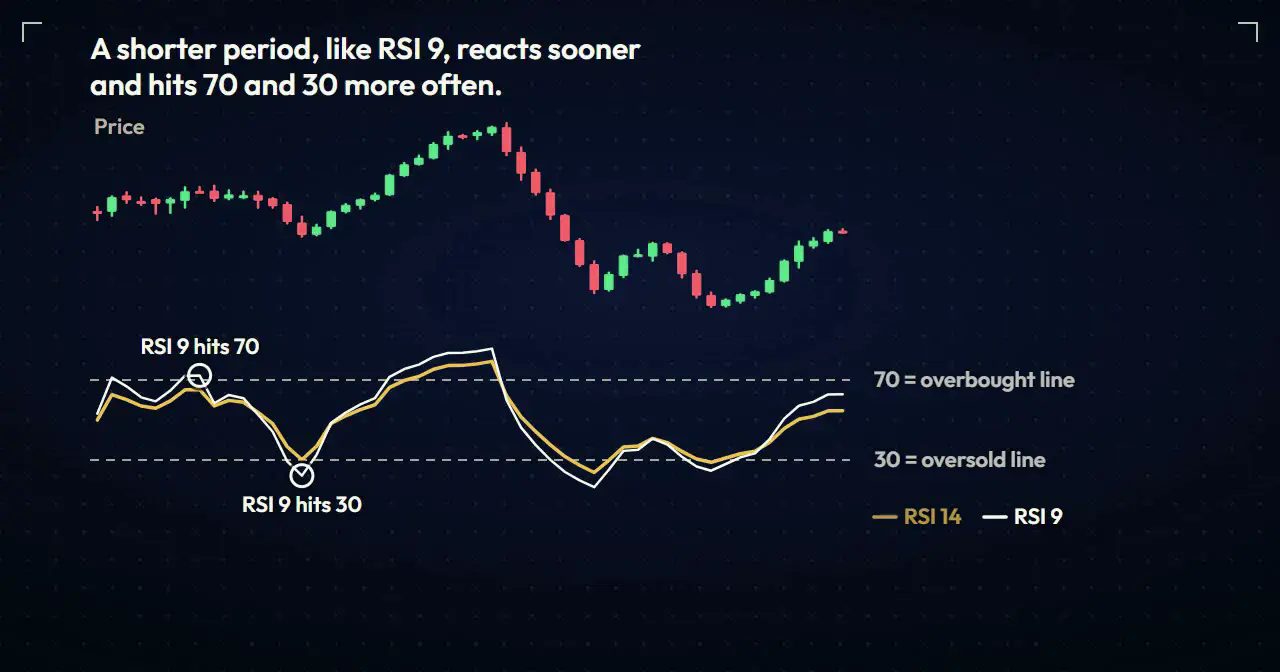
Choose RSI 9 if your rule set already filters entries by structure or trend and you need earlier notice. Choose RSI 14 if the oscillator is doing the filtering itself. Test both on the same market, session and cost assumptions before deciding, and reject the one that only wins on a single favourable stretch.
Why the same period behaves differently on each chart
RSI 9 on M5 is not equivalent to RSI 9 on H1. Both use nine candles, but the candles cover different durations, sessions and execution conditions, so the same number produces a different signal rate on each chart. Match the test to your actual holding period rather than copying a number from someone else’s timeframe.
Market conditions matter as much as the time frame. A fast setting may create useful alerts in an orderly range and repeated false signals during a news-driven trend. A slower setting may filter some noise but react after much of a short move has already occurred.
RSI 14 vs 21: which is better for swing trading?
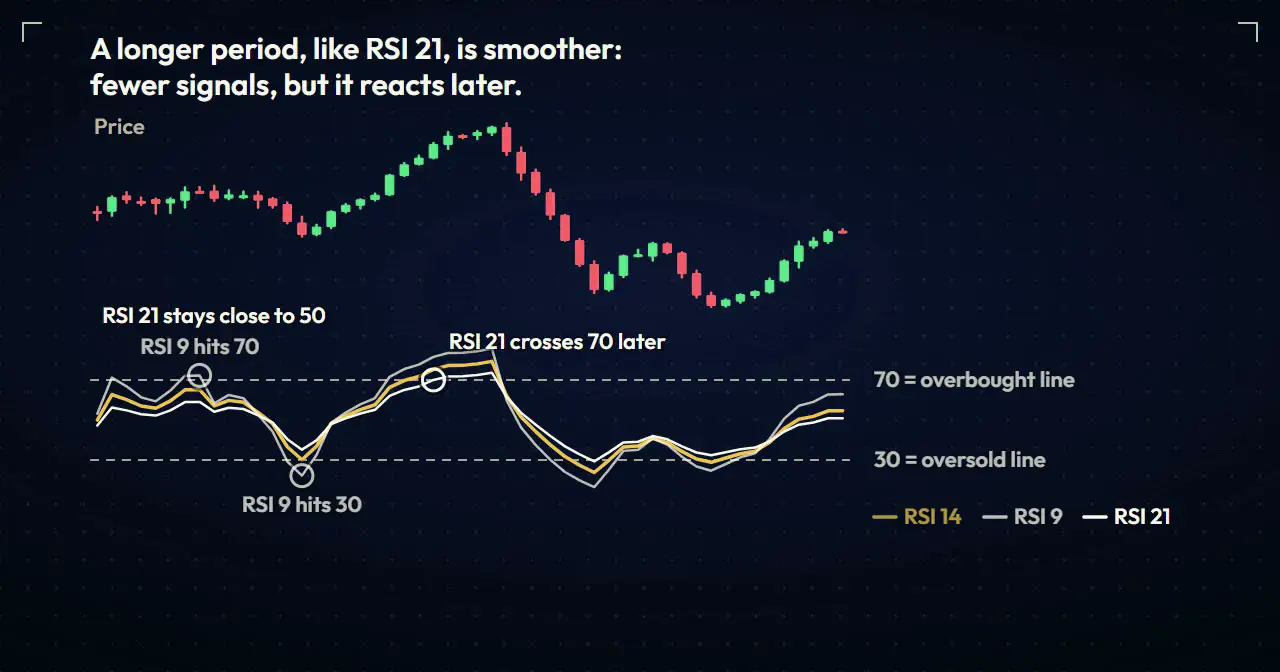
In an RSI 14 vs 21 comparison, RSI 14 responds sooner and RSI 21 is smoother. RSI 21 may help a swing trader ignore smaller countertrend moves, but the slower response can also delay an exit. The correct choice depends on whether the oscillator is used for timing, filtering or divergence.
What are the best RSI settings for a daily chart?
For a daily chart, RSI 14 is the clearest baseline and RSI 21 is a useful smoother comparison. RSI 14 reacts to about three trading weeks of candles, while RSI 21 uses a longer lookback and changes more slowly. Neither is automatically best; compare both with the same price trigger, stop and costs.
Daily candles reduce some intraday noise but can create wider stops and slower feedback. Decide whether RSI is a trend filter, pullback condition or divergence alert before testing the period. Reject a setting if its delayed signal leaves too little room between entry and the price-based invalidation or target.
For an H1 or H4 pullback test:
- Use the higher timeframe to define trend and major structure.
- Compare RSI 14 and 21 using the same entry trigger.
- Record how often each setting creates an early signal or a late signal.
- Keep position risk identical even when stop distances differ.
- Review maximum adverse movement, not only winning percentage.
If RSI is only a filter, a simple rule such as “consider long setups only while RSI is above 50” is easier to test than a vague instruction to buy when momentum looks strong. The multi-timeframe analysis guide explains how to keep the context timeframe separate from the entry timeframe.
How should overbought and oversold levels be used?
RSI above 70 means recent upward changes have been strong relative to recent downward changes; below 30 means the opposite. Neither condition guarantees that price must reverse. Strong trends can keep RSI in an extreme area for longer than a trader expects.
Use levels as context, then wait for a testable trigger. Examples include:
- RSI exits an extreme area after price rejects a predefined zone.
- A pullback holds market structure while RSI recovers through 50.
- Price makes a new extreme while RSI does not, creating potential divergence.
- A moving average or higher-timeframe trend filters trades in the opposite direction.
Do not combine every filter at once. More conditions can reduce trade count without improving decision quality.
The same caution applies to RSI crossings. A move above 30 after an oversold condition may be tested as a recovery trigger, while a move below 70 may be tested after an overbought condition. Neither crossing is a reliable signal without market structure, costs and a defined failure point.
Should you shift RSI levels in a trend?
Some traders test shifted ranges, such as 80/40 during an uptrend or 60/20 during a downtrend. The purpose is to stop treating ordinary trend momentum as an immediate reversal. These levels are heuristics, not universal market laws.
First test 70/30. Then compare a shifted range on the same data with the same trading rules. If the shifted levels only look better after many adjustments, the result may be overfit.
How can RSI divergence improve the setup?
RSI divergence occurs when price and the oscillator form different relative highs or lows. It can show that momentum is changing, but it does not identify the exact reversal candle and can persist while price continues in the original direction.
A safer workflow is:
- Mark the divergence without entering.
- Identify the price level that would confirm a structure change.
- Wait for price to break or reject that level according to the tested rule.
- Place invalidation beyond the structure that disproves the idea.
- Size the position from the stop distance.
See the RSI divergence strategy for bullish and bearish examples, confirmation rules and common failure modes.
Bullish divergence describes price making a lower low while RSI makes a higher low. Bearish divergence describes price making a higher high while RSI makes a lower high. These patterns identify a momentum disagreement, not an automatic buy signal or sell signal. Wait for confirmation from price before acting.
Should RSI be combined with moving averages or price action?
Combining RSI with a moving average can separate direction from timing. For example, the moving average may define whether the market is being treated as rising or falling, while RSI identifies a pullback. Price action then supplies the actual trigger and invalidation.
If you combine RSI with moving averages, compare the combined version against the RSI-only rule. Extra filters can make historical results look smoother simply by removing trades. The test should show whether the filter improves trading decisions across a later sample, including a different volatility regime. Some tools package this combination for you: the Traders Dynamic Index bundles RSI with its own moving-average baseline and volatility bands, which is convenient but still runs on the same RSI engine you are tuning here.
Keep each tool’s job distinct:
- Trend filter: A moving average or higher-timeframe market structure.
- Momentum context: RSI level, midpoint or divergence.
- Entry trigger: A specific price-action event that can be replayed.
- Risk control: A stop based on invalidation and a predefined position size.
This is better than asking two indicators to vote on the same information. The MACD vs RSI comparison explains how their calculations differ and when combining them adds redundant signals.
How should stops and risk be handled?
RSI is not a stop-placement tool. A stop belongs where the price-based trade idea is invalid, not at the candle where RSI reaches a particular number. When volatility increases, a mechanically tight stop can be hit even if the broader setup remains intact.
Use ATR as a volatility reference, then calculate position size from the chosen stop distance. A wider stop should normally mean a smaller position if the account risk is kept constant.
Avoid adding to a losing position simply because RSI has become “more oversold.” The indicator is describing stronger recent downside momentum, not guaranteeing a bounce.
How do you test an RSI setting without overfitting?
Write the complete rule before looking at results. Record the instrument, session, timeframe, RSI period, levels, price trigger, stop, exit and trading costs. Test one version on development data, then check it on a later period that was not used to tune the rules.
Track more than win rate:
- Average win and average loss.
- Largest losing sequence and drawdown.
- Net result after all costs.
- Frequency of skipped or impulsive trades.
- Performance in trends, ranges and high volatility.
A setting that produces fewer trades with clearer execution may be more usable even if another version has a slightly higher historical return. The objective is a process you can repeat, not a perfect-looking backtest.
Common RSI mistakes
The most common mistake is buying solely because RSI is below 30 or selling solely because it is above 70. Other mistakes include changing settings after every loss, using a fast period on an illiquid market, ignoring transaction costs and testing multiple variations until one happens to look exceptional.
Also avoid absolute claims about a “best” period. Market volatility, session behavior and execution conditions change. Revalidate the rule periodically and stop using it when its assumptions no longer match the market.
Key takeaways
- RSI 2-5 is very responsive but vulnerable to noise.
- RSI 9 is a useful scalping and intraday comparison setting.
- RSI 14 is a baseline; RSI 21 provides more smoothing for slower setups.
- Overbought and oversold readings are context, not automatic entries.
- Test price confirmation, costs and risk controls together with the setting.
Trading leveraged products can produce losses quickly. This article is educational and is not financial advice.
Next step: Use the RSI divergence guide to add a price-confirmation rule before testing any setting with real capital.
Keep going on this topic
The Best Trading Indicators for MT4, MT5 and TradingView in 2026
An honest breakdown of trading indicators for MT4, MT5 and TradingView: which categories add real edge, which are noise, and how many you actually need.
- MACD vs RSI: Differences, Signals and When to Use Each
- Parabolic SAR: The Idiot-Proof Trailing Stop
- Stochastic Oscillator for Forex: A Range Map You Can Trust
- The Stochastic RSI Indicator: Speed Without the Whipsaw
- The Bollinger Squeeze: Catching the Explosion
- Moving Average Crossover Strategy: Rules and Whipsaw Filters
- The Ichimoku Cloud: The 5-Second Scan Strategy
- Currency Strength Meter: How to Read It Without Chasing False Signals
- Signal Lines Strategy: The 'Heartbeat' of Market Momentum
- Signal Cloud Strategy: Visualizing the 'Mood' of the Market
- Super Trend Indicator Guide: The 'Traffic Light' for Market Trends
- The Supertrend Indicator: Trading Trend Flips Without Chasing the Repaint
- Tick Volume vs Real Volume: What Your Forex Chart Actually Counts
- Cumulative volume delta: what it shows and what it can't
- Accelerator Oscillator Explained: Reading Momentum Before Price Turns
- Accumulation Distribution Indicator: How to Read Volume Conviction
Related reading: Scalping Arrows.