You mark a level where price reversed hard last week, wait for it to come back, and it does. Price taps your line, hesitates, then carries straight through while you sit there second-guessing whether you drew it a few pips too high.
The problem usually is not your eyes. It is that a single line is the wrong shape for what you are trying to capture. The market does not turn at a price; it turns inside an area where orders were left unfilled. A supply and demand indicator draws that area for you. By the end of this guide you will know what these tools actually mark, how to tell an honest zone from a hindsight one, and the one check to run before you trust any of them.
Key Findings
- Zones mark origins, not reactions: A supply or demand box sits where a strong move began, the base it left from, because that is where unfilled orders are most likely waiting.
- Auto-drawing removes bias, not judgment: An indicator flags zones consistently and fast, but you still decide which ones matter and how price confirms them.
- A real zone never moves: Once a box is printed on a closed candle, an honest tool fixes it there permanently; a box that slides or disappears later is rewriting history.
- Context beats triggers: A zone tells you where to look; your entry and stop rules still do the work of getting in and managing risk.
What does a supply and demand indicator actually mark?
A supply and demand indicator looks for one specific shape in price: a tight base, then a sharp move away from it. That base is the origin. The tool draws a rectangle around it and leaves it on the chart as a reference for later.
The logic comes from how large orders fill. When a big participant cannot complete an order at one price, the unfilled remainder sits and waits. Price often pushes away from that area fast, and the imbalance is what creates the move. When price drifts back to the same area later, the leftover orders can still be there, which is why zones so often produce a reaction the second or third time around.
Two kinds of box show up:
- A demand zone sits below price, at the base of a strong up-move. It is where buying overwhelmed selling.
- A supply zone sits above price, at the base of a strong down-move. It is where selling overwhelmed buying.
Note what the tool is not doing. It is not predicting that price will reverse. It is marking where the order-flow imbalance last happened, so you can watch how price behaves when it returns. That distinction is the whole game.
Why a zone beats a single line
A horizontal line says price turned at exactly this number. It rarely did. Price turned somewhere inside a band, and the next reaction will land somewhere inside that band too, not on a pixel-perfect level.
Drawing the area instead of the line does two useful things. It gives your stop a logical place to sit: just beyond the far edge of the zone, where the original imbalance would be proven wrong. And it stops you from rejecting a valid setup because price missed your line by three pips. The band absorbs the noise that a line pretends does not exist.
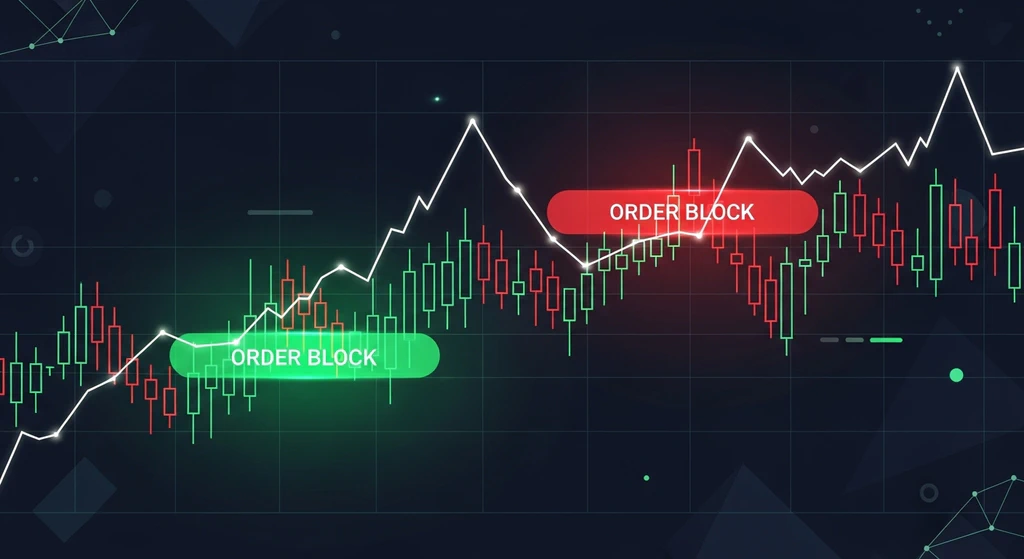
The schematic below shows the shape these tools hunt for: a base, a strong departure, and a later retest into the same area.
How do auto-drawn zones compare to drawing them yourself?
Both get you to a marked zone. They differ in speed, consistency, and how much they let your hopes creep in.
| Aspect | Hand-drawn zones | Indicator-drawn zones |
|---|---|---|
| Speed | Slow, chart by chart | Instant across every pair and timeframe |
| Consistency | Varies with mood and bias | Same rule every time |
| Bias | You see the zones you want | Neutral to your wishes |
| Learning value | High, you study each move | Lower if you stop thinking |
| Risk | Missed setups, sloppy edges | Bad rule or repainting hides the flaw |
A hand-drawn zone teaches you why a base mattered, and that knowledge is worth keeping. But it is slow, and on a tired evening you will quietly nudge a box to fit the trade you already want. An indicator removes that bias and covers far more charts than you ever could by hand. The catch sits in the bottom-right cell: an automated tool is only as good as the rule behind it, and a careless rule fails silently because the boxes still look tidy.
RelicusRoad Pro
Have you been trading for a while but have never made consistent profits or are you new to FOREX trading and want to get a head start? Try RelicusRoad and you'll never look back.
Get RelicusRoad ProDoes the zone tool repaint?
This is the check that separates a usable tool from a screenshot generator. A zone repaints when it deletes or relocates a box on past candles as new price prints, so the history looks cleaner than it was in real time.
Test it the same way you would test any signal. Note where the zones sit on the last batch of closed candles. Let several more candles print. Come back and compare. If a box moved, widened to fit a later reaction, or vanished, the tool is editing its own past, and you cannot trust a marked level that only appeared once price had already turned.
A clean zone tool fixes the box to the candle that created it and leaves it there, win or lose. That is the same standard we covered in the non-repaint forex indicator guide : a level you can study after the fact is only useful if it is the same level you saw live.
Where does RelicusRoad Pro fit?
Zones are most reliable when they line up with where the largest participants actually transact, and that is an enormous pool of activity. The Bank for International Settlements 2022 Triennial Survey put global FX turnover near $7.5 trillion a day, the bulk of it institutional. Those orders leave the imbalances that zone tools try to map.
RelicusRoad Pro draws its institutional zones from that origin logic and locks each one to the candle that produced it, so a zone you act on today reads the same when you review it next week. It runs on MT4, MT5, and TradingView with identical behaviour, which matters if you chart on one platform and execute on another. The zones pair naturally with the structure work in our supply and demand zones guide and the broader levels framework in Action Levels . The indicator marks the area, and that context tells you which ones deserve a trade.
A zone tool will not fix loose risk or a rushed entry. What it does is give you a consistent, honest map of where order flow was last imbalanced, so you stop guessing where the line should go and start watching how price behaves when it returns.
Frequently asked questions
What does a supply and demand indicator actually do? It scans recent price action for the candles where a sharp move began (a tight base followed by a strong push away) and draws a rectangle around that origin area. Supply zones sit above price where selling overwhelmed buying; demand zones sit below where buying overwhelmed selling. The box is a reminder of where order flow was last imbalanced, so you watch how price behaves when it returns.
Are auto-drawn supply and demand zones better than drawing them by hand? Neither is automatically better. Hand-drawing teaches you to read the move and keeps you honest about why a zone matters, but it is slow and biased by what you want to see. An indicator is fast, consistent, and free of that bias, provided its rule is sound and it does not redraw zones after the fact. Many traders use the tool to flag candidates, then confirm by eye.
Do supply and demand indicators repaint? Some do. A zone tool repaints when it removes or relocates a box on past bars as new price arrives, so the chart looks cleaner than it was live. Check it the same way you would any signal: note the zones on closed candles, let several new candles print, then compare. If a box moved or vanished, the tool is editing its own history.
Can I use a supply and demand indicator on MT4, MT5, and TradingView? Yes. Zone logic works on any of them because it reads ordinary candle data. What matters is that the same rule produces the same zones across platforms and that the tool marks origins consistently. RelicusRoad Pro runs on MT4, MT5, and TradingView and keeps its zone behaviour identical across all three.
Is a supply zone the same as resistance? Related, but not identical. Resistance is any level where price has stalled before. A supply zone is narrower: it is the specific origin area of a strong down-move, where unfilled sell orders are most likely waiting. Every supply zone can act as resistance, but not every resistance line is a supply zone with order flow behind it.
Stop drawing lines and hoping price respects them to the pip. Map the area instead, confirm the tool keeps its zones honest, and let your own entry rules take it from there.
See how RelicusRoad Pro marks institutional zones across MT4, MT5, and TradingView →