Support and Resistance Mastery: Zones, Breaks and Retests
Support and resistance mastery begins with a simple change: stop expecting price to turn at one perfect line. A useful level is an area where traders previously changed behavior, not a guarantee that the next touch will hold.
This guide shows how to draw support and resistance zones consistently, classify the reaction and manage the trade if price bounces, breaks or retests the area.
In support resistance trading, the zone is context rather than a prediction. Price can pause, reverse or pass through it, so the trading strategy must define confirmation and failure before an order is placed.
What are support and resistance zones?
Support is an area where buying previously became strong enough to slow or reverse a decline. Resistance is an area where selling previously slowed or reversed a rise. Because spreads, volatility and order placement vary, the reaction commonly occurs across a range of prices rather than at one exact number.
A zone has three useful parts:
- Location: The price area where a meaningful reaction occurred.
- Evidence: Closes, rejection wicks or repeated turns that make the area visible.
- Invalidation: The point where price has moved far enough that the original idea no longer applies.
The third part is essential. Without invalidation, a zone becomes an excuse to hold a losing position indefinitely.
How do you draw support and resistance correctly?
Start with the higher timeframe, zoom out and mark only the clearest turning areas. Use candle bodies to find where price repeatedly accepted or rejected value, then include the most relevant wicks to set a reasonable zone width. Move to the entry timeframe only after the major map is complete.
Use the same sequence every time:
- Mark major swing highs and lows on the daily or H4 chart. These same pivots make good places to drop an anchored VWAP, which turns a static zone into a moving line at the crowd’s average cost.
- Group nearby reactions into one zone instead of several overlapping lines.
- Prefer recent, obvious areas that affected more than one candle.
- Remove zones that are far from current price or no longer influence structure.
- Label each zone with its timeframe so lower-timeframe noise does not outrank it.
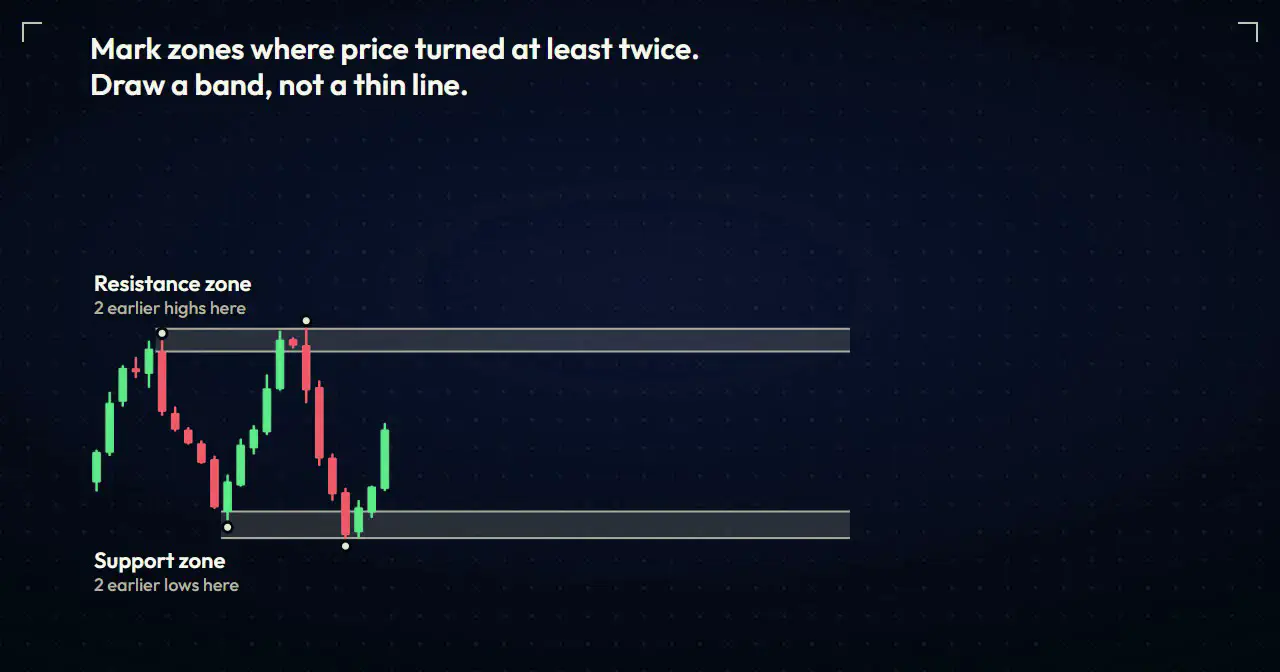
A clean chart should answer where you will pay attention. It should not cover every historical turn.
Which tools can help identify support and resistance?
Horizontal price levels should come from visible market structure first. Trend lines drawn under swing lows, moving averages and Fibonacci retracement levels can provide secondary context, but they should not be used to manufacture a zone where price has shown no meaningful reaction. Sloped tools such as diagonal Gann angles can layer trend context on top, though they depend on your chart scale, so keep them secondary to the reaction zones price has actually respected. A median-line pitchfork anchored to swing points is another such overlay, and the same rule holds: read the trend angle from it, but trust your reaction zones first. Because it strips out the small wiggles, reading congestion on a point and figure chart can make horizontal support and resistance shelves stand out without the wick clutter.
These are concepts in technical analysis, not fixed laws. A former resistance zone may become support in a bull market, but it can also fail when the structure or volatility regime changes.
When several technical analysis tools point to the same area, do not treat that “confluence” as certainty. Record each factor separately and compare the result with a simpler baseline. The goal is to identify support and resistance consistently, not to add enough lines that every outcome appears explained afterward.
Support and resistance lines are useful as chart labels, but orders and volatility occur across an area. Convert a line into a narrow, repeatable zone using the relevant candle closes and rejection wicks. That keeps the boundary testable while acknowledging that price rarely turns at one exact number.
Which support and resistance zones matter most?
Timeframe, recency and reaction quality are more useful than decorative labels. RelicusRoad Pro groups zones into three practical tiers so the chart remains readable.
| Zone tier | Typical timeframe | How to use it | Main caution |
|---|---|---|---|
| Major | Weekly and daily | Market context, major targets and broad invalidation | The zone can be wide |
| Intermediate | H4 and H1 | Pullbacks, continuation and swing entries | Check nearby major structure |
| Minor | M15 and M5 | Intraday reaction or target refinement | Easier to break and easier to overdraw |
- Typical timeframe
- Weekly and daily
- How to use it
- Market context, major targets and broad invalidation
- Main caution
- The zone can be wide
- Typical timeframe
- H4 and H1
- How to use it
- Pullbacks, continuation and swing entries
- Main caution
- Check nearby major structure
- Typical timeframe
- M15 and M5
- How to use it
- Intraday reaction or target refinement
- Main caution
- Easier to break and easier to overdraw
The color is a visual hierarchy, not a probability score. A red major zone can fail, and a minor zone can still matter during a quiet session.
How do you trade a bounce from a zone?
A zone identifies where to watch; price action identifies whether to act. Instead of placing an automatic order at every first touch, define a confirmation pattern that can be replayed and tested.
As price approaches a support or resistance level, note whether momentum is slowing or expanding. When price reaches support, long positions are only one possible response; the level can still fail. When price reaches resistance, selling pressure may appear, but the market can also accept above the zone and continue higher. A repeated failure to make a new high at resistance can build into a head and shoulders top, whose neckline is simply the support level that confirms the reversal once it breaks.
One risk-first bounce workflow is:
- Price enters a previously marked zone.
- The entry timeframe shows rejection or a failed attempt to continue through it.
- Price breaks the small countertrend structure that led into the zone.
- The stop sits beyond the price point that invalidates the rejection.
- The target is chosen from the next opposing zone or a predefined risk multiple.
This process may enter later than a blind limit order, but it makes the reason for entry and the point of failure explicit.
What is a breakout and retest setup?
A breakout and retest setup occurs when price closes through a zone, returns to it from the other side and then holds. Old resistance may act as support after an upward break; old support may act as resistance after a downward break. The retest is useful only when the close, return and confirmation rules are defined in advance, and the four-step break and retest check is one way to write them down.
For an upward example:
- Require a close above the resistance zone, not just a wick through it.
- Avoid chasing a candle that is already extended from the zone.
- Let price return to the broken area or build a new base above it.
- Look for evidence that sellers cannot push price back through the zone.
- Exit if price closes back inside and violates the chosen invalidation rule.
Do not call every break a “liquidity grab” after it fails. Record the exact conditions that separate a valid breakout, a retest and a failed breakout.
How do you handle a failed breakout?
A failed breakout happens when price moves beyond a zone but cannot maintain acceptance there. The safest response is not to reverse automatically; it is to recognize that the original breakout thesis is invalid and reassess the structure.
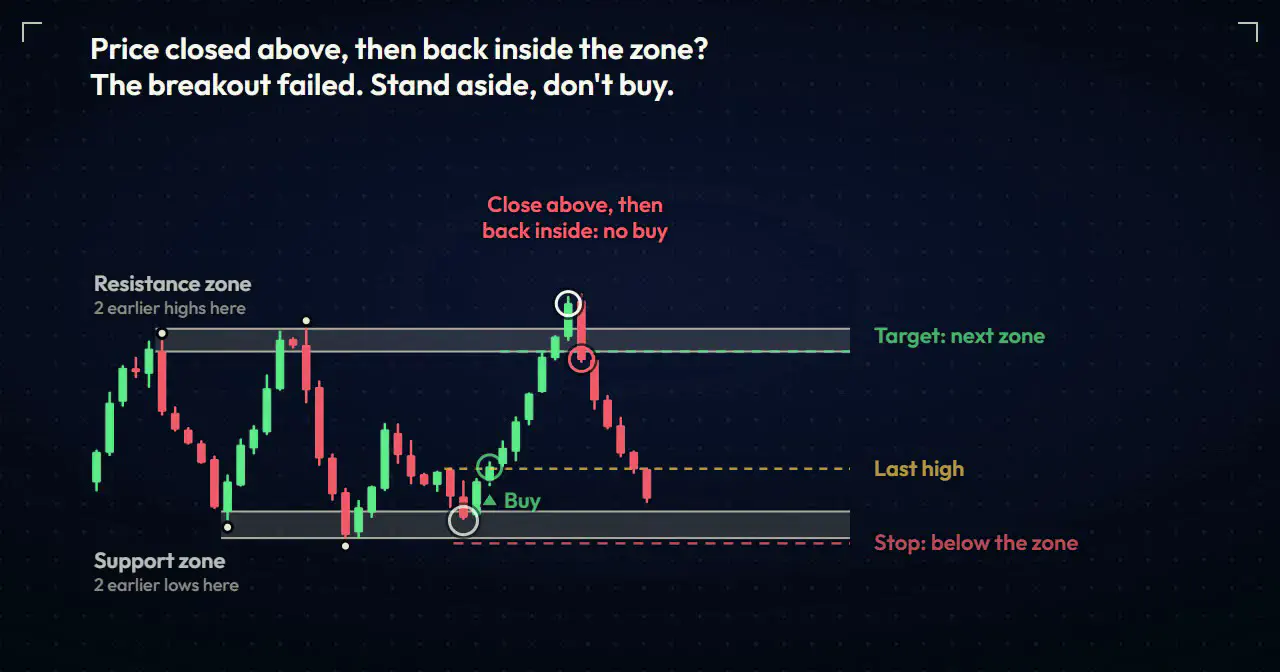
When price breaks a zone, wait for the predefined close or retest condition. Prices move through old levels regularly, particularly during high volatility. A break becomes actionable only when it matches the tested rule and still offers a logical invalidation point.
If your plan includes failed breakouts, specify:
- How far or how long price must trade beyond the zone.
- Whether confirmation requires a candle close back inside.
- Where the reversal idea becomes invalid.
- Whether scheduled news or spread expansion makes the setup unsuitable.
This prevents hindsight labels from replacing a testable strategy.
Do fresh zones work better than tested zones?
A newly formed zone may contain information that has not yet been revisited, while repeated tests can show that the area is being absorbed. That is a reasonable hypothesis to test, not a guaranteed rule. The strength of the original departure, current trend and nearby higher-timeframe structure still matter.
Record first, second and later touches separately in your journal. If your own sample shows a meaningful difference after costs, you can incorporate touch count into the rule.
Where should the stop go around a zone?
The stop should sit beyond price-based invalidation, not at an arbitrary distance from the colored rectangle. First decide which close, swing or structural break proves the setup wrong. Then calculate position size so the account risk remains controlled.
Volatility can make one fixed buffer inappropriate across markets. The ATR indicator guide explains how to compare a stop with recent movement, while the position-sizing guide turns that stop distance into a consistent risk amount.
Never increase risk merely because a zone is labelled major. Visual importance does not remove uncertainty.
Common support and resistance mistakes
The most common mistake is drawing too many zones. Others include entering before confirmation, moving a zone to fit the latest candle and treating a wick through support as proof of manipulation.
Avoid these habits:
- Giving a lower-timeframe level more weight than nearby daily structure.
- Placing the stop exactly on an obvious boundary without considering spread and volatility.
- Assuming a zone must hold because it held previously.
- Chasing a breakout after price is already far from invalidation.
- Ignoring correlated positions that depend on the same market direction.
For a related momentum perspective, see RSI divergence confirmation. Divergence can provide context near a zone, but it should not replace price confirmation or risk control.
Key takeaways
- Draw zones from higher-timeframe reactions, not every minor turn.
- Use the zone to define attention, then wait for a testable trigger.
- Classify the event as a bounce, breakout, retest or failed breakout.
- Set invalidation before entry and size the position from the stop.
- Review touch count and zone quality with your own data instead of relying on fixed success-rate claims.
Trading leveraged products can produce losses quickly. This article is educational and is not financial advice.
Next step: Use the ATR stop guide to turn your zone invalidation into a volatility-aware risk plan.
Support, resistance and price structure
Reading levels, zones and structure — where price actually reacts, and how to trade the retest instead of the guess.
73 guides in this topic
- Supply and Demand Zones: The Only Support & Resistance That Matters
- Candlestick patterns cheat sheet: bullish, bearish, neutral
- Bullish candlestick patterns: 9 that matter, ranked
- Supply and Demand Indicators: How to Read Zones Without Guessing
- Order Blocks vs. Supply Zones: Is there a Difference?
- Road Levels: The 'Smart Money' Map for High Probability Entries
- Action Levels Explained: How to Trade Institutional Price Zones
- Automated Support and Resistance Trading On Road Levels Without Guesswork
- Daily High/Low: The 'Kill Zone' Where Trends Go to Die
- Pivot Points: The Invisible Map of the Day
- Daily Pivots Trading Guide: How to Trade Like a Bank
- Scalp Pivots Strategy: How to Catch 'Micro-Trends' for Quick Profit
- 5 Ways to Use Real-Time Scalp Pivots for Quick Forex Profits
- The Power of Zeros: Why 1.0000 is a Brick Wall
- Murrey Math Lines: Do the 8/8 Levels Actually Hold?
- Trading Liquidity Zones: Where Institutions Actually Fill Their Orders
- The Quasimodo Pattern: The Hunchback that Prints Money
- Wyckoff Explained: How to Spot the Accumulation Phase
- Harmonic Patterns Guide: The Geometry of Markets
- Fibonacci Extensions: Where to Take Profit
- Fibonacci Retracement: How to Draw and Trade the Key Levels
- The Engulfing Candle: The Only Reversal Signal You Need
- The Inside Bar: Coiled Spring Strategy
- Forex Candlestick Patterns: Read the Sequence, Not One Bar
- The Fakeout: Why Breakout Trading is Dead (and what to do instead)
- Break and Retest Strategy: Wait for the Level to Flip
- Trendline Trading Strategy: Draw It Right, Then Trade It
- Pullback Trading Strategy: Buy the Dip Inside a Trend
- Mean Reversion Trading Strategy: Trade Back to the Average
- Mind the Gap: Trading Weekly Opens and Fair Value Gaps
- Dynamic Reversals: How to Catch the Turn Without Getting Wrecked
- Fractal Arrows Strategy: The 'Chaos Theory' of Market Turns
- Volume Profile Explained: Finding Value in the Noise
- Stop Trading Patterns: Why Order Flow Rules the Market
- Smart Money Concepts for Beginners: A No-Hype Starting Point
- The Russian Doll: Mastering Multi-Timeframe Analysis
- Multi-TF Trend Bar: Seeing the 'Matrix' of Market Trends
- Institutional Forex Indicators: How Smart-Money Tools Differ From Retail Ones
- Fair Value Gap Indicator: How to Spot and Trade FVGs Without Guesswork
- Renko Charts: Filtering the Noise for Pure Price Action
- Heikin Ashi: The Trend Smoother
- Head and Shoulders Pattern: How to Trade the Reversal Without Chasing Ghosts
- Double Top and Double Bottom Pattern: Trading the Reversal Without Guessing the Turn
- Cup and Handle Pattern: How to Trade the Breakout
- Wedge Pattern Trading: How to Read Rising and Falling Wedges
- Flag and Pennant Pattern: How to Trade Continuation Breakouts
- Rectangle Pattern: Trade the Range or the Breakout
- Hammer candlestick pattern: how to trade the reversal signal
- Doji candlestick pattern: what the indecision candle really tells you
- Morning star candlestick pattern: how to read the three-candle bottom
- Market profile trading: how to read value areas and point of control
- Break of Structure vs Change of Character: Which One Ends the Trend?
- Broadening formation: why breakouts keep failing inside a megaphone
- Bump and Run Reversal Pattern: How to Trade It
- Dark cloud cover pattern: the depth test most traders skip
- Diamond Chart Pattern: How to Spot and Trade It
- Hanging man candlestick pattern: how to trade the warning
- Harami candlestick pattern: most of them are not worth trading
- Island Reversal Pattern: How to Trade the Gap Trap
- Kicker Candlestick Pattern: How to Trade the Gap Reversal
- Marubozu candlestick: when a no-wick candle means it
- NR7 Trading Strategy: Trade the Quietest Candle in 7
- Price Channel Pattern: Trade Rising and Falling Channels
- Rising Three Methods Pattern: How to Trade the Pause
- Rounding Bottom Pattern: How to Trade a Base, Not a Bounce
- Shooting star candlestick pattern: one rejected high is not a top
- Spinning top candlestick pattern: the indecision candle
- Three white soldiers pattern: real reversal or exhausted run?
- Triangle chart pattern: trade the flat side, not the shape
- Triple Top and Triple Bottom Pattern: Trade the Third Test
- Tweezer top and bottom pattern: the level matters more than the candles
- VWAP: The Institutional Price Tag
- Wolfe Wave Pattern: Entry at Point 5, Target on Line 1-4
Reference documentation: Support & Resistance, Strategy #1: Price Action (Road) + SR + Trendlines + 2 TFs.