
You drew the line, price came back to it, you bought, and the next candle closed straight through it. So you dragged the line lower and bought again.
A trendline trading strategy only works if the line is drawn by a rule and left alone. Draw it under two rising swing lows, buy when a later touch closes back above it, put the stop below the line, and stop buying once two candles close under it. By the end you’ll have a check you can run on your chart before the next touch.
Key Findings
- Two lows draw it, a third touch tests it: an uptrend line needs two swing lows, the second higher, before a pullback to it is tradeable.
- The close decides: buy only when the touch candle closes back above the line, with the stop under the line and the candle's low.
- Two closes below end it: after two closes in a row under the line, the uptrend is over and you stop buying.
- Never redraw to fit: a line moved after it breaks can no longer tell you anything.
What is a trendline trading strategy?
It is a plan for trading pullbacks inside a trend using one straight line. In an uptrend you draw the line under the swing lows, wait for price to return to it, and buy when it holds. In a downtrend you draw it over the swing highs and sell when it holds. The same line tells you when the trend has ended.
The idea is old. Robert Edwards and John Magee devoted chapters to trendlines in Technical Analysis of Stock Trends back in 1948, and John Murphy’s Technical Analysis of the Financial Markets (1999) gave the rule most traders still use: two points draw a trendline, a third one confirms it. Investopedia’s trendline entry describes the same basics in plain terms.
What makes it hard is not the idea. It’s the drawing, and that is where most trendline trades go wrong.
How do you draw a trendline that holds up?
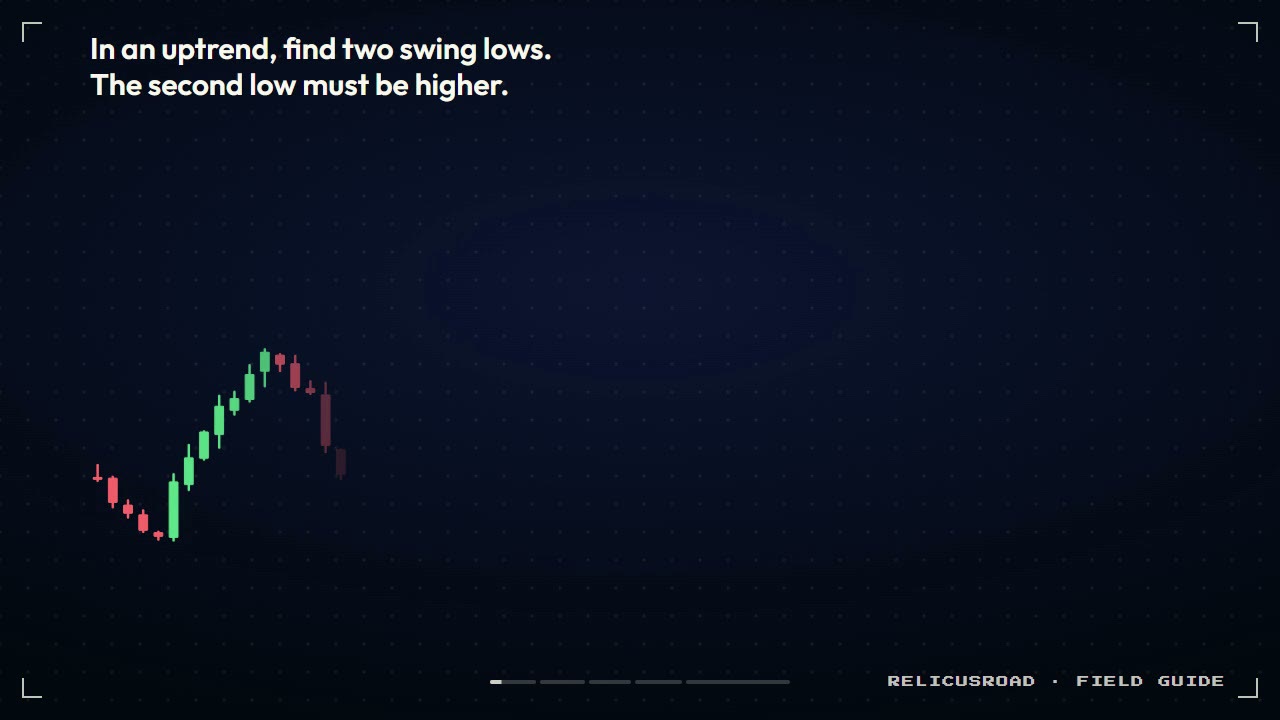
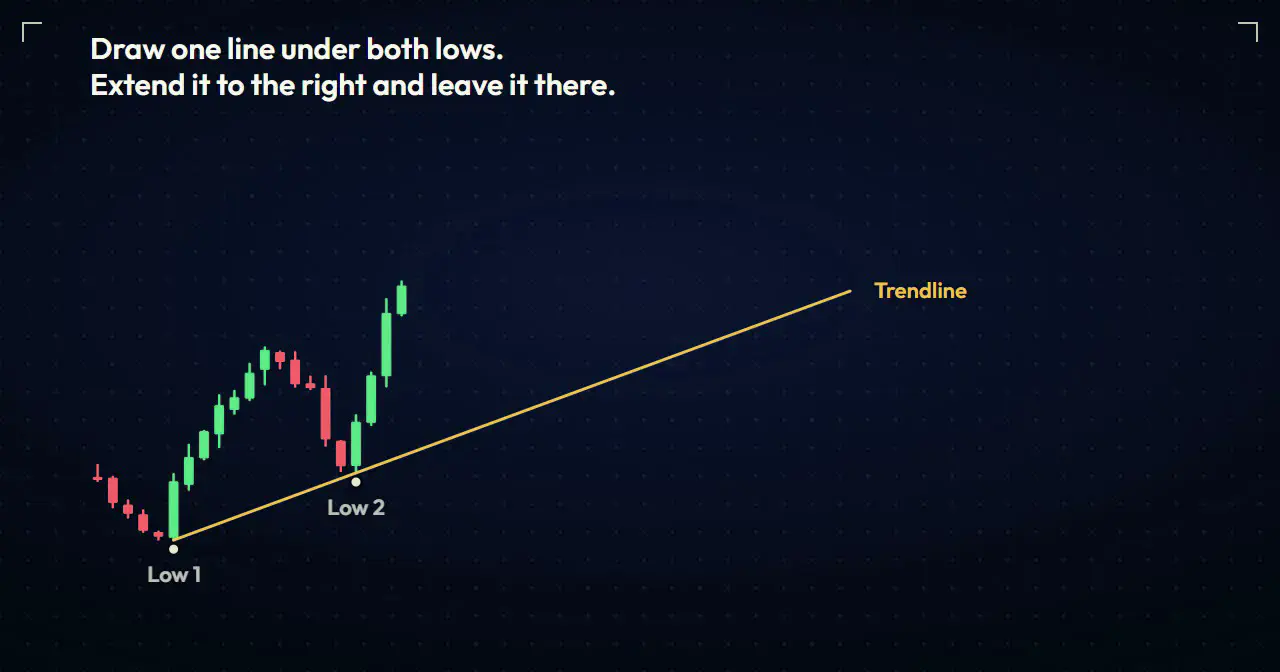
Start from confirmed swing lows, not any two dips you like. A swing low is a candle whose low is lower than the lows of the few candles on each side of it. You need two of them, and the second must be higher than the first, or you are not looking at an uptrend.
- Find the first clear swing low in the move.
- Find the next one. It has to sit higher.
- Draw a straight line under both lows and extend it to the right.
- Check the candles between the two lows. If bodies closed well below your line, it’s the wrong line.
Wicks or bodies? This post draws through the wick lows, because that is where price turned. Plenty of traders use bodies instead. Either is fine. Switching between them until the line looks good is not.
A very steep line is fragile. When the slope is sharp, even a sideways pause will cross it, so expect steep lines to break early and treat a shallow line as the one that tells you more about the trend. When a steady trend suddenly climbs far faster than its first line and then falls back through it, that sequence is the bump and run reversal pattern, and the original shallow line is the one to watch.
Why shouldn’t you move the line after it breaks?
Because the break is the information. The line exists to tell you when the uptrend stopped holding. If you drag it lower every time price closes through it, the line can never be broken, and a line that can’t break can’t warn you of anything.
Look at the red dashed line in that clip. It connects the first low to the new low after the drop, and on the chart it “holds.” It also sits under a market that has already turned down.
If the structure genuinely changes, draw a new line from new swing lows. That’s a fresh trend, and it has to earn its third touch like any other.
What do you do when price touches the line?
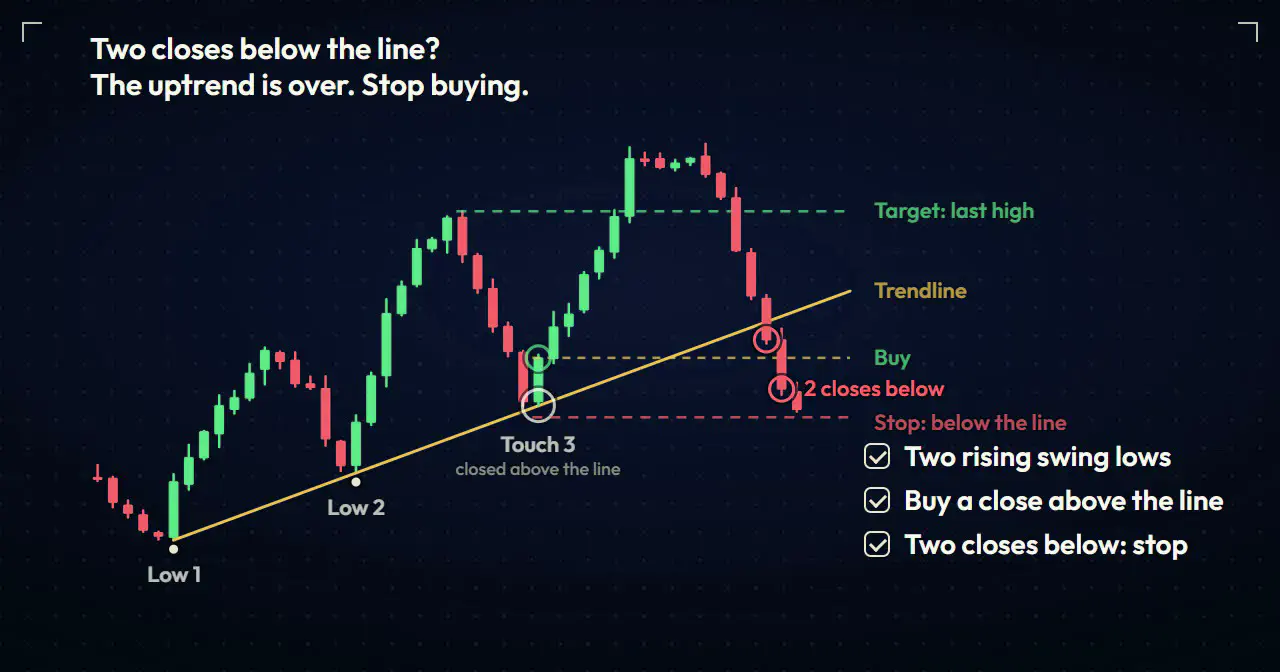
Wait for the candle to close. If it closes back above the line, you have a trade. If it closes below, you don’t, and a second close below ends the uptrend. The touch itself is not the entry; the close is.
When the close is above the line, the trade looks like this:
- Entry: the close of the touch candle.
- Stop: below the line and below that candle’s low, so a normal wick into the line doesn’t take you out.
- Target: the last swing high before the pullback. If that is less than your risk away, skip the trade. Copy the line up through that high and you have a rising price channel, whose upper line becomes the target.
Size the position from the stop, not the other way round. The position sizing routine fixes the loss in advance and lets the lot size fall out of the stop distance. Then check the risk reward ratio against the target before you click.
When is a trendline broken?
Two closes in a row below the line. A wick through it is normal; price probes both sides of any level. One close below is a warning, so you take no new buys. The second close confirms the uptrend is over, and any buy still open on that trend idea should come off.
A break does not mean you should sell at once. Often price comes back up to test the broken line from below; that is a separate setup, covered in the break and retest strategy. And a close below that reverses straight back above is its own pattern, a failed breakout.
Should you draw trendlines by hand or use an indicator?
It depends on what you want to control. Hand-drawn lines are yours, which is also their weakness: two traders looking at the same chart will pick different anchors. An automatic tool removes that choice, at the cost of lines that may shift as new bars close.
| Hand-drawn trendline | Automatic trendline tool | Horizontal support line | |
|---|---|---|---|
| Who picks the anchors | You | A fixed rule | You, from past turns |
| Main risk | Drawing the line you hope to see | Lines refit as bars close | Ignores the slope of the trend |
| Stays where you drew it | Yes, unless you move it | Depends on the tool | Yes |
| Best for | Learning to read swings | Consistent, rule-based anchors | Ranges and flat markets |
- Hand-drawn trendline
- You
- Automatic trendline tool
- A fixed rule
- Horizontal support line
- You, from past turns
- Hand-drawn trendline
- Drawing the line you hope to see
- Automatic trendline tool
- Lines refit as bars close
- Horizontal support line
- Ignores the slope of the trend
- Hand-drawn trendline
- Yes, unless you move it
- Automatic trendline tool
- Depends on the tool
- Horizontal support line
- Yes
- Hand-drawn trendline
- Learning to read swings
- Automatic trendline tool
- Consistent, rule-based anchors
- Horizontal support line
- Ranges and flat markets
RelicusRoad Trendlines is the automatic option in our toolkit for MT4 and MT5. It builds lines only from swing pivots confirmed by closed bars, draws each line as a shaded zone instead of a hairline, and marks a break only after two closes beyond it. It also re-chooses and refits the drawn lines on every closed bar, so screenshot any line you trade. It’s also part of RelicusRoad Pro. For the flat version of the same skill, the support and resistance guide covers zones and invalidation.
Frequently asked questions
What is a trendline trading strategy? A way to trade pullbacks in a trend with one straight line through the swing points. Wait for price to return to the line, enter when a candle closes back on the trend side, and keep the stop past the line. Two closes through it end the idea.
How many touches make a valid trendline? Two swing lows draw an uptrend line; a third touch that holds tests it. John Murphy states this in Technical Analysis of the Financial Markets (1999). A line that has never been retested is a guess.
Should a trendline go through wicks or candle bodies? Pick one rule and keep it. This post uses wick lows, where price turned. Bodies work too. Switching between them until the line looks right is the mistake.
When is a trendline broken? On closes, not wicks. One close below is a warning, so no new buys. Two closes in a row below mean the uptrend has ended, and buys taken on that trend should be closed.
Do automatic trendline indicators repaint? Many redraw as new bars close. RelicusRoad Trendlines keeps its confirmed pivots fixed but refits the drawn lines every closed bar. That suits reading the current structure; screenshot any line you trade.
Open your chart, find two rising swing lows, and draw the line before the next pullback arrives. If you’d rather the anchors came from a fixed rule, see how RelicusRoad Trendlines picks them.
Written for RelicusRoad by RelicusDigital.com.
Keep going on this topic
Support and Resistance Mastery: Zones, Breaks and Retests
Master support and resistance zones with repeatable drawing rules, breakout and retest confirmation, invalidation, position sizing and common mistakes.
- Break and Retest Strategy: Wait for the Level to Flip
- Mean Reversion Trading Strategy: Trade Back to the Average
- Pullback Trading Strategy: Buy the Dip Inside a Trend
- Mind the Gap: Trading Weekly Opens and Fair Value Gaps
- Dynamic Reversals: How to Catch the Turn Without Getting Wrecked
- Fractal Arrows Strategy: The 'Chaos Theory' of Market Turns
- Volume Profile Explained: Finding Value in the Noise
- Stop Trading Patterns: Why Order Flow Rules the Market
- The Russian Doll: Mastering Multi-Timeframe Analysis
- Multi-TF Trend Bar: Seeing the 'Matrix' of Market Trends
- Institutional Forex Indicators: How Smart-Money Tools Differ From Retail Ones
- Fair Value Gap Indicator: How to Spot and Trade FVGs Without Guesswork
- Renko Charts: Filtering the Noise for Pure Price Action
- Heikin Ashi: The Trend Smoother
- Head and Shoulders Pattern: How to Trade the Reversal Without Chasing Ghosts
- Double Top and Double Bottom Pattern: Trading the Reversal Without Guessing the Turn



