
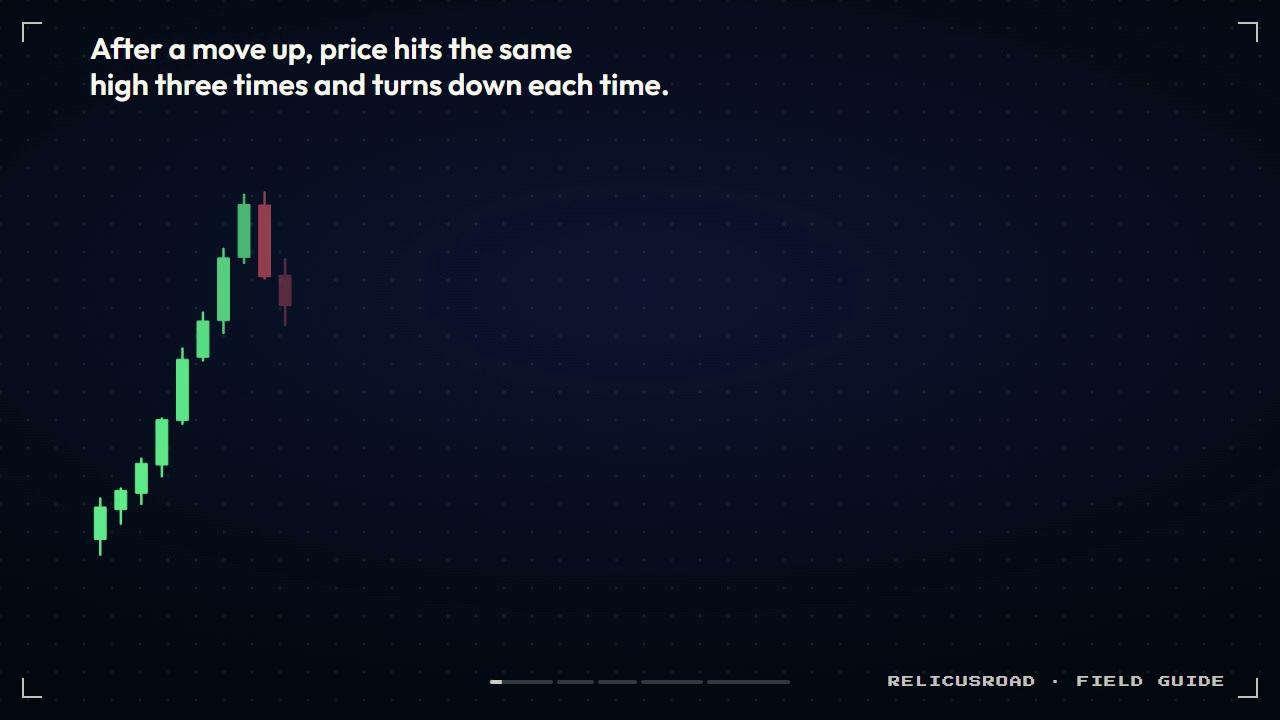
Price runs into the same ceiling three times. Each rally stalls, each pullback finds buyers, and by the third rejection it feels obvious that the top is in. So you sell the third high. Then price chops sideways for another week, and the “triple top” turns out to be the middle of a range.
Here is the short answer. A triple top and triple bottom pattern is a range until a candle closes through its neckline. Three tests tell you where the fight is; the close tells you who won. By the end of this guide you will be able to separate a real reversal from a sideways market, place the stop where the idea is wrong, and measure a target before you enter.
Key Findings
- Three tests, one level: a triple top is three highs near the same price after a rise; a triple bottom is three lows near the same price after a fall.
- The neckline close is the signal: selling the third high is a guess about a range, while selling the close below the in-between lows is a confirmed break.
- Stop past the extreme test: place it beyond the highest high (or lowest low) of all three, because the third test is often the weakest of them.
- Target from the neckline: project the pattern's height past the neckline as a first target, then manage the rest of the trade.
What is a triple top and triple bottom pattern?
A triple top is a reversal shape: three highs at about the same price after an uptrend, separated by two pullback lows. A triple bottom flips it: three lows at about the same price after a downtrend, with two bounce highs between them. The line across those in-between points is the neckline.
The trend before the pattern matters. Three equal highs after a long rise read as buyers running out of strength at one price. Three equal highs in the middle of a flat market are a range doing what ranges do.
Thomas Bulkowski, who catalogued thousands of chart patterns in his Encyclopedia of Chart Patterns (2nd edition, Wiley, 2005) and on his pattern site, treats the triple top as unconfirmed until price closes below the lowest low inside the formation. That one rule does most of the work in this guide.
Is the third test stronger than a double top?
Not on its own. A third rejection shows sellers holding the same price for longer, but it also means price has spent more time going sideways. Both a double top and a triple top ask for the same proof: a close below the lows. Until then, three highs look exactly like a range.
Watch the right-hand panel. The range touches the ceiling more often than either pattern, and it still gives no signal, because price never closes outside the box.
| Shape | Tests of the level | What confirms it | What you do before confirmation |
|---|---|---|---|
| Double top | Two highs | Close below the single low between them | Wait; no sell yet |
| Triple top | Three highs | Close below the lower of the two lows | Wait; no sell yet |
| Range (rectangle) | Many highs and lows | Close outside the top or bottom of the box | Trade the edges only with a plan, or wait |
- Tests of the level
- Two highs
- What confirms it
- Close below the single low between them
- What you do before confirmation
- Wait; no sell yet
- Tests of the level
- Three highs
- What confirms it
- Close below the lower of the two lows
- What you do before confirmation
- Wait; no sell yet
- Tests of the level
- Many highs and lows
- What confirms it
- Close outside the top or bottom of the box
- What you do before confirmation
- Trade the edges only with a plan, or wait
The table shows why counting touches is a weak edge. If you want the range side of this in depth, the rectangle pattern guide covers trading inside the box and the break out of it.
How do you trade a triple bottom breakout?
Buy only when a candle closes above the neckline, the line across the two bounce highs. Put the stop under the lowest of the three lows, and set the first target one pattern height above the neckline. Here is that sequence on a computed price series.
The buy marker sits on the first candle that closes above the neckline, not on the third low. Step by step:
- Confirm the downtrend came first. Three equal lows in a flat market are a range floor, not a bottom.
- Mark the three lows and draw the neckline across the higher of the two bounce highs.
- Wait for a candle to close above that line. A wick through it does not count.
- Place the stop below the lowest low of the three, then measure the target before you click buy.
Where do the stop and target go on a triple top?
The stop goes above the highest of the three highs; the first target is the pattern’s height, measured down from the neckline. The sell is the close below the neckline. Everything else follows from those three lines.
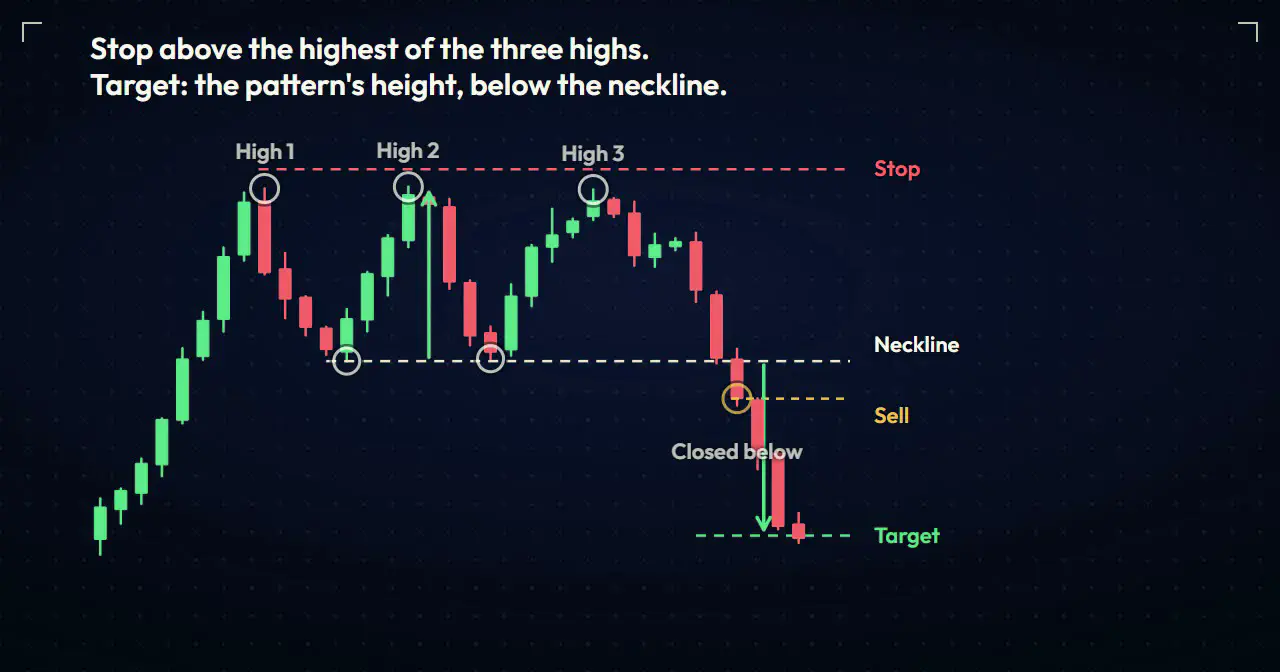
In this example the second high is the highest of the three, so the stop sits above it, not above the third high. That detail catches a lot of traders.
To set the target, measure from the top high down to the neckline and subtract that distance from the neckline. Then check the reward against the risk: if the stop is far above the entry and the target is close, the trade may not pay enough. The risk-reward ratio guide walks through that check.
What makes a triple top fail?
A triple top fails when price closes above the highest of the three highs. At that point the ceiling has broken, and the same level that looked like resistance can turn into a floor. A few warning signs show up before that:
- The third pullback stops well above the neckline, so lows are rising into the ceiling.
- Price never closes below the neckline, only wicks through it and snaps back.
- The breakdown candle closes below the line, and the next candles close straight back above it.
The last one is the common trap. A single close below the neckline that gets erased the next day is a warning, not a trend. Some traders wait for a second close or a retest of the neckline from below before selling; that costs a worse entry and buys a cleaner signal.
Can a pattern scanner repaint a triple top?
Yes, if it labels the pattern on a candle that has not closed yet. A scanner can mark “triple top” while the third high is forming, then erase the label when the candle closes somewhere else. A tool that only marks a level after its candle closes cannot change that mark later. Test any scanner on a live chart for a few sessions and watch whether old labels move.
| Behaviour | Repainting scanner | Close-based tool |
|---|---|---|
| When the label appears | While the candle is still forming | After the candle closes |
| Can the label move later? | Yes, or disappear | No |
| What a backtest screenshot shows | Only the labels that survived | Every label it ever printed |
- Repainting scanner
- While the candle is still forming
- Close-based tool
- After the candle closes
- Repainting scanner
- Yes, or disappear
- Close-based tool
- No
- Repainting scanner
- Only the labels that survived
- Close-based tool
- Every label it ever printed
That gap is why a non-repaint indicator matters for pattern trading: the signal you see in history is the one you would have seen live.
Where does RelicusRoad Pro fit?
The hardest part of a triple top is drawing an honest ceiling and an honest neckline before the break. RelicusRoad Pro draws support and resistance zones for you on MT4, MT5 and TradingView, which gives you a second opinion on where the three tests and the neckline really sit. If you only want the levels, the standalone Support Resistance tool for MT4 and MT5 builds zones from swing highs and lows and grades each zone by how it held on its recent tests, which is the exact question a triple top asks.
It does not decide the trade for you. You still wait for the close, and you still set the stop above the top high before you sell.
Frequently asked questions
What is a triple top and triple bottom pattern? A triple top is three highs at about the same price after a rise, with two pullback lows between them. A triple bottom is three lows at about the same price after a fall. Either is confirmed only by a close through the neckline.
Is a triple top more reliable than a double top? Not automatically. The third test shows sellers defending the level longer, but also more sideways time. Both need a close below the neckline.
Where should the stop go on a triple top? Above the highest of the three highs, plus a small buffer. On a triple bottom, below the lowest of the three lows.
How do you measure the target for a triple bottom? Take the height from the lowest low to the neckline and add it to the neckline. Treat it as a first target and manage the rest.
Can a triple top turn into an uptrend? Yes. A close above the top high means the pattern failed, and that is exactly where your stop belongs.
Pull up the last three-touch top you traded and ask one question: did a candle close below the neckline before you sold? To check your ceiling and neckline against automatically drawn support and resistance zones, look at RelicusRoad Pro.
Written for RelicusRoad by RelicusDigital.com.
Keep going on this topic
Support and Resistance Mastery: Zones, Breaks and Retests
Master support and resistance zones with repeatable drawing rules, breakout and retest confirmation, invalidation, position sizing and common mistakes.
- Double Top and Double Bottom Pattern: Trading the Reversal Without Guessing the Turn
- Head and Shoulders Pattern: How to Trade the Reversal Without Chasing Ghosts
- Tweezer top and bottom pattern: the level matters more than the candles
- VWAP: The Institutional Price Tag
- Wolfe Wave Pattern: Entry at Point 5, Target on Line 1-4
- Supply and Demand Zones: The Only Support & Resistance That Matters
- Candlestick patterns cheat sheet: bullish, bearish, neutral
- Bullish candlestick patterns: 9 that matter, ranked
- Supply and Demand Indicators: How to Read Zones Without Guessing
- Order Blocks vs. Supply Zones: Is there a Difference?
- Road Levels: The 'Smart Money' Map for High Probability Entries
- Action Levels Explained: How to Trade Institutional Price Zones
- Automated Support and Resistance Trading On Road Levels Without Guesswork
- Daily High/Low: The 'Kill Zone' Where Trends Go to Die
- Pivot Points: The Invisible Map of the Day
- Scalp Pivots Strategy: How to Catch 'Micro-Trends' for Quick Profit



