Welcome to Part 2, where each chapter takes one tool on your chart and teaches you to read it, starting with the one the whole system is named after.
You open a chart and you see candles going up and down, but you cannot tell whether price is stretched too far or sitting in the middle of its usual range. You also cannot tell whether the market is drifting sideways or genuinely trending. Road Levels answer both questions with seven curved lines.
The idea is simple. There is a center line that follows price calmly, and three bands on each side that mark how far price has been straying from it. When price is near the center, it is at home. When it reaches the outer bands, it has traveled a long way from home, and you start asking whether it will come back. If you want the background story first, the Road Levels guide on the blog covers it.
What you see on your chart
With the default settings you get seven smooth, curved lines running across the whole chart, one after another from top to bottom.
- Sell Liquidity Level 3 — dotted, crimson (red). The outermost line above price.
- Sell Liquidity Level 2 — dotted, goldenrod (yellow).
- Sell Liquidity Level 1 — solid, crimson. The first band above the center.
- Neutral Liquidity Level — dotted, dim gray. The center line.
- Buy Liquidity Level 1 — solid, light green. The first band below the center.
- Buy Liquidity Level 2 — dotted, goldenrod (yellow).
- Buy Liquidity Level 3 — dotted, light green. The outermost line below price.
Notice that both level-2 lines are yellow, and only the level-1 lines are solid. That makes the two level-1 lines the easiest to find at a glance, and they are the ones you will use most.
At the right edge of the chart, just past the newest candle, small gray labels name the lines: TP/SL-3, TP/SL-2 and TP/SL-1 on each side, and Safe Close on the center line. On a zoomed-in chart the lower labels often sit off the bottom of the screen, so scroll the price scale if you cannot see them.
The colors can look slightly different on your screen. Untouched default colors follow the chart palette you picked in RelicusRoad Pro, including the color-blind palettes, and each one is lightened or darkened so it stays visible against your chart background. A color you change yourself always wins.
How to read the road
Start with the center line. It is a smoothed average of price, so it curves up when price has been rising, curves down when price has been falling, and runs flat when price is going sideways. That slope is your first reading: is the road flat, or is it tilting?
Next, look at the bands. Each one is drawn from how far price has been straying from the center. Level 2 sits one and a half times as far out as level 1, and level 3 sits twice as far out. So level 1 means “price has moved a normal distance from home”, and level 3 means “price has moved a long way”.
The two sides are not mirror images. When price has spent more time below the center, the bands below grow wider and the bands above grow narrower, and the other way round. Do not expect the red and green lines to sit the same distance from the center.
Now the part that is easy to miss. The bands move. After a strong move, the whole road bends toward price and follows it. So in a trend, price “touching” a band is often the band catching up with price, not price reaching a fixed ceiling or floor.
What the road does not tell you matters just as much. It does not read volume, orders or where large traders sit. It does not find chart patterns or swing points. It is price, averaged and measured, and that is all. No tool wins every trade, and a line on a chart is never a promise; losses are a normal part of trading with this one too.
A walk-through on a real chart
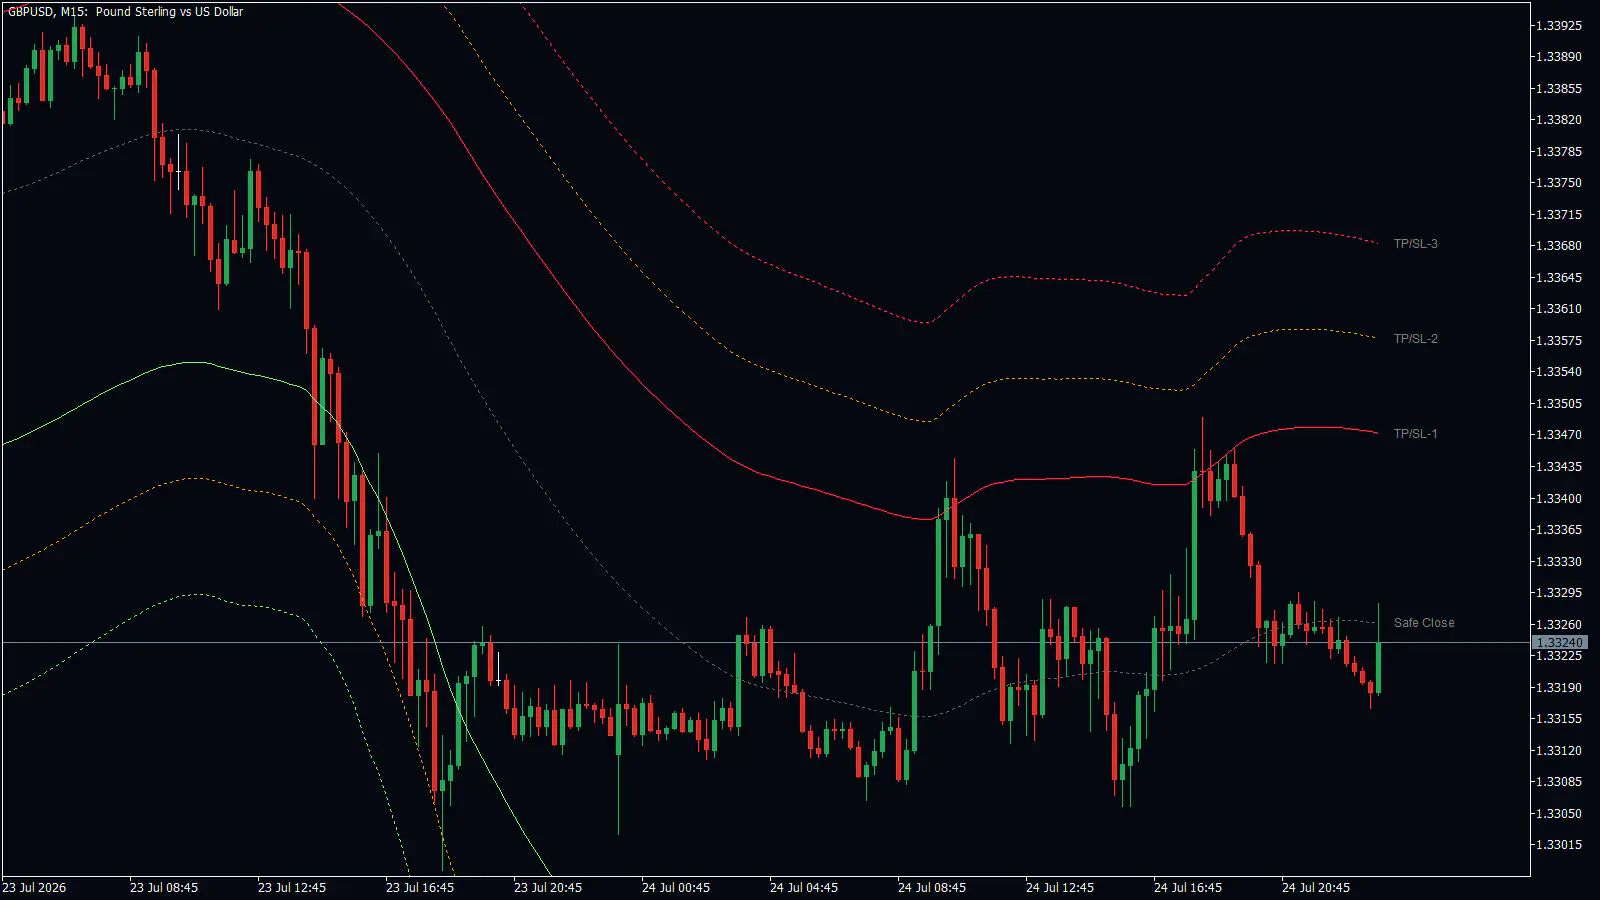
Look at the GBPUSD 15-minute chart above, from 23 and 24 July 2026.
On 23 July, price broke below the gray center line and kept falling, straight through Buy levels 1, 2 and 3. All the lower lines bent down with it. The low was 1.3302, and after that price went flat. On that day the road was steep, and fading the move (trading against it, betting on a return to the middle) would have meant standing in front of a falling market.
By the morning of 24 July things looked different. The lines had leveled out, and the road was flat. That is the condition you want before trading a band. At 08:45, price rallied into the solid red Sell level 1 near 1.3345. A candle’s wick, the thin line above its body, poked into the line and price turned back down. It worked its way back to the gray Safe Close line.
At 17:00 the same thing happened again. Price rallied to about 1.3348, met Sell level 1, and was turned back toward the center.
If you were trading this, the plan would read like this. Wait for a flat road. Wait for price to reach the solid level-1 line and for a candle to show it being rejected. Place your stop loss, the order that closes the trade if you are wrong, a few pips beyond the dotted yellow level 2. A pip is the small standard unit of price movement. Aim for the gray center line as your target.
That is one example on one day. It shows what a good reaction looks like; it does not show how often it will happen again.
How traders use it
Four setups showed up clearly on real charts. The first one is the walk-through above: in a flat road, price reaches level 1, gets rejected, and heads back to the center. The GBPUSD 1-hour chart showed the same thing on 9 and 10 June 2026, when two rallies into Sell level 1 were both turned back. The filter that helped every time was the road being flat or turning, not steeply sloped.
The second setup uses the center line in a trend. When the road is tilting down, price can pull back up to the gray line and stall there before the fall continues. The mirror image applies in a rising road.
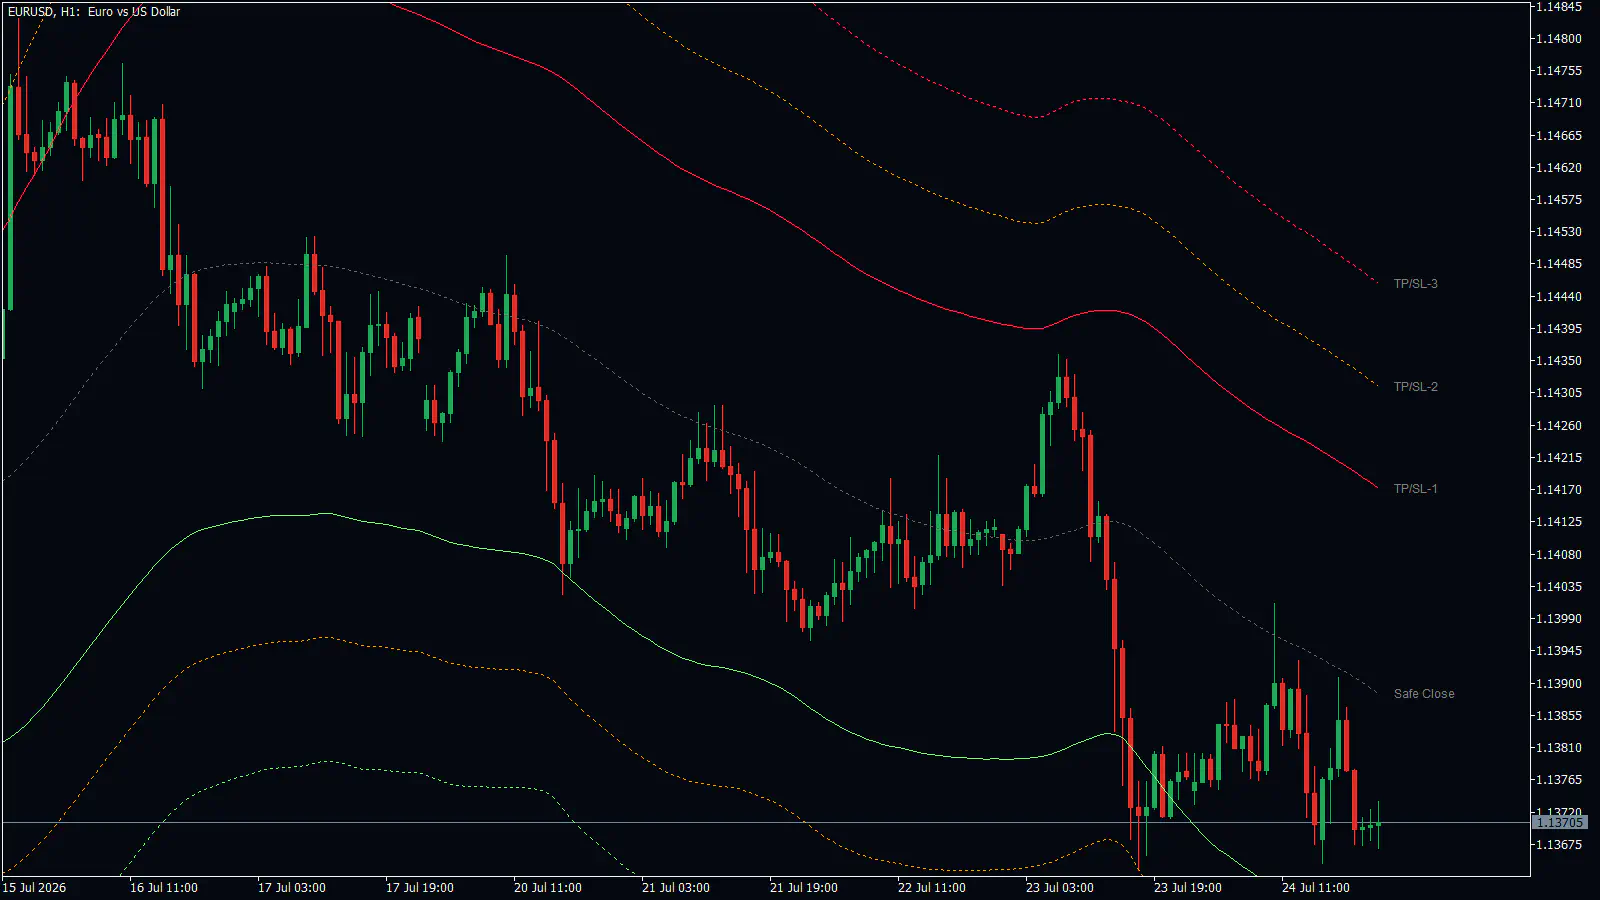
On this EURUSD 1-hour chart, price stayed under the center line from 17 to 22 July and was turned back at it on at least four days. For this setup, a stop goes above Sell level 1 and the target is Buy level 1. On 23 July, a spike up to 1.1435 stopped just under Sell level 1, and then price dropped about 70 pips, through the center and through Buy level 1.
That 23 July drop is the third setup: a break with a sloping road. When price closes through the center and through level 1 while the road is turning the same way, on these charts it was the start of a continued move rather than a reversal. The same happened on GBPUSD on 5 June and 23 July 2026.
The fourth setup was seen only once, so treat it as something to watch, not a rule. On the GBPUSD 4-hour chart in May 2026, a sell-off pushed price below Buy level 3 for several candles, to about 1.3310. Price then snapped back to Buy level 1 and up to the center line within about five days. If you try this, the stop goes beyond the extreme wick.
Tip: Before any band trade, look at the slope of the gray center line first. A flat line and a steep line call for completely different trades.
Mistakes people make
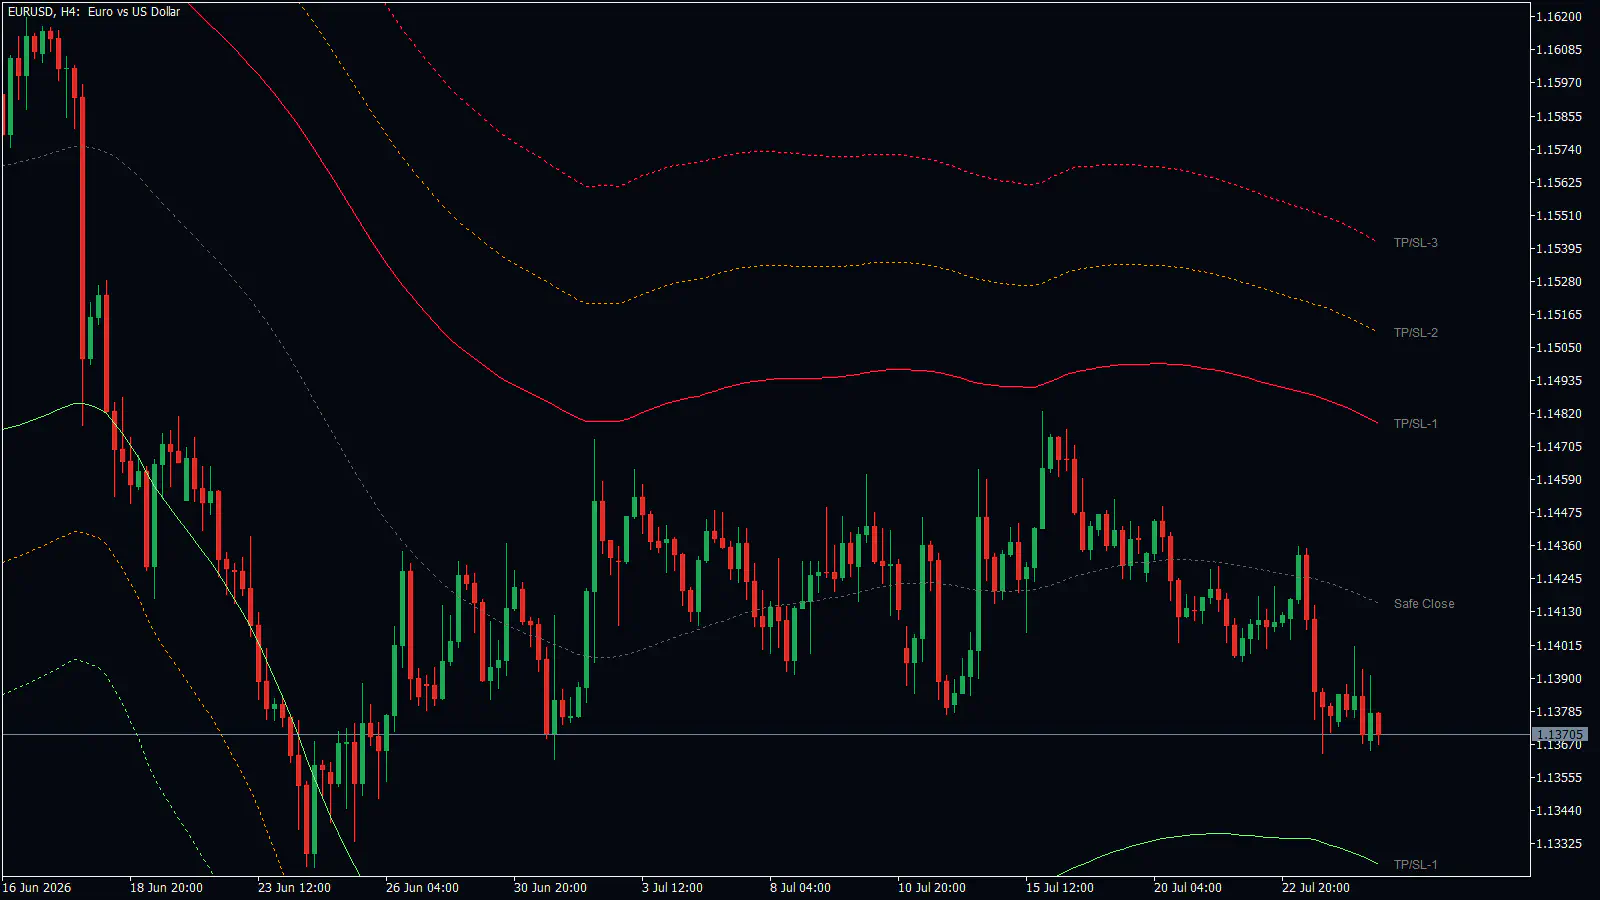
Fading level 1 in a strong trend. On the EURUSD 4-hour chart from 17 to 23 June 2026, price rode on or below Buy level 1 for about six days while the line bent down with it. A buy at the first touch, around 19 June, would have been about 150 pips against you before the low. When the road is steep, the band is not a floor.
Trading every touch when price walks along a line. On the GBPUSD 1-hour chart on 12 June 2026, price moved along Sell level 1 with touch after touch and no clean rejection. Selling each touch either got stopped out or went nowhere. One sharp rejection is a reaction; a row of touches is price leaning on the line.
Treating a band touch as price reaching a fixed level. In a trend the bands follow price, so the line comes to meet it. Judge a touch by the slope of the road, not by the touch alone.
Setting a limit order exactly on the line. On EURUSD on 23 July (1-hour chart) and 21 July (15-minute chart), rallies stopped a few pips short of Sell level 1. An order sitting exactly on the line would never have filled. Wait for price to react, then decide.
Reading an alert as a signal. The alert tells you price reached a line after staying away from it. It does not tell you price bounced.
Turning it on and setting it up
Road Levels are on by default. The switch is Road Levels (Price Action) in the indicator inputs, and it starts set to true.
- Open the indicator’s inputs and scroll to the group headed ROAD ALGO. The Road settings below all live there.
- Check that Road Type is set to Simple Road Narrow (No-Repaint). It is the default, and it is the type every example in this chapter uses.
- Under SHOW ROADLINES, switch off any line you do not want. You can start with just the center and the two level-1 lines to keep the chart clean.
- Change colors, widths or styles only if the defaults are hard to see on your screen.
- Switch on Show Alerts if you want to hear when price first reaches a line.
Careful: If you plan to use Reversal Arrows, keep Road Levels switched on with one of the Simple road types. Those arrows depend on it.
Here is what each setting does.
| Setting | What it does | When to change it |
|---|---|---|
| Road Type | Picks how the road is built. Simple Road Narrow (No-Repaint) averages 61 bars and draws 7 lines. Simple Road Wide (No-Repaint) averages 120 bars, so the road is slower and smoother. Smooth Road Narrow and Smooth Road Wide are marked Repaint. Trend/Breakout Road (No-Repaint) averages 21 bars and draws only 3 lines. | Try Wide if the Narrow road feels too jumpy. Stay on a Simple type while you learn. |
| Bar History | How many candles are calculated. Default 3000, maximum 5000. | Lower it on a slow computer; raise it only to see further back. |
| SHOW ROADLINES | Shows or hides each of the seven lines and its label. All on by default. | To declutter the chart. |
| ROADLINES NAMES | The label text. Defaults: TP/SL-3, TP/SL-2, TP/SL-1, Safe Close, TP/SL-1, TP/SL-2, TP/SL-3. | If you prefer your own names. |
| ROADLINES COLORS | Line colors. Defaults: crimson for Sell levels 1 and 3, goldenrod for both level 2 lines, dim gray for the center, light green for Buy levels 1 and 3. | If a line is hard to see. |
| ROADLINES WIDTH | Line thickness, 1 to 5. All 1 by default. | If lines are too thin on a large screen. |
| ROADLINES STYLE | Solid or dotted. Level 1 lines are solid; levels 2, 3 and the center are dotted. | Rarely. |
| Show Alerts | Alerts when price first touches a line after seven closed candles entirely on the other side of it. Off by default. | When you want to be called to the chart. |
- What it does
- Picks how the road is built. Simple Road Narrow (No-Repaint) averages 61 bars and draws 7 lines. Simple Road Wide (No-Repaint) averages 120 bars, so the road is slower and smoother. Smooth Road Narrow and Smooth Road Wide are marked Repaint. Trend/Breakout Road (No-Repaint) averages 21 bars and draws only 3 lines.
- When to change it
- Try Wide if the Narrow road feels too jumpy. Stay on a Simple type while you learn.
- What it does
- How many candles are calculated. Default 3000, maximum 5000.
- When to change it
- Lower it on a slow computer; raise it only to see further back.
- What it does
- Shows or hides each of the seven lines and its label. All on by default.
- When to change it
- To declutter the chart.
- What it does
- The label text. Defaults: TP/SL-3, TP/SL-2, TP/SL-1, Safe Close, TP/SL-1, TP/SL-2, TP/SL-3.
- When to change it
- If you prefer your own names.
- What it does
- Line colors. Defaults: crimson for Sell levels 1 and 3, goldenrod for both level 2 lines, dim gray for the center, light green for Buy levels 1 and 3.
- When to change it
- If a line is hard to see.
- What it does
- Line thickness, 1 to 5. All 1 by default.
- When to change it
- If lines are too thin on a large screen.
- What it does
- Solid or dotted. Level 1 lines are solid; levels 2, 3 and the center are dotted.
- When to change it
- Rarely.
- What it does
- Alerts when price first touches a line after seven closed candles entirely on the other side of it. Off by default.
- When to change it
- When you want to be called to the chart.
Alerts also depend on the global Show Alerts switch and on the global popup, email and mobile switches, which decide how the message reaches you. A sound always plays. The same message is not repeated within three candles.
The Trend/Breakout type is different enough to mention on its own. It draws only a center line and one line on each side, it prints no labels, and it is drawn 21 candles to the right, so its right end projects ahead of price. The walk-through and setups in this chapter do not use it.
Questions people ask
Does Road Levels repaint? The default Simple types and the Trend/Breakout type only use bars that have already happened. The line on the current candle moves with price until the candle closes, then stays put. The Smooth types say Repaint in their name: they use later bars to draw earlier parts of the line, so the recent part can change after the fact.
Do the lines show where big orders or volume sit? No. The center is a smoothed average of price, and the bands come from how far price has been straying from it. The tool does not read volume or order data.
Why do the lines bend toward price after a big move? The band width is recalculated from how far price has been straying. After a strong move the whole road follows price.
What do the TP/SL and Safe Close labels mean? They are the default names at the right edge. Safe Close marks the center line; TP/SL-1 to TP/SL-3 mark the bands. You can rename them under ROADLINES NAMES.
How do the alerts work? Switch on Show Alerts. An alert fires when price touches a line for the first time after seven closed candles entirely on the other side. It means the line was reached, not that price bounced.
For more on the tool, watch the RelicusRoad overview, the How it works explanation, or the trading session on Strategy #4. You can also bring your Road Levels questions to our Discord community.
Remember:
- Check the slope of the gray center line first: flat roads suit band trades, steep roads do not.
- The bands follow price after a big move, so a touch in a trend is not a fixed floor or ceiling.
- Wait for price to react at a line; do not park an order exactly on it.
Road Levels tell you where price sits against its own average. Support & Resistance Zones come next and add the prices where the market has actually turned before; after that, Action Levels and Signal Lines build on both, and every tool is listed on the Features overview.