
You look at a chart and try to work out where the last real swing high was. Was it that spike yesterday, or the one this morning? Where exactly would a stop go so it sits beyond the last turn?
Dynamic Reversals answers that for you. It puts a marker on the tip of each swing high and each swing low, and labels it, so the structure of the market is visible at a glance. Structure here means the pattern of highs and lows, for example lower highs and lower lows in a downtrend.
It is important to know from the start what this tool is not. It does not predict turns. Every marker sits on a price that has already happened. Its value is as a map of the swings, and that map is very useful for stops and for reading trend direction.
What you see on your chart
The tool looks for swings at three sizes, called tiers. Each tier uses a lookback, that is, a number of bars it looks back over: 9 bars for Short, 60 for Medium and 156 for Long.
Short markers are small solid dots. A swing high gets an orange-red dot on the tip of the upper wick, and a swing low gets a green dot on the tip of the lower wick.
Medium markers are orange rings, a little bigger. Both highs and lows use the same orange, so read the label to tell them apart.
Long markers are the largest rings. A long swing high is a crimson ring, and a long swing low is a dark green ring.
Next to each marker is a small orange text label. Highs are labeled above the bar, lows below it. HH means highest high and LL means lowest low, and the number is the lookback. So HH(9) is a 9-bar swing high, and LL(60) is a 60-bar swing low.
How to read it
A marker goes on a bar when that bar makes the highest high, or lowest low, of its lookback. Then the tool thins them out. Within a run of high markers with no low in between, only the highest one stays. Within a run of lows, only the lowest stays.
So the markers alternate: high, low, high, low. On every chart we studied, you never saw two HH(9) labels in a row. Each pair of markers is one swing.
The newest marker at the right edge of the chart is provisional, meaning it can still change. If price goes on to make a higher high before any low marker appears, the old high marker is removed and the new bar gets it. Only a marker that has been followed by an opposite marker is settled.
That is also why the markers are late. In a strong one-way move there are no markers inside the move at all. The marker appears at the end extreme, and you only know it was the end once price has turned and the opposite marker has printed.
The tool shares its idea with the zigzag indicator, and the same caution applies. Our article Does the ZigZag indicator repaint? explains why the last leg of any swing map can change.
A walk-through: mapping swings on GBPUSD
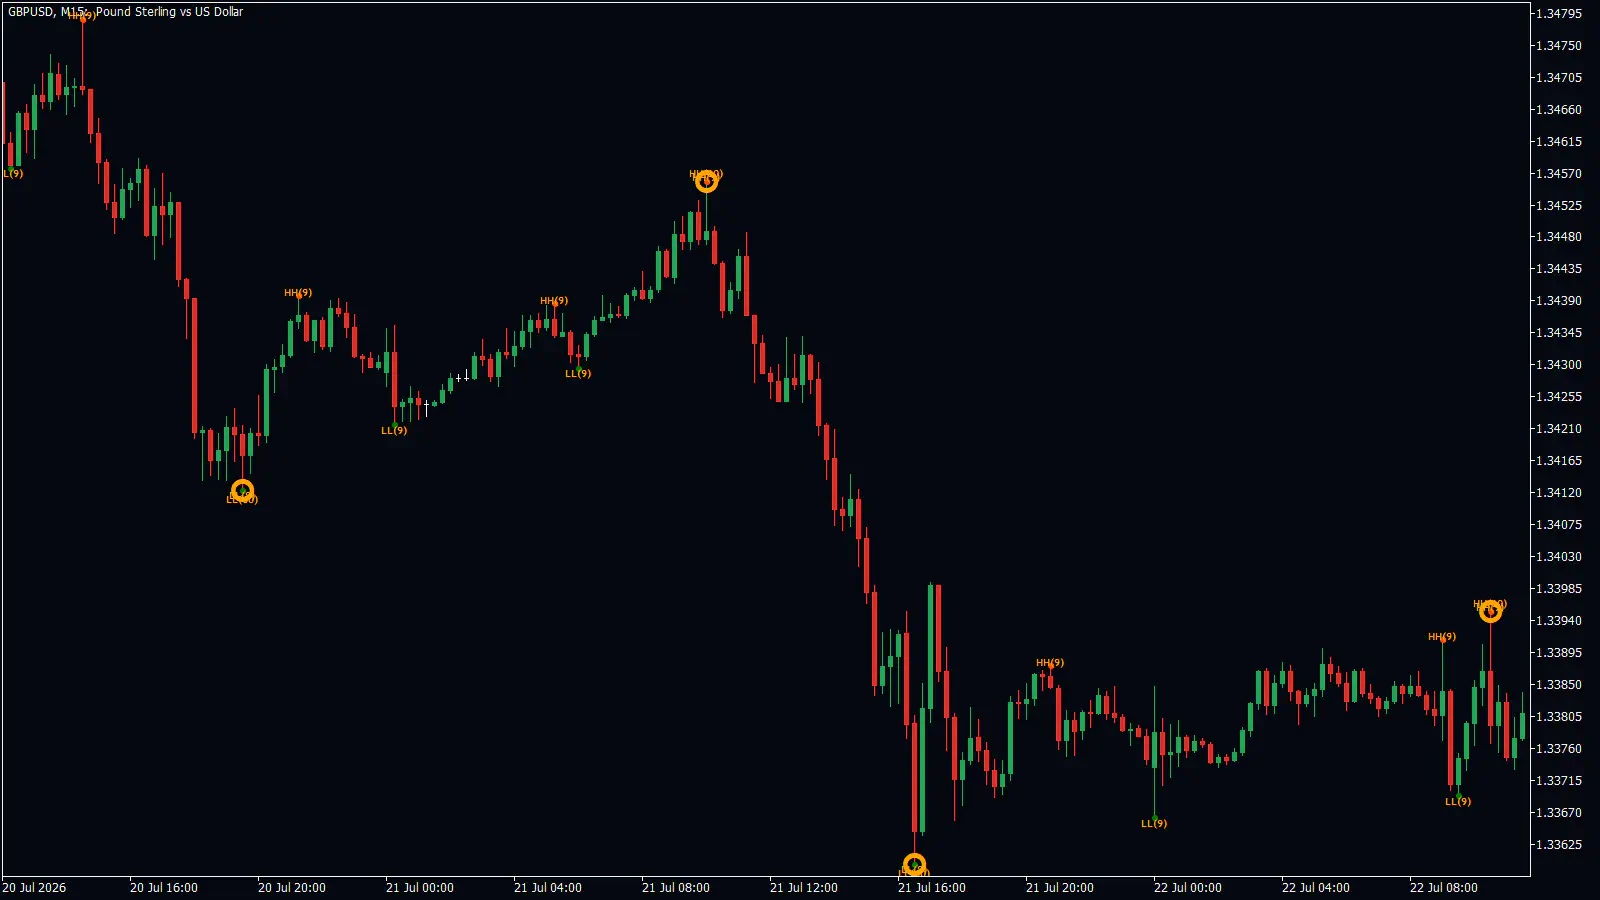
Look at the GBPUSD 15-minute chart above, from 20 to 22 July 2026. Follow only the orange Medium rings.
At about 18:30 on 20 July an LL(60) ring appears at 1.3412. That is the Medium swing low.
Price then rises about 45 pips. At about 09:30 on 21 July an HH(60) ring marks the top at 1.3457. At this point you do not know yet that it is final. Price could still climb higher and move the ring.
It does not. Price falls about 95 pips, and at 16:00 on 21 July an LL(60) ring marks the new low at 1.3362. Now the HH(60) at 1.3457 is settled, because an opposite ring has followed it. You have a lower low under an earlier high: the structure has turned down.
How would you use this map? A trader looking to sell after that drop would put the stop beyond the last opposite ring, above 1.3457, where the structure would clearly be broken. The small HH(9) and LL(9) dots between the rings show the smaller swings you might use for a tighter stop.
At the right edge an HH(60) ring sits near 1.3394. That one is still provisional. Treat it as a marker that may yet move.
This is one chart read after the fact. No tool wins every trade, and losses are part of trading.
How traders use it
The first use is the swing map you just walked through. Consecutive Medium rings marked the main swing legs cleanly on the charts we studied. The last settled ring on the other side of price is a sensible place to anchor a stop.
The second use is reading structure with the Short dots. On a EURUSD 1-hour chart from 15 to 24 July 2026, each HH(9) in the decline was lower than the one before, and each LL(9) was broken lower. A break below the previous LL(9) confirmed the downtrend was continuing, and a stop above the latest HH(9) sat beyond the last small swing. It helps to take those breaks only in the direction the Medium and Long rings are already pointing. For more on this idea, see Break of Structure vs Change of Character.
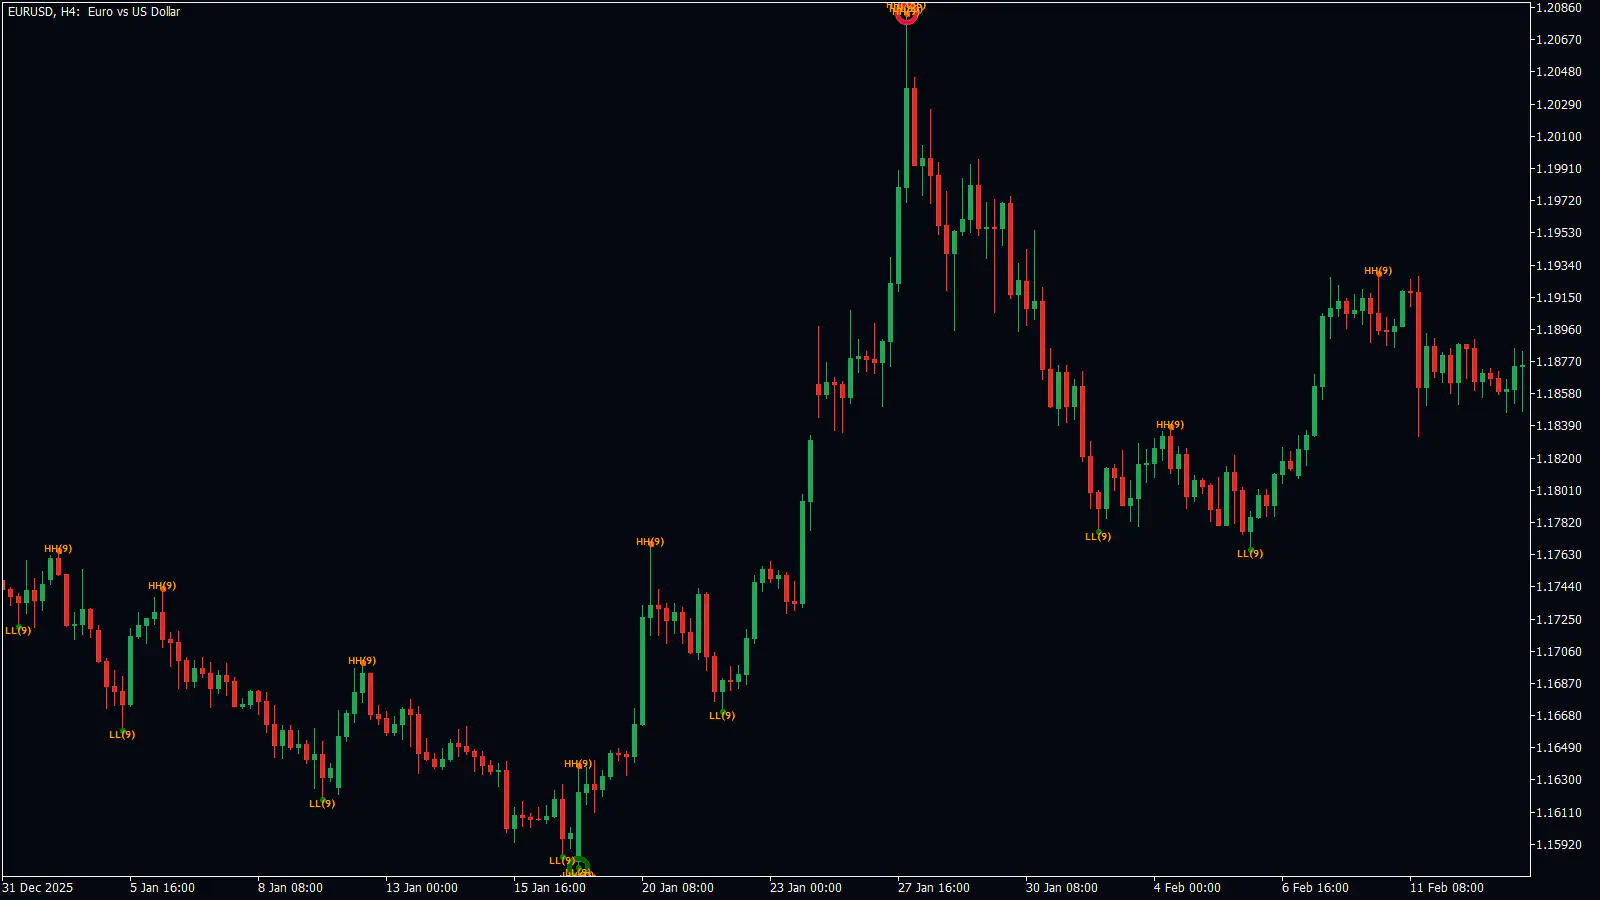
The third use is the Long rings as a marker of the biggest extremes on screen. On a EURUSD 4-hour chart, a dark green Long ring sat at the 16 January 2026 low near 1.1590, and a crimson Long ring at the 27 January top near 1.2080. They are useful for knowing where the big turns were, but they are only confirmed once price has moved well away. The Dynamic Reversals guide on our blog covers more ways to trade around the turns.
Mistakes people make
Waiting for a dot to tell you a reversal is starting. The dot comes at the end, not the start. On the EURUSD 4-hour chart below, after the 22 January low there was no marker at all until the 27 January top, even though price rallied hard in between.
Treating the newest marker as final. The marker at the right edge can still be moved by a higher high or a lower low. Wait for the opposite marker before you treat a swing as settled.
Fading every small dot in a range. In sideways markets on the 4-hour chart, HH(9) and LL(9) pairs appeared 20 to 50 pips apart, one after another. Selling every HH(9) and buying every LL(9) is not what the charts support.
Trying to read a cluttered extreme. At the biggest turns, several tiers can land on the same bar, and their labels pile on top of each other. Markers at the very top or bottom of the window can also be cut off. Scroll or zoom a little, or hide a tier you do not need with its Show setting.
Turning it on and setting it up
- In the RelicusRoad Pro settings, switch on Dynamic Reversal Circles. It is off by default. The settings for it sit under DYNAMIC REVERSAL POINTS.
- Leave Short Period, Medium Period and Long Period at 9, 60 and 156 while you learn to read the markers.
- If the chart feels crowded, switch off the markers you do not use with Show Short High, Show Short Low, Show Medium High, Show Medium Low, Show Long High and Show Long Low. All are on by default.
- Switch off Show Labels if you only want the dots and rings. It is on by default.
- If you want a message when a new marker appears, switch on Show Alerts. It is off by default. Remember that the alerted marker can still be moved later by a new extreme.
| Setting | What it does | When to change it |
|---|---|---|
| Short / Medium / Long Period | Lookback in bars for each tier (default 9 / 60 / 156) | Longer for fewer, bigger swings; shorter for more detail |
| Show Short High … Show Long Low | Shows or hides each of the six markers | To reduce clutter |
| Show Labels | The HH(n) / LL(n) text (default on) | Off for a cleaner chart |
| Short / Medium / Long High and Low Color | Marker colors | If a marker is hard to see |
| Short / Medium / Long Low and High Size | Marker size (defaults 2, 4, 5) | To make a tier stand out |
| Show Alerts | A message when a tier gets a new marker (default off) | When you want to be told about new swings |
- What it does
- Lookback in bars for each tier (default 9 / 60 / 156)
- When to change it
- Longer for fewer, bigger swings; shorter for more detail
- What it does
- Shows or hides each of the six markers
- When to change it
- To reduce clutter
- What it does
- The HH(n) / LL(n) text (default on)
- When to change it
- Off for a cleaner chart
- What it does
- Marker colors
- When to change it
- If a marker is hard to see
- What it does
- Marker size (defaults 2, 4, 5)
- When to change it
- To make a tier stand out
- What it does
- A message when a tier gets a new marker (default off)
- When to change it
- When you want to be told about new swings
Tip: Start with only the Medium tier visible. Once the main swings make sense, turn the Short dots back on for detail.
Questions people ask
What do HH(9), LL(60) and the other labels mean? HH is highest high, LL is lowest low, and the number is the lookback in bars. HH(9) marks the highest high of the last 9 bars.
Do the dots warn me before a reversal? No. They mark prices that have already printed, and inside a strong move there are none at all. You only know a swing is over once the opposite marker appears.
Can a dot move or disappear? The newest one can. A higher high replaces the previous high marker, and a lower low replaces the previous low marker. A marker followed by an opposite marker is settled.
Which of the three sizes should I watch? On our sample charts, the Medium rings gave the cleanest map of the main swings. The 9-bar dots are good for detail but noisy in ranges.
Can I get an alert when a new dot appears? Yes, switch on Show Alerts. After an alert, that tier stays quiet until five new bars have passed without a new marker.
Remember: Markers show swings that have already happened, never swings to come. The newest one can still move, so wait for the opposite marker. Use the settled rings to place stops beyond the last real turn.
With the swings mapped, you are ready for a tool that follows the trend between them; the next chapter, Super Trend, draws one line that trails price in a trend, after the levels you met in Scalp Pivots.



