
You are in a trade that is going your way, and now you face the hard question. Where do you put your stop so a normal wobble does not throw you out, but a real turn does?
The Super Trend answers that with a single line. It sits under price while the market climbs and above price while it falls, and it moves only toward price, never away. When a bar finally closes on the wrong side of it, the line flips over and the trend has changed.
That makes it two tools in one: a simple reading of the trend’s direction, and a trailing stop, meaning a stop loss that follows price as the trade moves in your favor. It is strong in clean trends and weak in sideways markets, and this chapter shows you both sides.
What you see on your chart
The Super Trend draws one line at a time, never two.
In an uptrend you see a dark green line under the candles. In a downtrend you see a gold line above them. Both are thin, solid lines.
The line looks like a staircase. While price runs away from it, the line stays flat. When price has moved far enough, the line takes a step toward price. It never steps back.
When the trend flips, the old line simply stops and the new one starts on the other side of price. There is a gap between them, and no arrow or marker at the flip. The new line often starts with a steep slope for one or two bars before it settles into its flat steps.
How the line is built
You do not need the math to use it, but knowing the idea helps you trust it.
For every bar, the indicator takes the middle of the bar, halfway between its high and low. It then measures ATR, the average true range, that is, how far price typically moves in one bar. It places one band above the middle and one below, each Multiplier times the ATR away. With the defaults, that is 3 times a 10-bar ATR.
So the line is further from price when the market is moving a lot, and closer when it is quiet. That is how it adapts to volatility without you changing anything.
How to read it
Green under price means the trend is up. Gold above price means the trend is down. That is the whole color code.
A flip happens only when a bar closes beyond the line. A candle that pokes through with its wick and closes back on the right side does not count. The trend stays as it was until a close breaks it.
The line calculates once per bar, when a new bar opens. It does not jump around with every tick inside a bar.
What the line does not do is predict. It reacts to moves that have already happened. So a flip tells you the trend has changed, not that a big move is coming.
A walk-through: EURUSD in January 2026
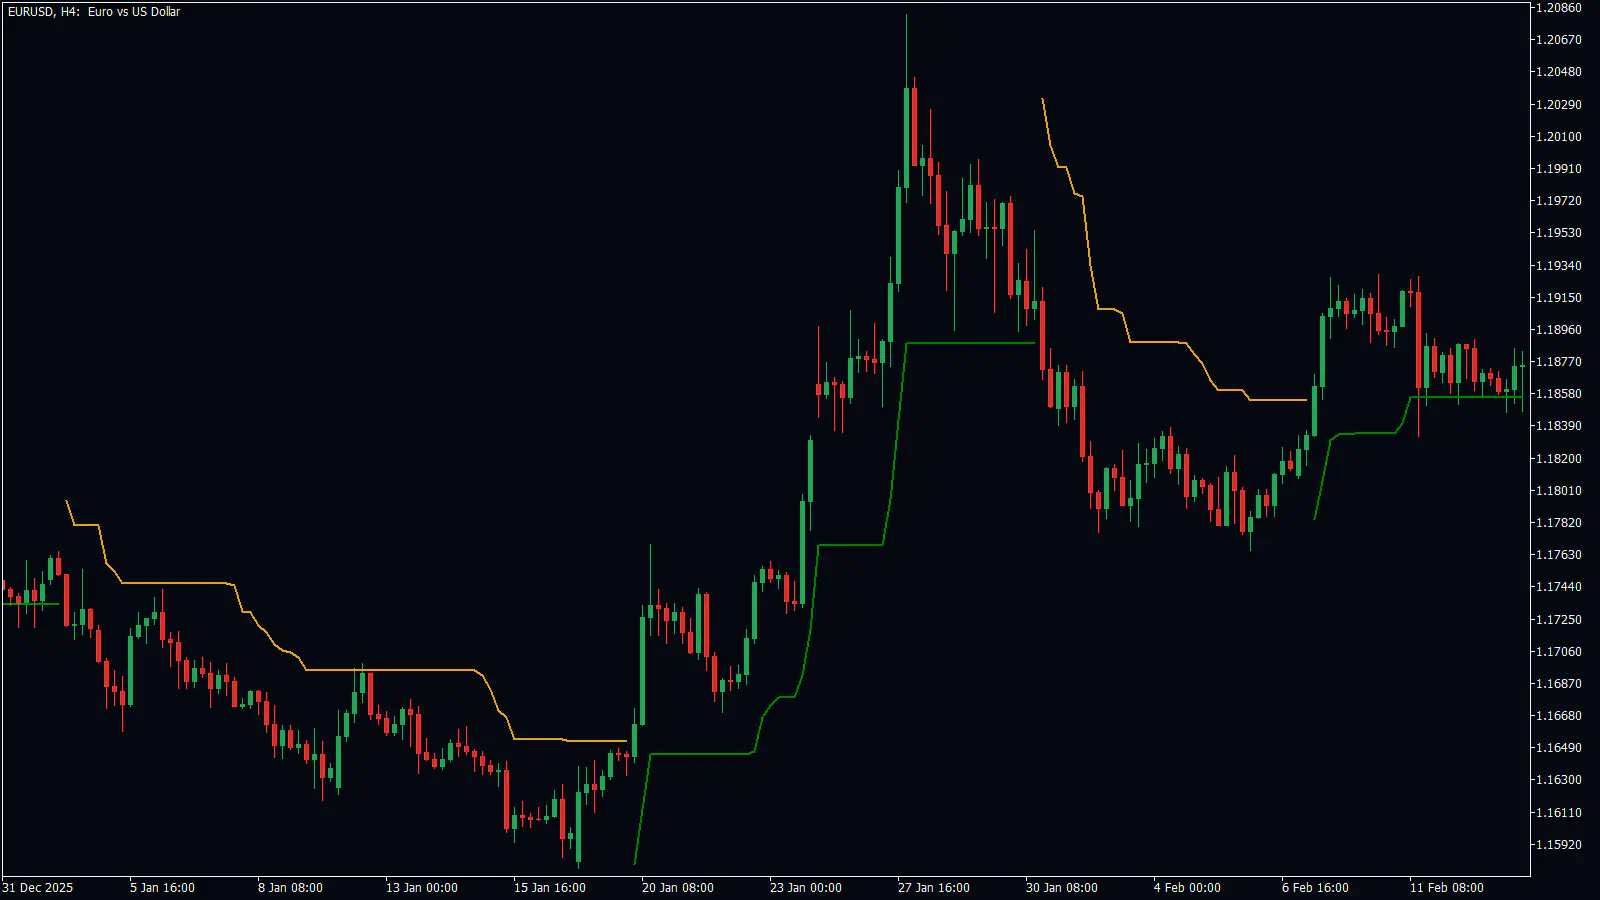
Look at the 4-hour chart above.
From 1 January the line is gold, stepping down from about 1.1790 to 1.1655 while price falls to about 1.1590. As long as it stays gold, the chart is saying “downtrend”, and a buyer waits.
At about 16:00 on 19 January a bar closes above the gold line, near 1.1650. The line flips to green under price. This is where a trend follower could buy, with the stop at the green line.
Now you let the line do the work. As the rally runs, the green line steps up from about 1.1650 to 1.1770, then to 1.1880. Price peaks near 1.2080 on 27 January.
Then price pulls back. From 27 to 30 January the green line stays flat at about 1.1880 while price drifts down toward it. The line does not flip, because no bar has closed below it yet. So you hold.
At about 04:00 on 30 January a bar closes below the line, and it flips to gold near 1.1860. That is the exit. On this chart, the trade from the flip at about 1.1650 to the exit at about 1.1860 covered roughly 210 pips. But notice the cost: price had been as high as 1.2080, so about 220 pips of the move were given back before the exit.
This is one chart, told after the fact. The same approach will lose on other charts. No tool wins every trade, and losses are a normal part of trading.
How traders use it
The most common use is the one you just saw: enter on a flip, trail the stop along the line, and exit on the opposite flip. The same pattern showed up on a GBPUSD 1-hour chart in June 2026, where a gold flip on 5 June near 1.3430 was followed by a green flip on 9 June near 1.3350, about 80 pips lower.
The second use is patience. When the line is flat and price is still on its side, you do nothing. A pullback toward a flat line is not an exit until a bar closes through it.
You can also try using the Super Trend as a filter for other signals, taking only buys while the line is green and only sells while it is gold. We have not tested that on real charts for this manual, so try it on a demo account first. The Super Trend guide on our blog goes deeper into trading flips, and Strategy 7 pairs the Super Trend line with reversal signals.
Mistakes people make
Following every flip in a sideways market. This is the big one. On a EURUSD 1-hour chart from 1 to 10 July 2026, the line flipped 7 times in about 9.5 days inside one range. On a GBPUSD 15-minute chart from 13 to 15 July 2026, it flipped 7 times in about 2 days. Many of those flips turned back within a few bars, each one a small loss.
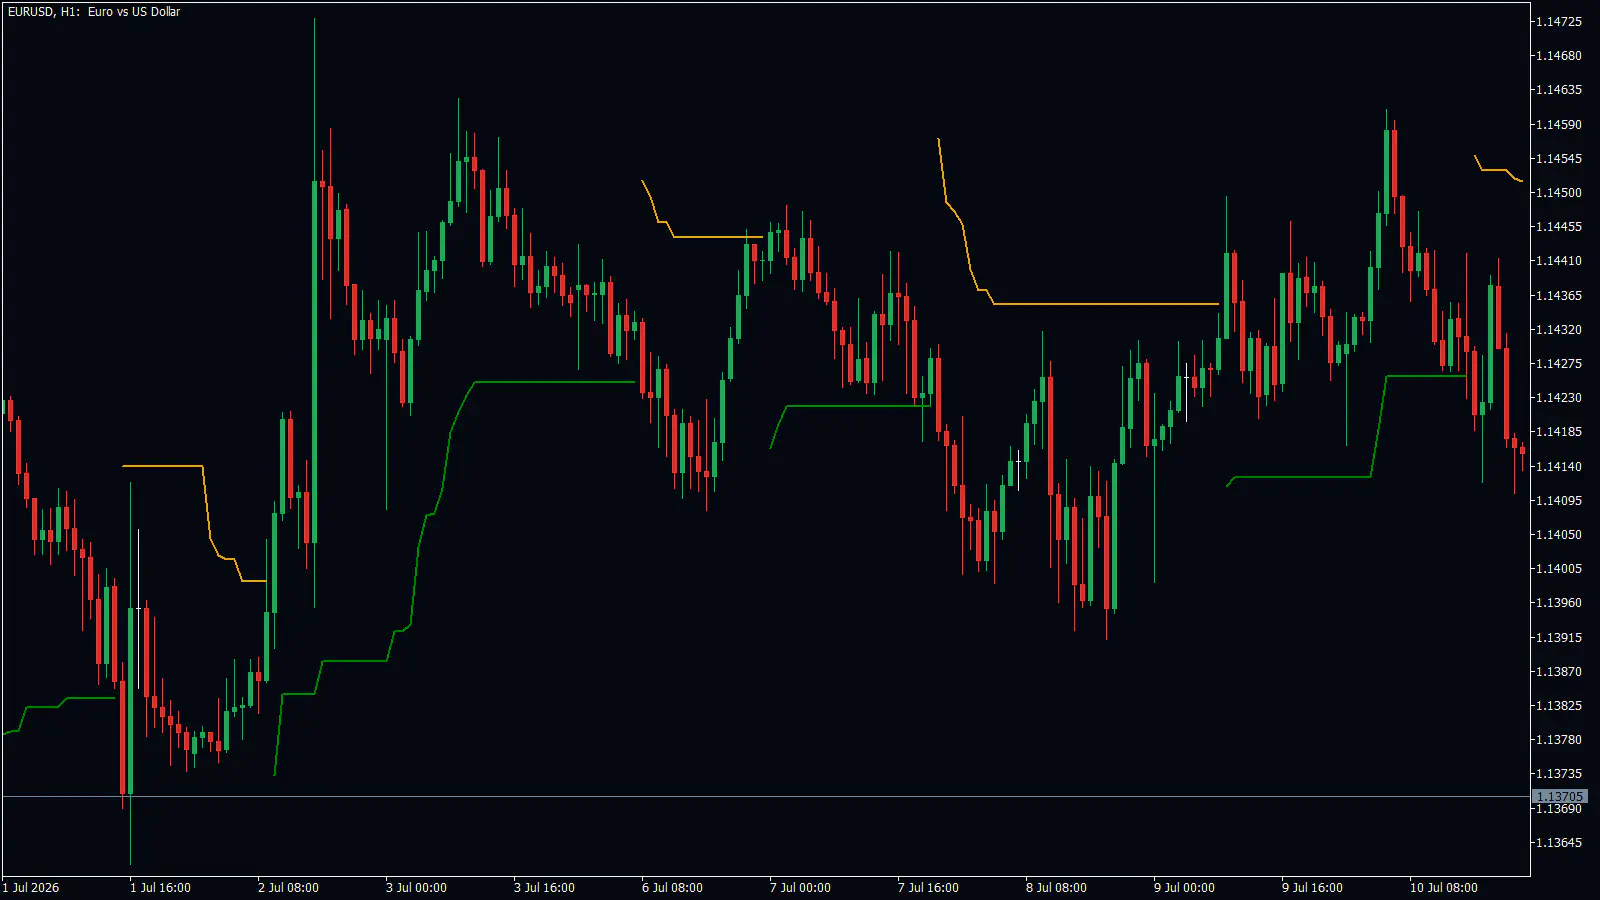
You can try two filters. Skip a flip when the segment before it lasted only a few bars. Or take a flip only when the line on the 4-hour chart points the same way.
Forgetting that one big candle can flip it. On a GBPUSD 4-hour chart, the line flipped to gold on 13 July 2026 near 1.3355. Then one large bullish candle on 15 July flipped it straight back to green, near 1.3530. A trader who sold the gold flip and kept the stop at the line was stopped out about 175 pips away, on a single bar.
Expecting to exit near the top. The exit comes only after price has turned and closed through the line. On the EURUSD walk-through that meant giving back about 220 pips from the high. That is the price of letting the trend run.
Ignoring how wide the first stop is. Right after a strong candle, the line can sit far from price. On the EURUSD 4-hour chart, the green line was about 180 pips below the high on 27 January. Trade a smaller size when the stop is that wide, or take the entry on a lower timeframe. Our ATR guide explains how to size stops to volatility.
Turning it on and setting it up
- Open the RelicusRoad Pro settings and switch on SuperTrend (Trend Trading). It is off by default.
- Leave ATR Period at 10 and Multiplier at 3.0 to start. Get to know the line before you change it.
- If you want a message on each flip, switch on Show Alerts. It is off by default. Delivery by popup, email, mobile or sound follows your shared alerts settings.
- Change the colors or thickness only if the line is hard to see on your chart.
| Setting | What it does | When to change it |
|---|---|---|
| ATR Period | How many bars the ATR averages (default 10) | Longer for a steadier volatility reading |
| Multiplier | How many ATRs the bands sit from the bar’s middle (default 3.0) | Larger puts the line further from price, so it takes a bigger move to flip it |
| Show Alerts | Sends SuperTrend -> Uptrend / -> Downtrend messages (default off) | When you want to be told about flips |
| Up Color / Down Color | Line colors (default green / goldenrod) | If the line is hard to see |
| Up Width / Down Width | Line thickness (default 2) | For a bolder line |
| History | How many recent bars are calculated (default 3000) | Rarely needed |
- What it does
- How many bars the ATR averages (default 10)
- When to change it
- Longer for a steadier volatility reading
- What it does
- How many ATRs the bands sit from the bar’s middle (default 3.0)
- When to change it
- Larger puts the line further from price, so it takes a bigger move to flip it
- What it does
- Sends SuperTrend -> Uptrend / -> Downtrend messages (default off)
- When to change it
- When you want to be told about flips
- What it does
- Line colors (default green / goldenrod)
- When to change it
- If the line is hard to see
- What it does
- Line thickness (default 2)
- When to change it
- For a bolder line
- What it does
- How many recent bars are calculated (default 3000)
- When to change it
- Rarely needed
Tip: When you test a new Multiplier, compare it on a trending stretch and a sideways stretch. A setting that looks great in one often looks poor in the other.
Questions people ask
What do the green and gold lines mean? Green under price means the Super Trend is in an uptrend. Gold above price means it is in a downtrend. Only one is on the chart at a time.
What makes it flip? A bar has to close beyond the line. A wick through the line is not enough.
Why does the line only move one way? In an uptrend the green line can only rise or stay flat; in a downtrend the gold line can only fall or stay flat. That is what makes it work as a trailing stop.
Does it work in sideways markets? Not well. In our sample charts it flipped 7 times in about 9.5 days on a EURUSD 1-hour range, and 7 times in about 2 days on GBPUSD 15-minute.
Is there an alert when it flips? Yes. Switch on Show Alerts, and you get a message at the open of the first bar in the new trend.
Remember: Green under price is an uptrend, gold above price is a downtrend, and only a close through the line flips it. Trail your stop with the line in a trend. In a sideways market, expect flip after flip and stand aside.
The Super Trend follows a trend once it has formed, just as Dynamic Reversals mapped the swings behind it; the next chapter, Fractal Arrows, marks those swing highs and lows with arrows.



