
What It Does
Two prices set the tone for most intraday sessions: where yesterday stopped going up, and where it stopped going down. A third, today’s opening price, tells you whether the session is up or down while it happens.
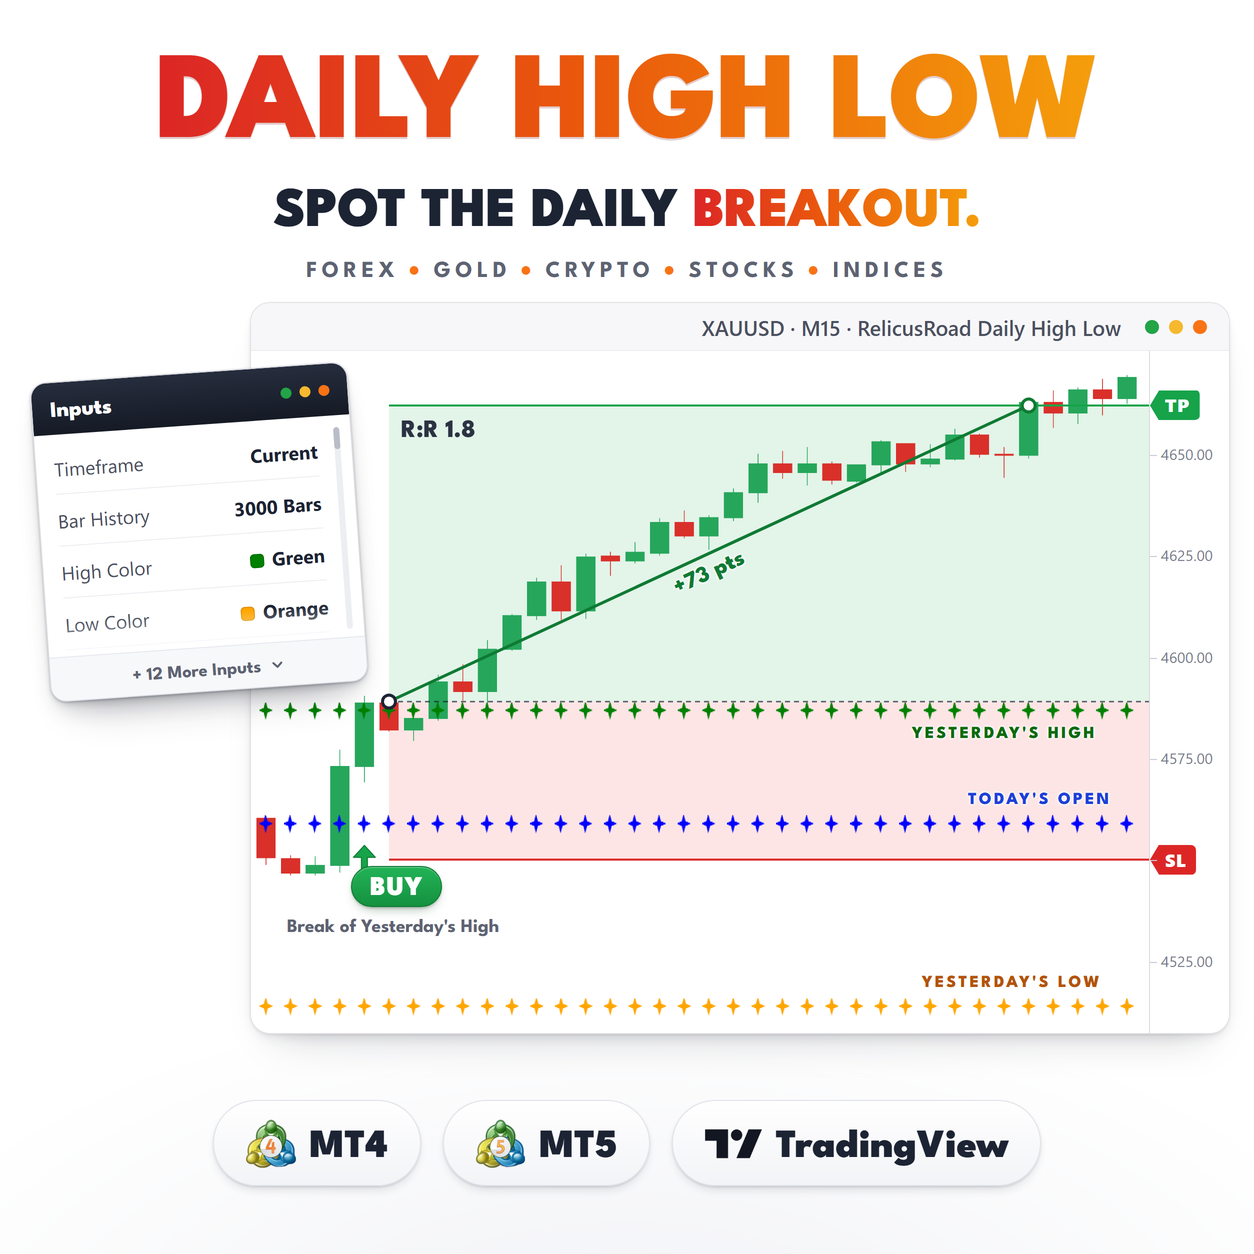
RelicusRoad Daily High Low keeps all three in front of you. It carries yesterday’s high and yesterday’s low across every bar of your chart as colored dot series, and adds today’s open as a third series. At the server’s day change all three step to their new values at once.
It adds nothing else. No zones, no projections, no panel, and no arrows telling you what to do with
the levels.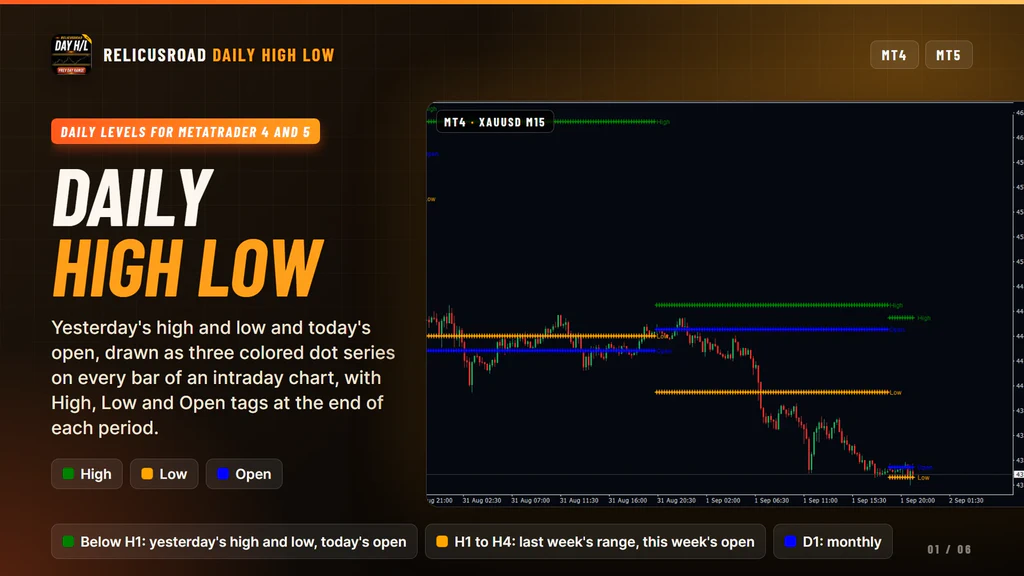
How It Works
Every bar on your chart belongs to a reference period. The indicator finds that period first, then fills three values for the bar:
- High. The high of the period before this one.
- Low. The low of the period before this one.
- Open. The opening price of the period this bar sits in.
Which period counts depends on the chart, unless you choose one in the Timeframe input:
| Chart timeframe | Reference period |
|---|---|
| Below H1 | Daily: yesterday’s high and low, today’s open |
| H1 to H4 | Weekly: last week’s high and low, this week’s open |
| D1 | Monthly: last month’s high and low, this month’s open |
| W1 and MN1 | Nothing is drawn |
- Below H1
- Daily: yesterday’s high and low, today’s open
- H1 to H4
- Weekly: last week’s high and low, this week’s open
- D1
- Monthly: last month’s high and low, this month’s open
- W1 and MN1
- Nothing is drawn
Period boundaries follow your broker’s server time, the same clock that builds the platform’s daily,
weekly and monthly candles. There is no time zone offset to set, and no way for your levels to drift
away from the candles they came from. The values are recalculated when a new bar opens rather than on
every tick.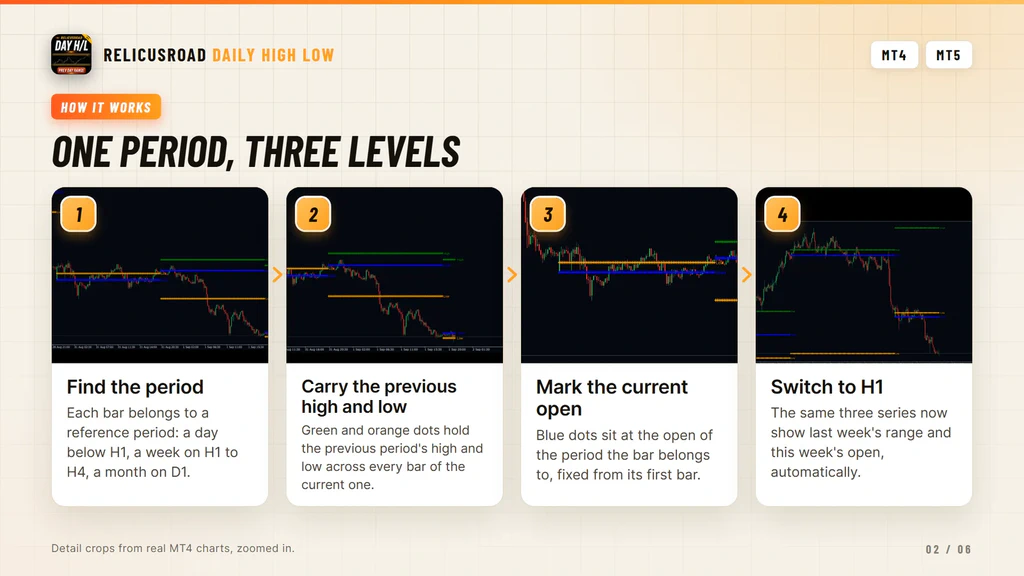
The Two Things People Misread
First, the Open is today’s, not yesterday’s. It is easy to assume that a tool called Daily High Low shows three numbers from the same day. The high and the low come from the finished period, and the open comes from the live one, which is what makes the blue series useful: price above it means the session is up so far, price below it means the opposite.
Second, an H1 chart shows weekly levels by default. If you open an hourly chart expecting yesterday’s range and see prices that do not match yesterday’s candle at all, that is why. Set Timeframe to D1 and the daily levels come back. It catches most new users once.
Everything else behaves the way you would expect. The dots stay flat through the period, they step at
the boundary, and each finished period keeps its own tags so you can read back through the week.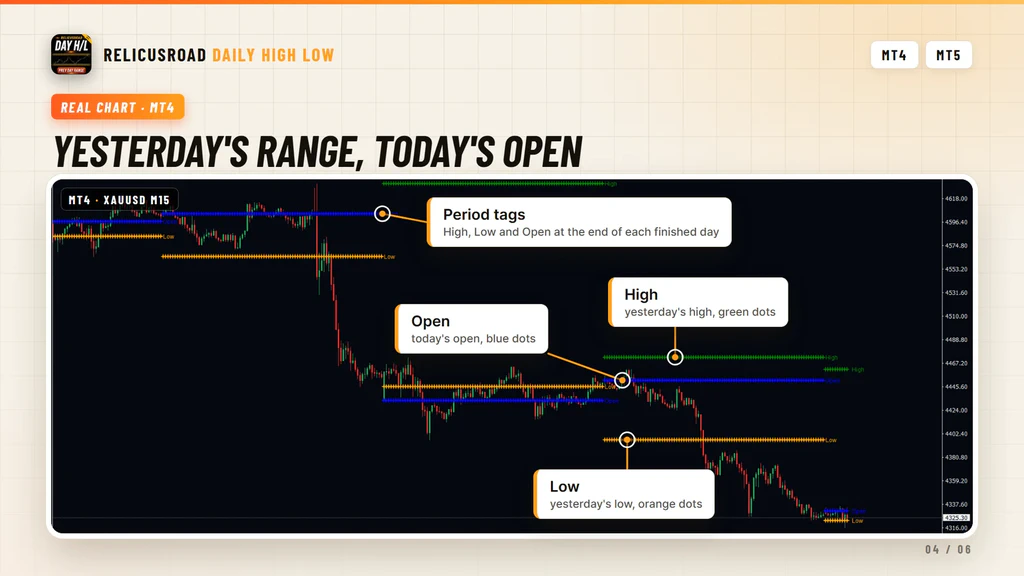
What You See On The Chart
| Element | Meaning |
|---|---|
| Green dot series | The previous period’s high, held flat across the current period |
| Orange dot series | The previous period’s low |
| Blue dot series | The open of the current period, fixed from its first bar |
| Period tags | The words High, Low and Open in matching colors at the end of each finished period |
| Live tags | The same three words, two bars to the right of the newest bar |
| Three buffers | DHLO High, DHLO Low and DHLO Open, one value per bar, readable by an Expert Advisor |
- Green dot series
- The previous period’s high, held flat across the current period
- Orange dot series
- The previous period’s low
- Blue dot series
- The open of the current period, fixed from its first bar
- Period tags
- The words High, Low and Open in matching colors at the end of each finished period
- Live tags
- The same three words, two bars to the right of the newest bar
- Three buffers
- DHLO High, DHLO Low and DHLO Open, one value per bar, readable by an Expert Advisor
Nothing is projected into empty space to the right of price. Only the small tags sit ahead of the live
bar, which keeps the chart clean when you are zoomed out over several days.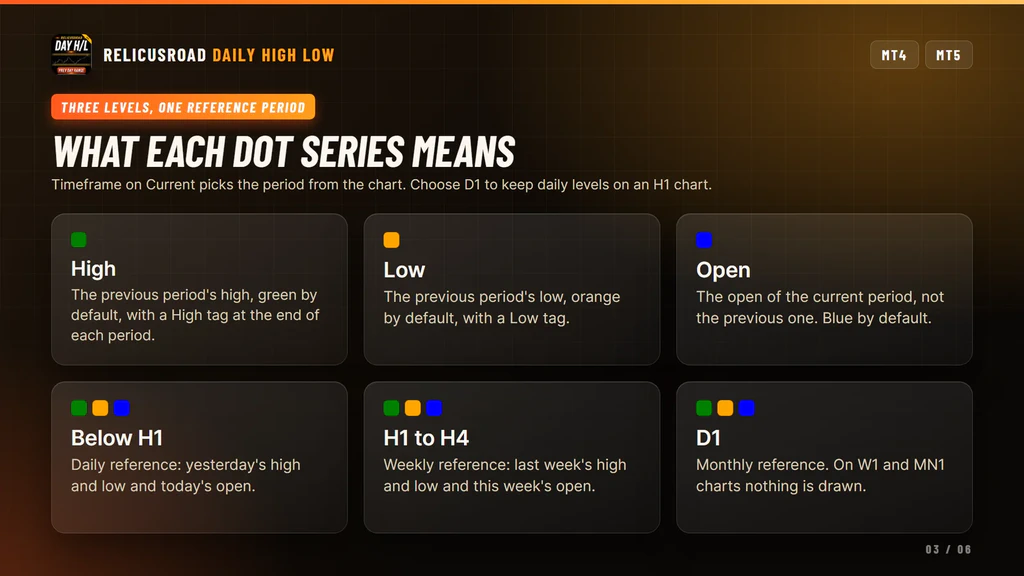
What It Does For Your Trading
Four things, each one visible on the chart the moment you attach it.
Yesterday In Three Prices
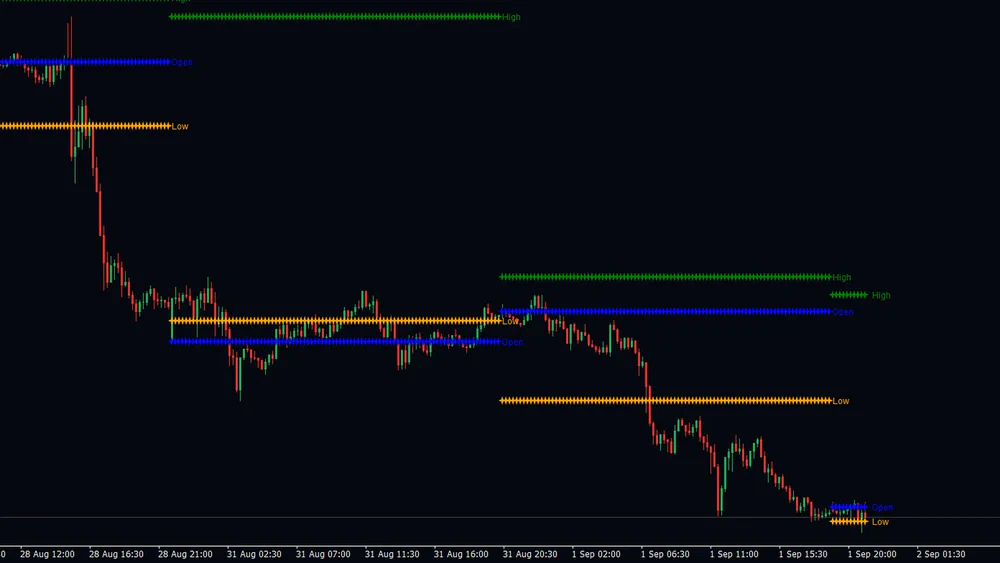
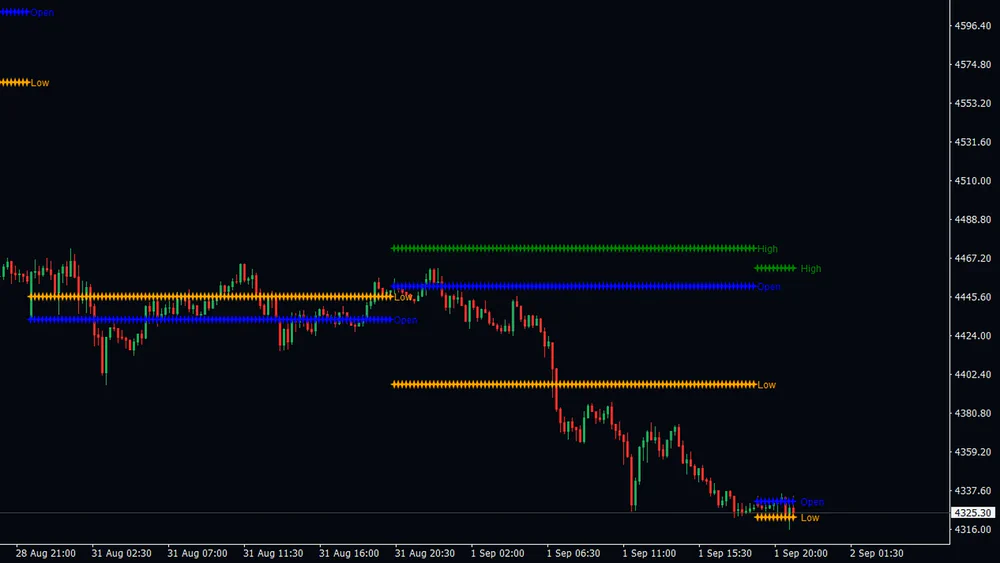
Each day carries a green row at the previous high, an orange row at the previous low and a blue row at the day’s opening price, flat from the first bar of the session to the last, with a tag on the right of each one.
Three numbers you would otherwise scroll back for, on every bar you look at, on every symbol you open.
Steps Once, At The Day Change
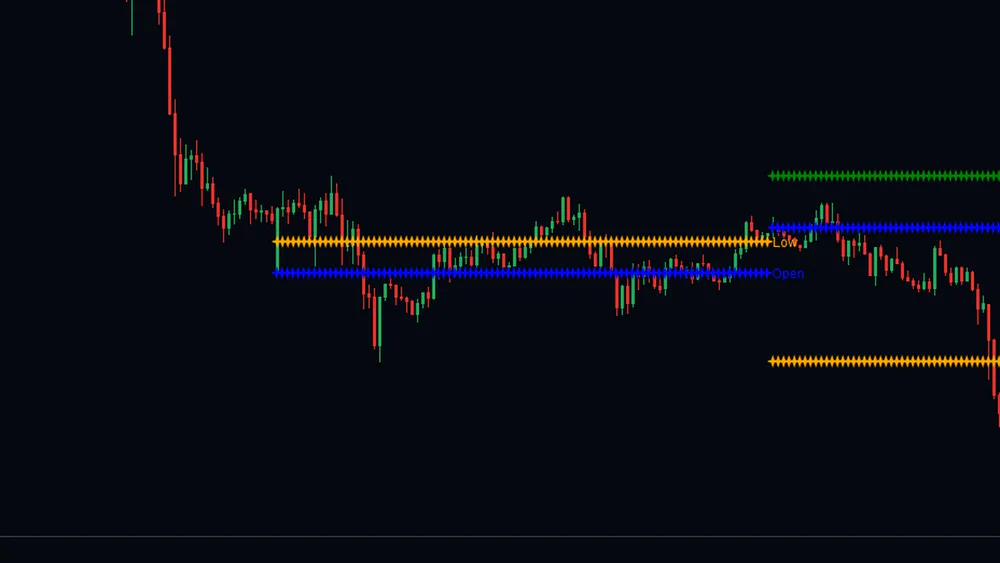
At the server’s day change all three rows step to their new values together and the finished day keeps its tags where it ended. The levels never drift during the session.
You can scroll back through the week and read each day against its own reference, which is what makes a screenshot from Tuesday still useful on Friday.
Shows The Session Up Or Down
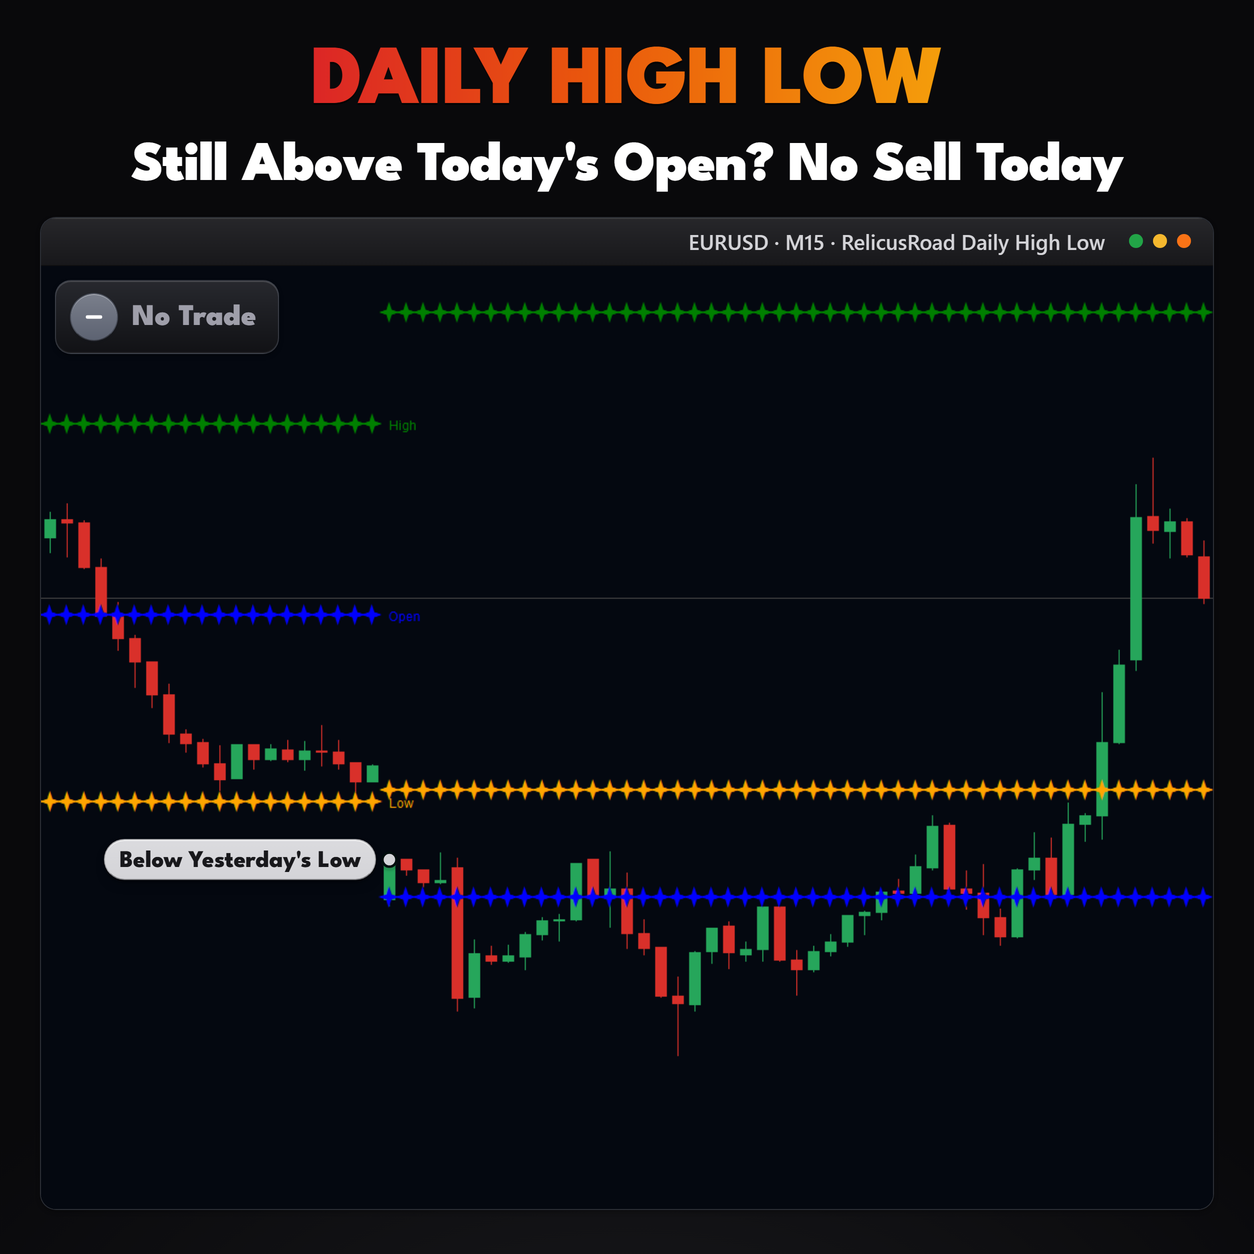
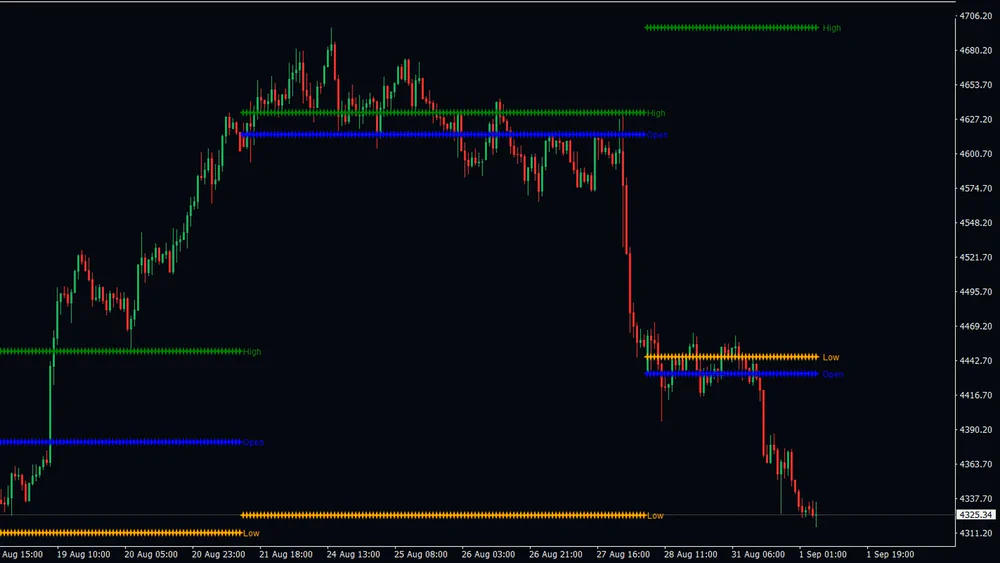
The blue row is the open of the session in progress, fixed from its first bar. Price above it means the day is up so far, price below it means the day is down, and the distance is the move.
It answers the first question of any intraday trade without a second window, a calculator or a glance at the daily chart.
Weekly Context On An Hourly Chart
Move to H1 and the reference period changes with the chart. The same three rows now hold last week’s high and low and this week’s open, and on a daily chart they hold the monthly equivalents.
Worth knowing before it surprises you. An H1 chart is not showing you yesterday. If you want daily levels there, set Timeframe to D1 and they come straight back.
Reading It On A Live Chart
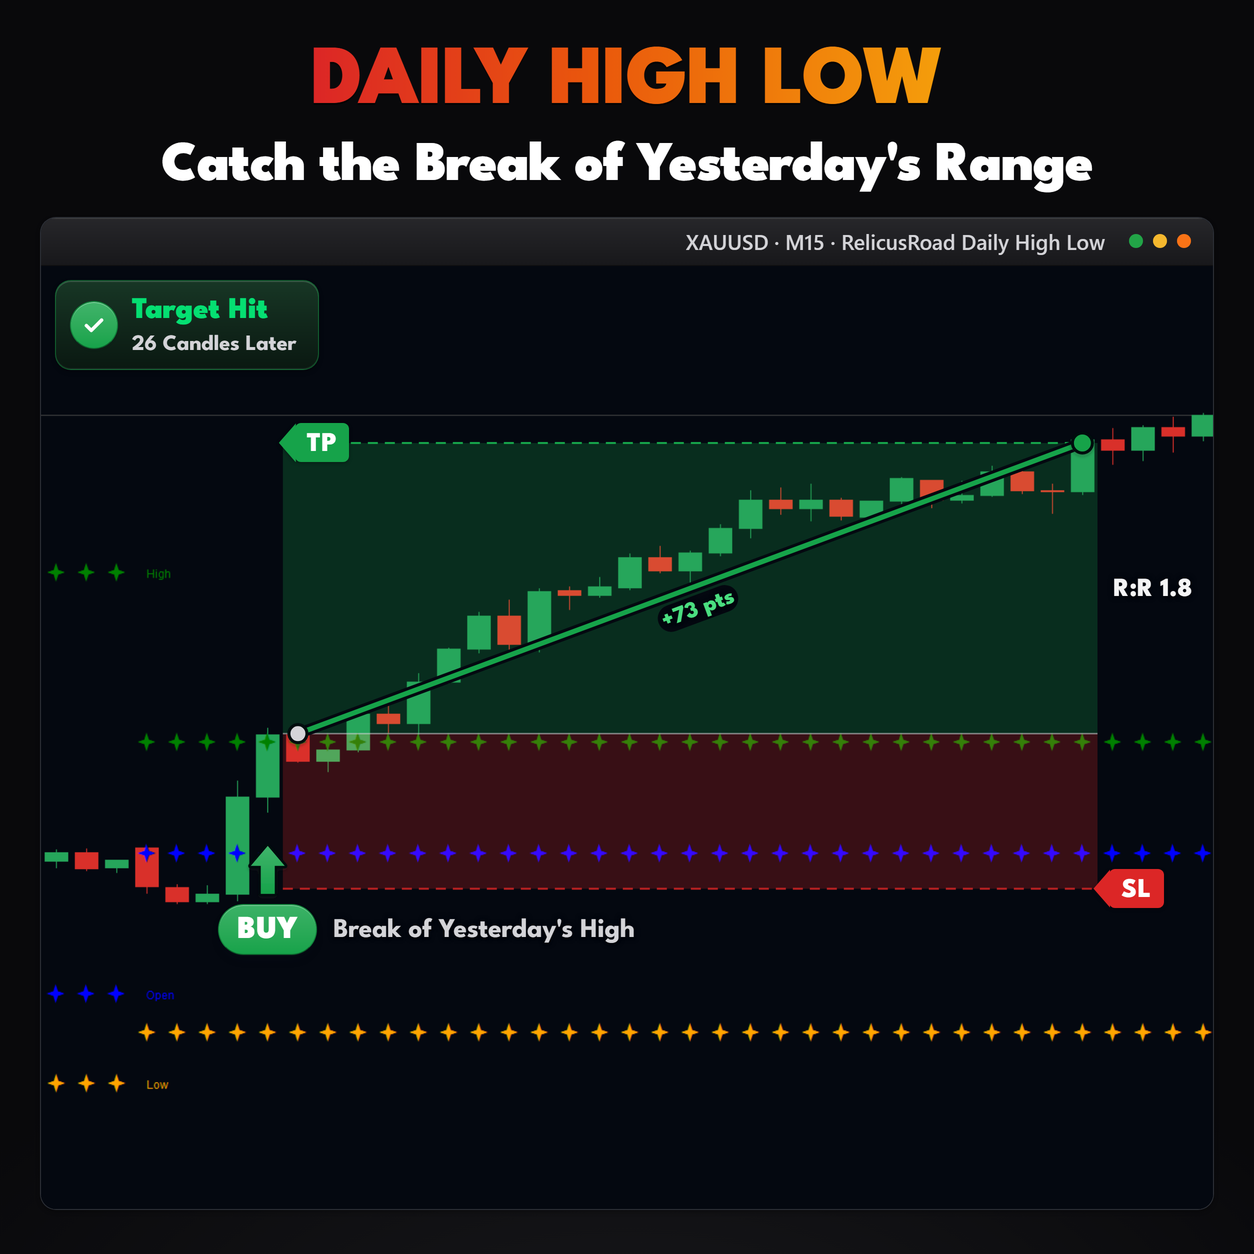
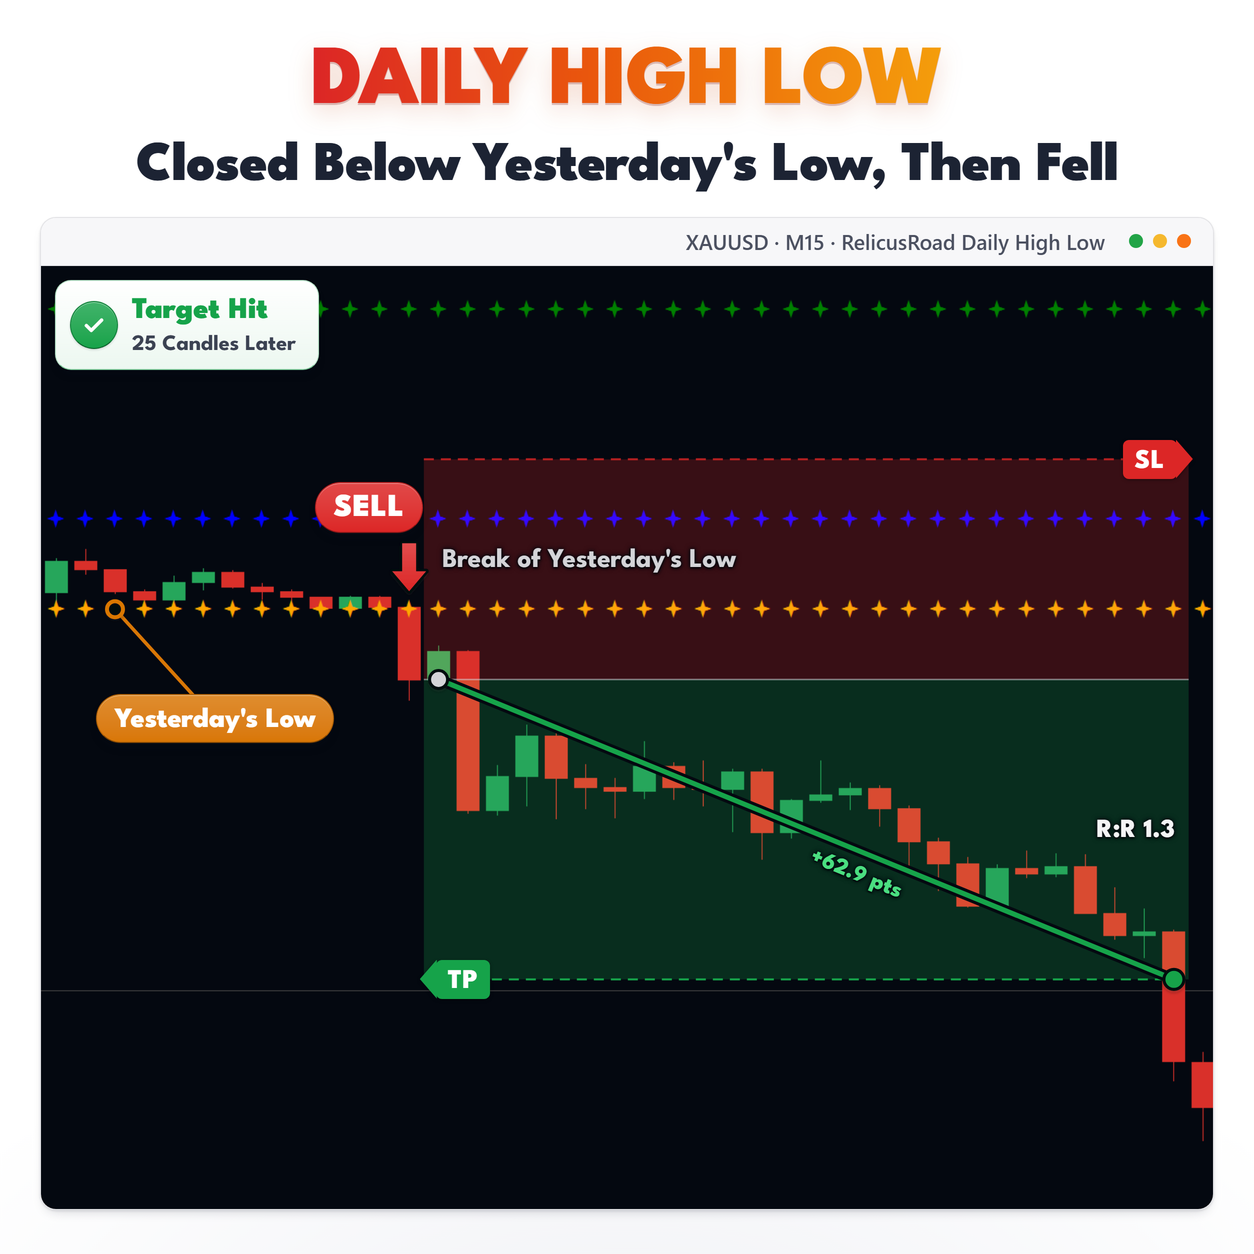
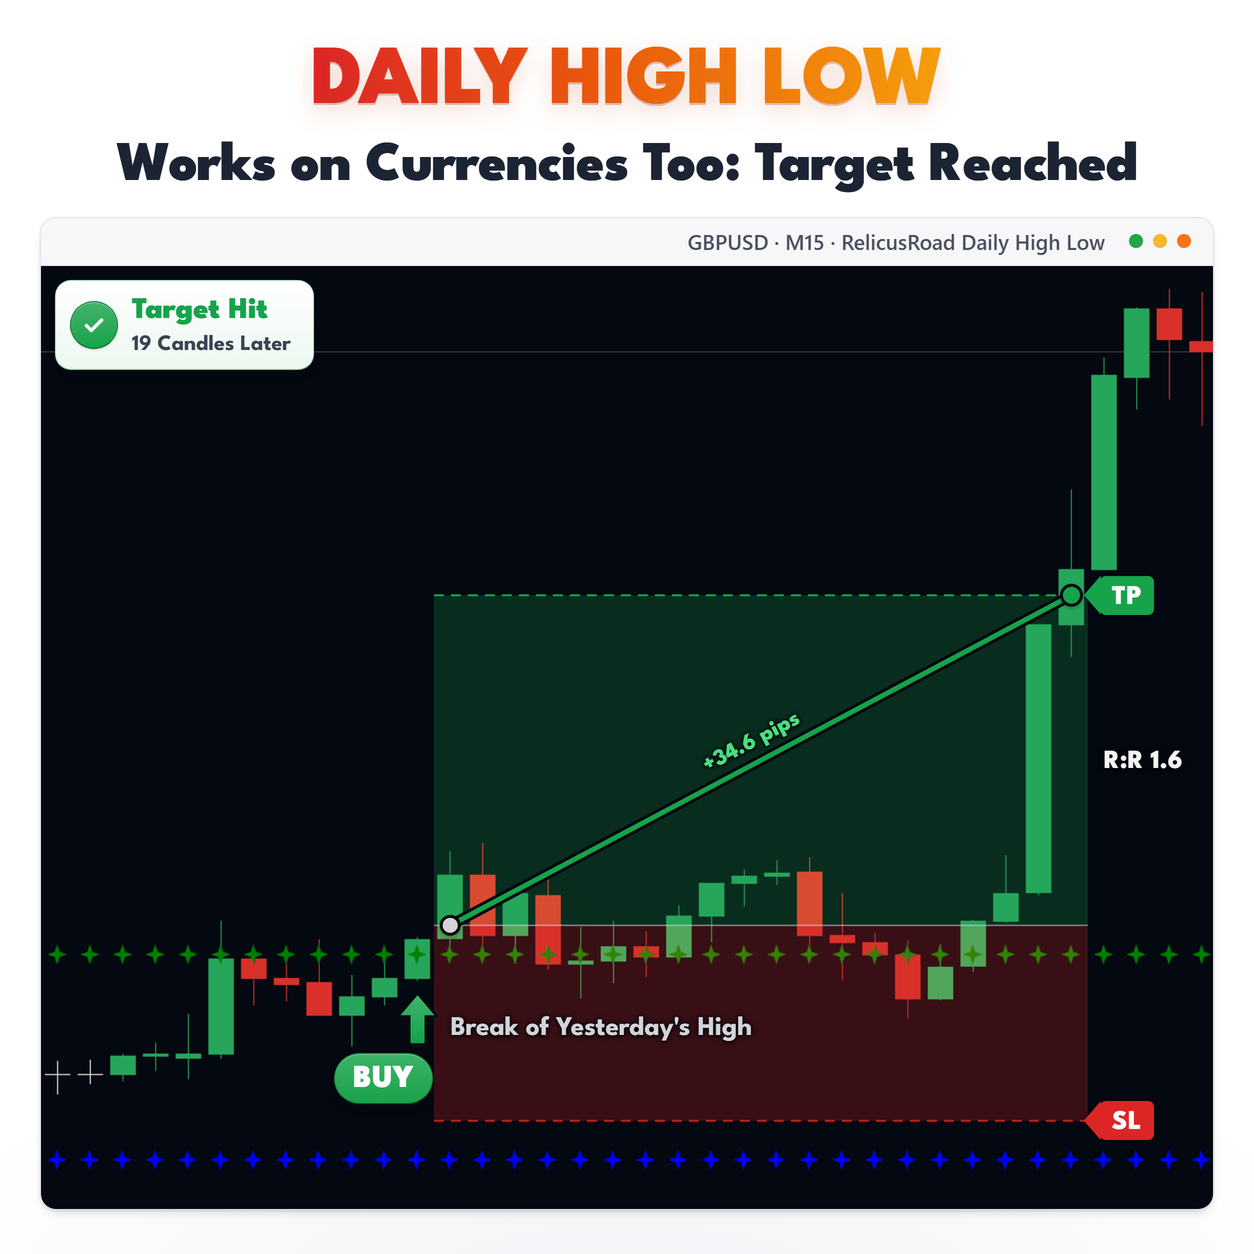
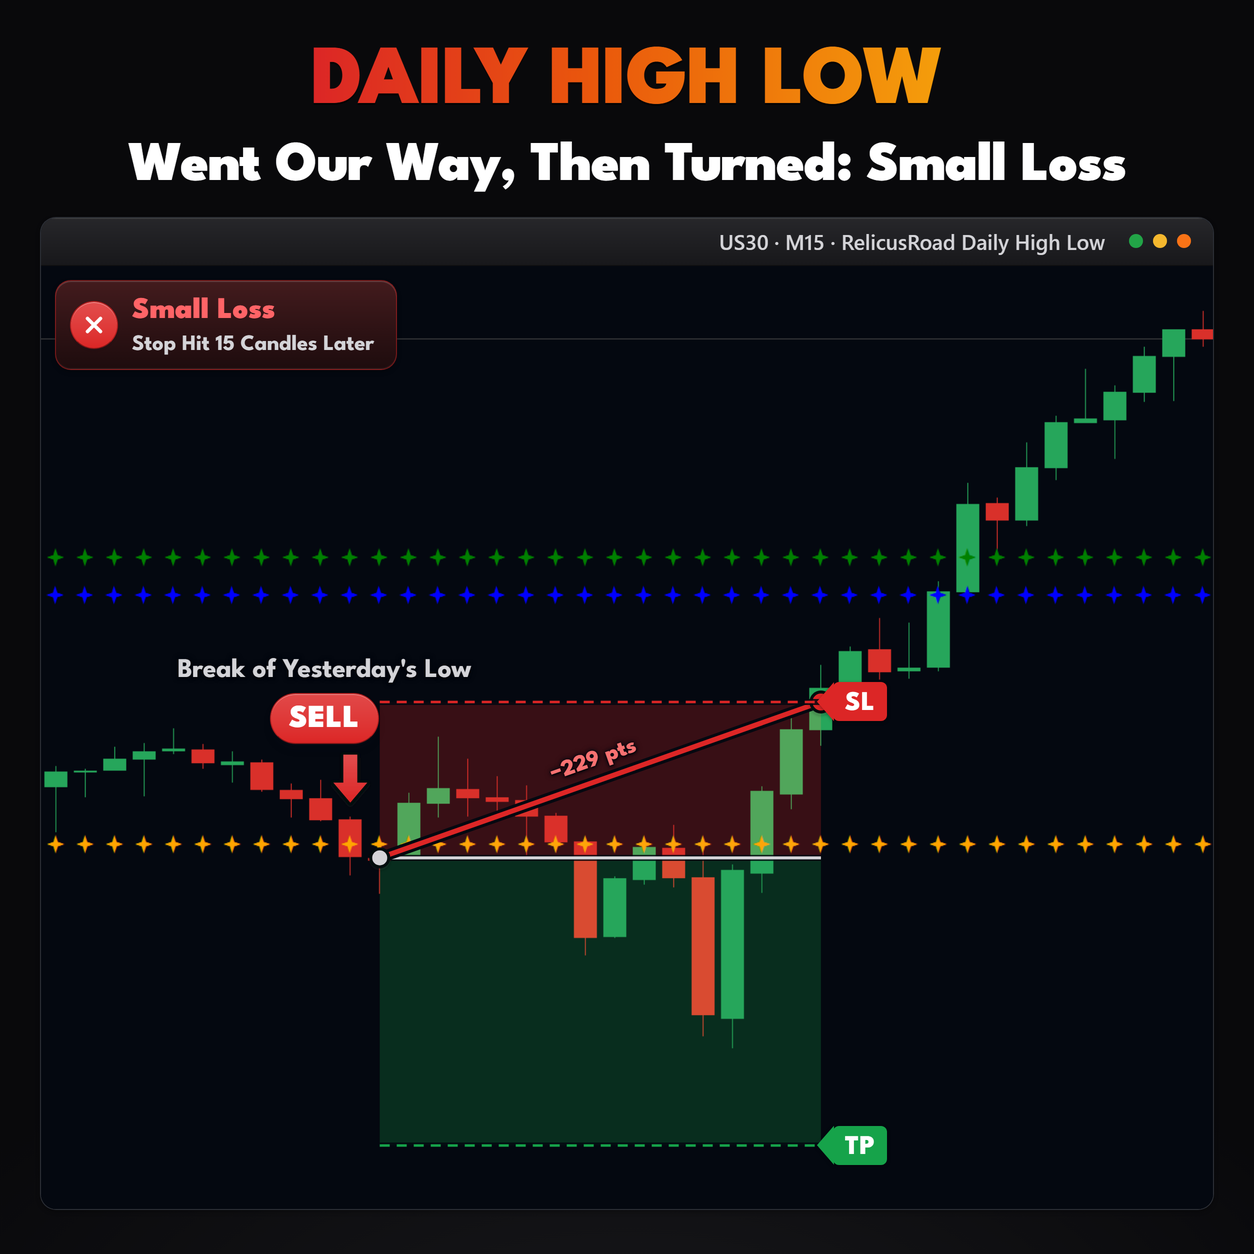
Inside a single day on an M15 chart, the green and orange rows are flat. Price between them is still inside yesterday’s range, and that is worth knowing before you call a move a breakout. Price closing outside one of them has left the range the previous session built.
The blue row answers a different question. Distance from it is the session’s move so far, and the side price sits on is the session’s direction. Traders who fade extended moves and traders who follow them both use that one line, in opposite ways.
Read back across the chart and each finished day keeps its tags at its right edge, so a week of
sessions stays legible without switching timeframes.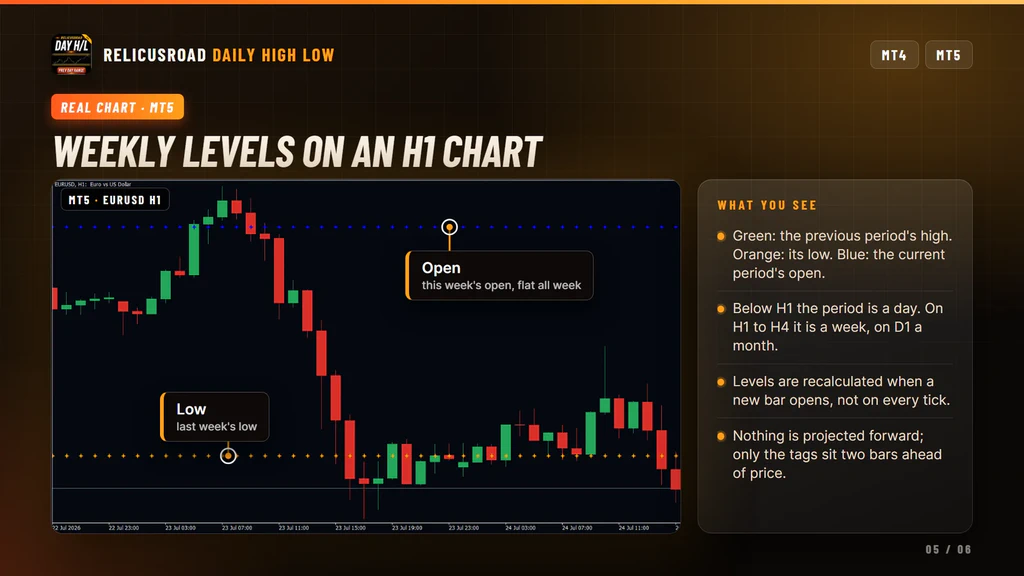
Settings You Can Change
Calculation. Timeframe sets the reference period, with Current choosing daily, weekly or monthly from the chart as described above. Bar History is how many chart bars are calculated, 3000 by default and 5000 at most.
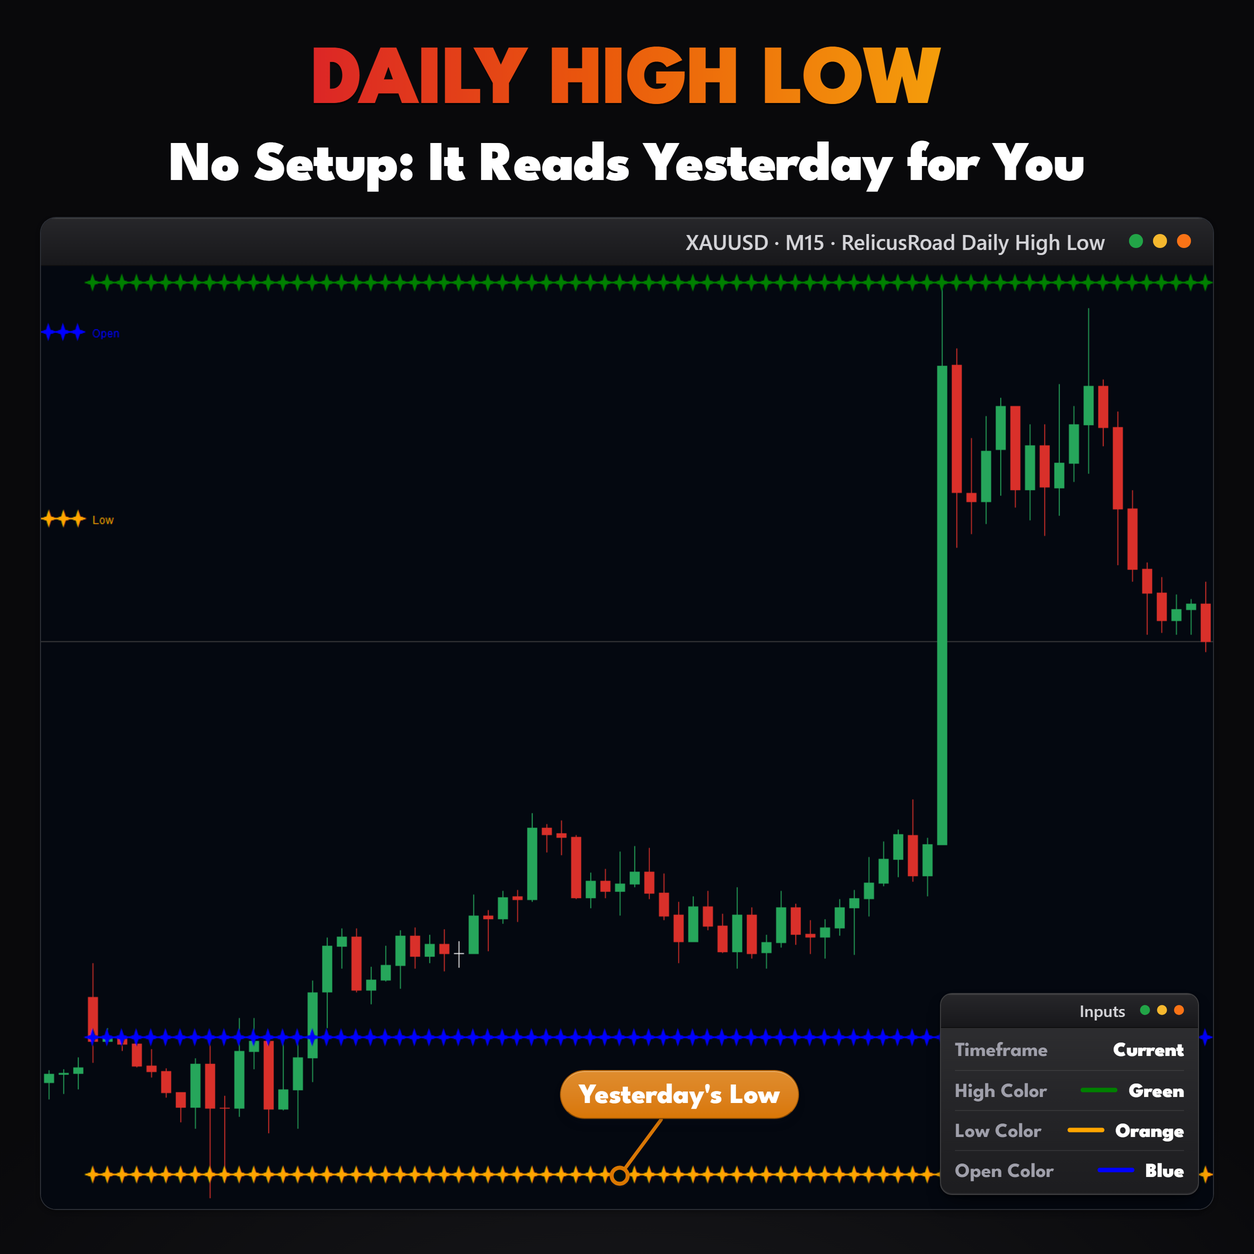
Appearance. High Color, Low Color and Open Color are green, orange and blue by default, and each color applies to that series’ tag as well. High Width, Low Width and Open Width set the dot size, 1 by default. Larger widths read better on a busy chart.
There is one input you can leave alone. Show High, Show Low and Show Open look like visibility switches, but in this build they only gate the alert check, and the alert check cannot deliver anything. All three series stay on the chart whatever you set them to.
What It Does Not Do
Worth knowing before you install:
- It does not send alerts. Show Alerts exists, but no popup, push, email or sound is delivered in this build.
- It does not hide individual levels. Show High, Show Low and Show Open do not remove anything.
- It does not draw on W1 or MN1 charts.
- It does not project the levels forward. The series stop at the current bar, and only the tags sit two bars ahead.
- It does not shift the day boundary. Levels follow server time, with no offset input.
- It does not divide the range into pivot levels. For a scale built from the previous range, see RelicusRoad Daily Pivots.
Setup In Three Steps
- Buy it on the MQL5 Market and install it from the Market tab of your terminal.
- Drag RelicusRoad Daily High Low from Navigator, Indicators, Market onto an intraday chart. Below H1 the defaults already give you daily levels.
- On an H1 or H4 chart, set Timeframe to D1 if you want daily levels instead of weekly ones.
It runs on forex, gold, indices, stocks and crypto. Pair it with
RelicusRoad Trading Sessions if you want to see which
session made yesterday’s high, and give the chart enough history for the previous period to be loaded.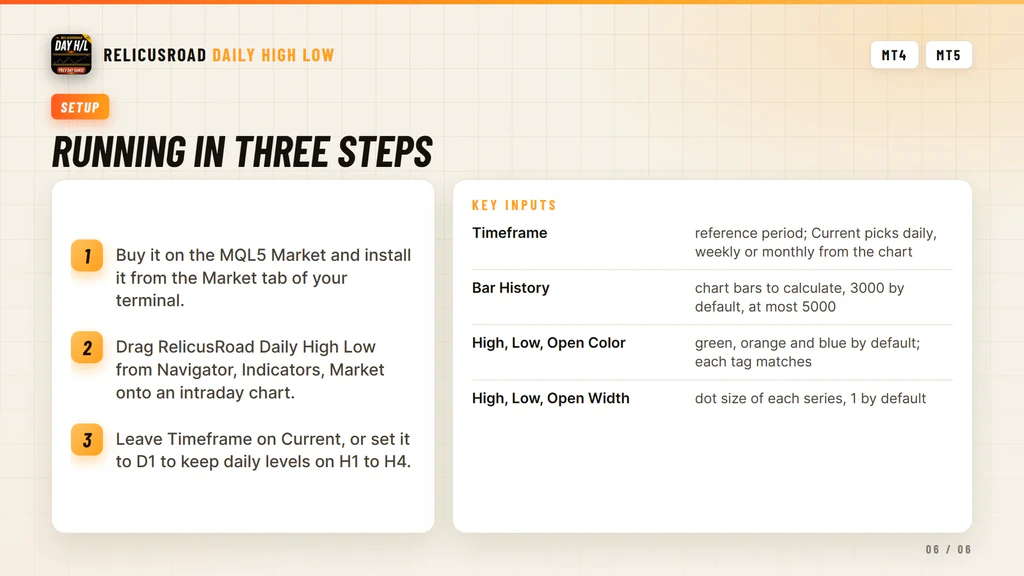
Where It Comes From
The daily high, low and open markers are one of the reference level modules inside RelicusRoad Pro, published on their own as a light addition to an intraday chart. It runs standalone and needs no other RelicusRoad product.
Support runs through the product comments and the mql5.com messaging system.
Frequently Asked Questions
Everything you need to know about RelicusRoad Daily High Low. Still curious? Reach out anytime.
Learn How to Trade It
Every indicator ships with reference documentation and a matching strategy guide. You can also read what other traders say or start with the setup guide.
Indicator Reference
- Road Levels Dynamic S/R levels around a moving center line
- Support & Resistance Advanced S/R zones with alerts
- Action Levels Critical price levels for major moves
- Signal Lines Trend bias filter with two independent lines
- Daily High/Low/Open Daily extremes for range trading
- Daily Pivots Pro pivot points S1-S3, R1-R3
Trading Strategies
- Strategy #1: Price Action (Road) + SR + Trendlines + 2 TFs
- Strategy #2: Local Trendline + Price Position on Road + 2 TFs
- Strategy #3: Arrows + Price Action (Road) + SR
- Strategy #4: MicroScalping + Multiple Pairs + Daily Target 2-10%
Trading Guides
- Non-Repaint Forex Indicators: What 'Non-Repaint' Actually Means (and How to Verify It)
- Prop Firm Challenges: The 'Slow Boring' Strategy to Getting Funded
- Market Sessions Trading: How to Time the 'London-NY Overlap'
- What Is Forex Trading and How Does It Work?
- The Real Cost of Trading Platforms in 2026: A Broker-Neutral Teardown
- Position Sizing: The Boring Math That Keeps Traders Alive
- Forex Trading Psychology: 7 Traps and Process Fixes
Related tools
Single RelicusRoad indicators for MT4 and MT5, each one standalone.



