What It Does
Most pivot indicators give you a central price and a ladder of supports and resistances around it. RelicusRoad Daily Pivots does something simpler and, for measuring a move, more direct. It takes the previous day’s range and turns it into a ruler.
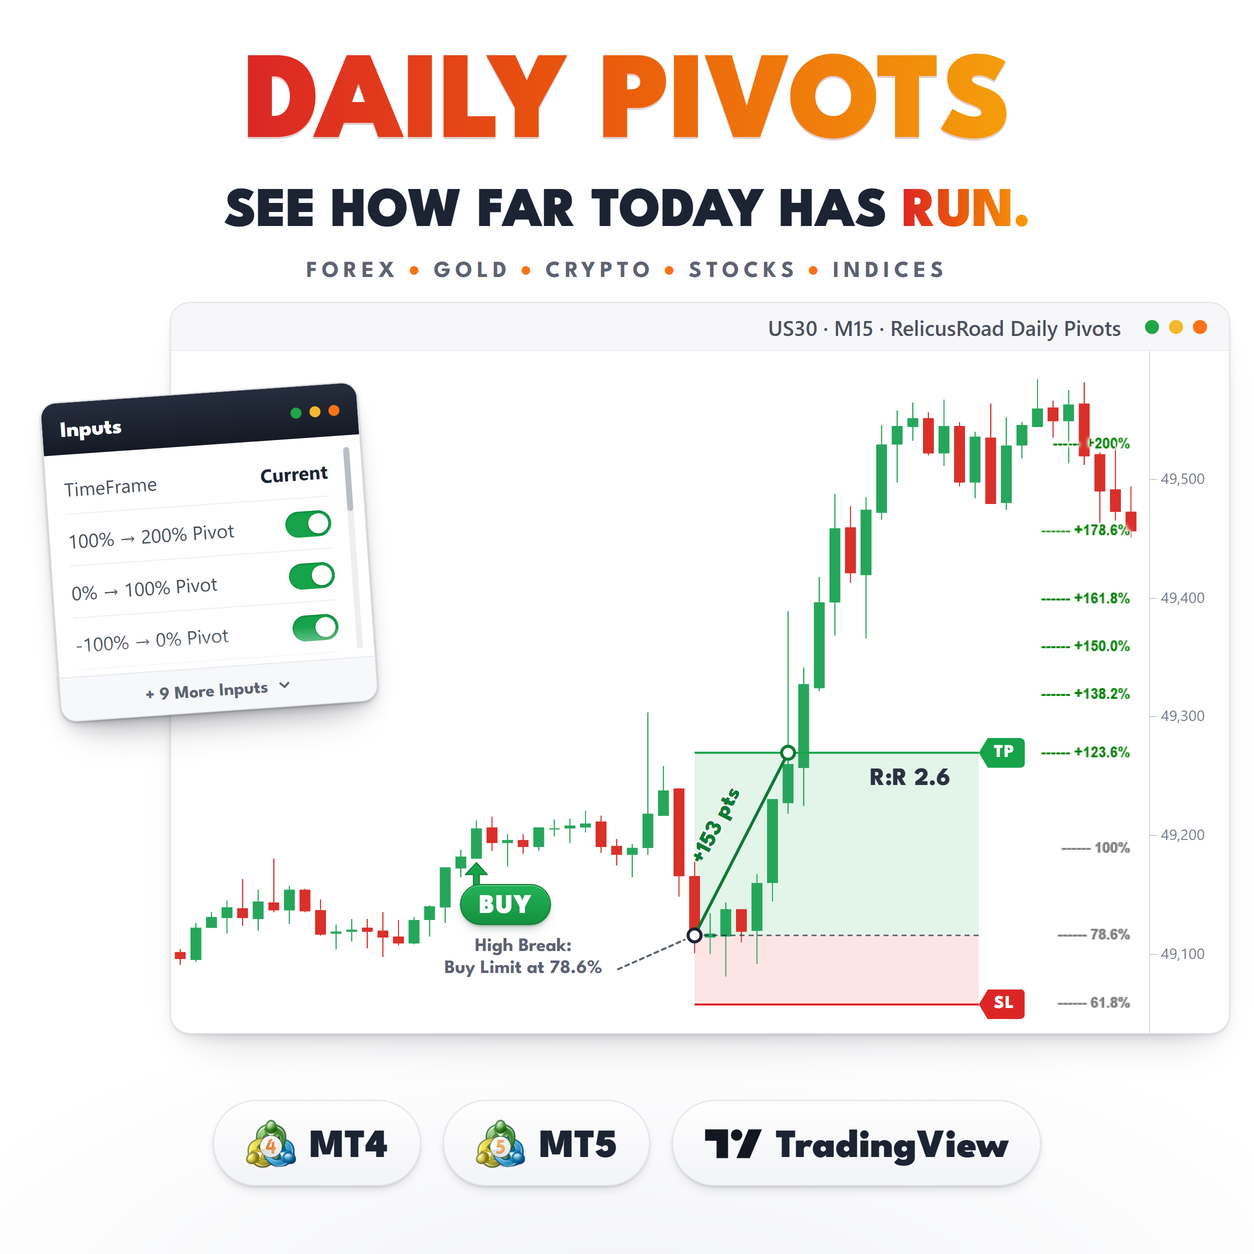
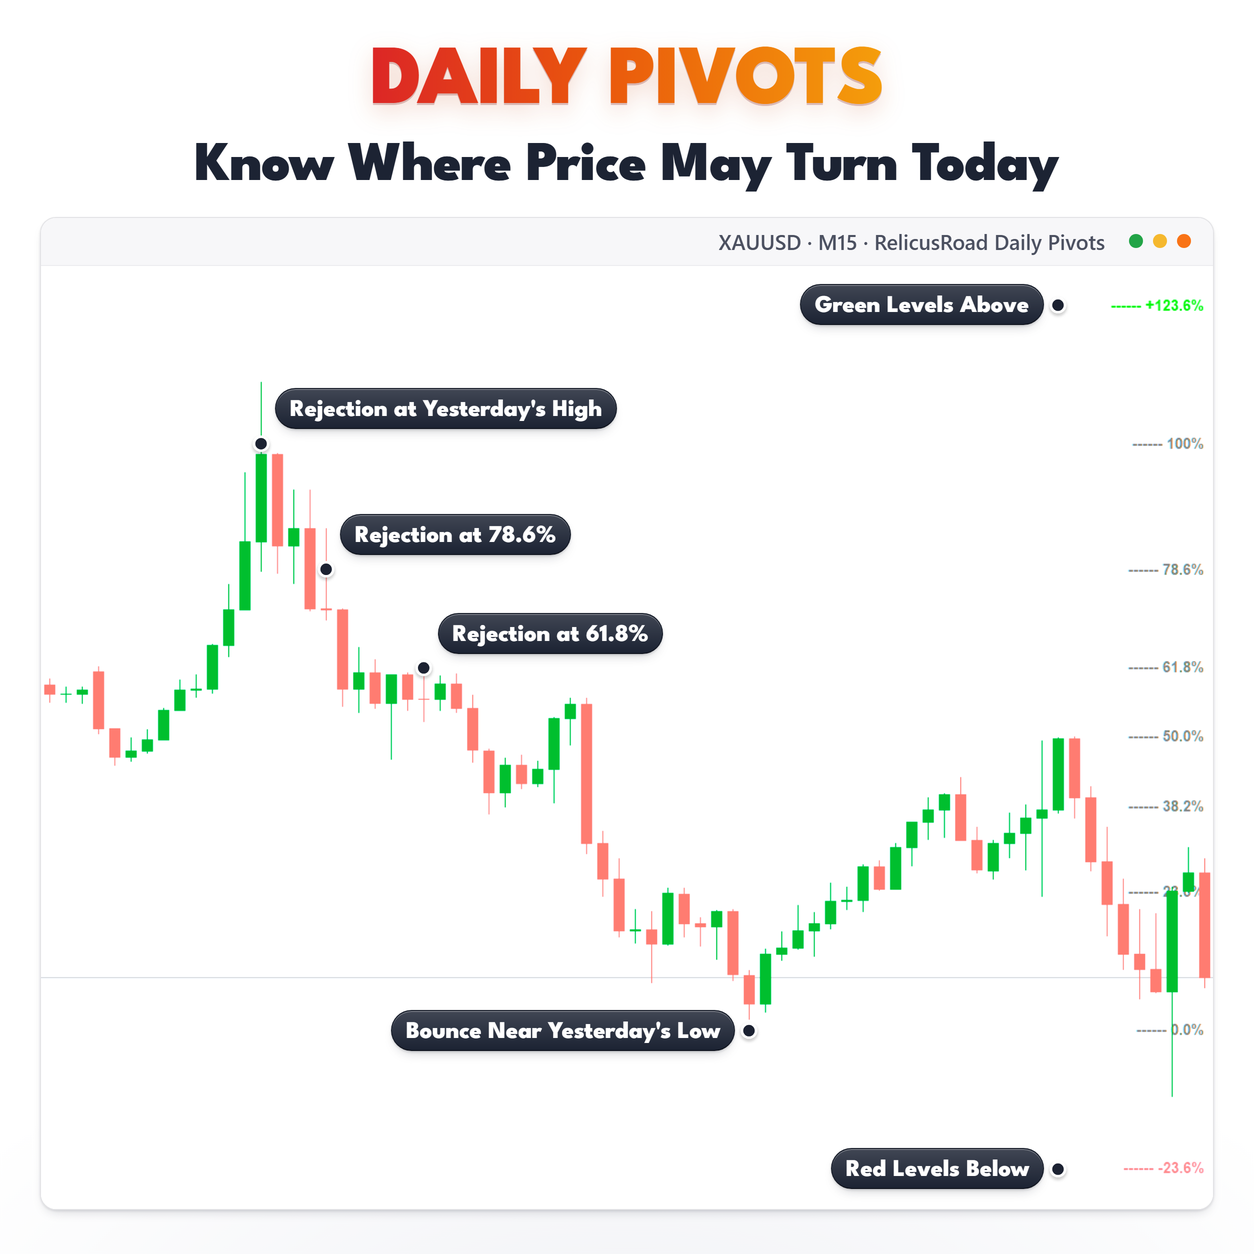
The low of that range becomes 0 percent and the high becomes 100 percent. Fibonacci ratios split the space between them, and the same ratios continue above and below, out to plus 200 percent and minus 100 percent. Nineteen markers in total, printed at the right edge of your chart in three colors.
The value is in the reading. A move that reaches plus 161.8 percent has traveled 61.8 percent of
yesterday’s range beyond yesterday’s high. That is a sentence you can say out loud, and it means the
same thing on gold as it does on EURUSD.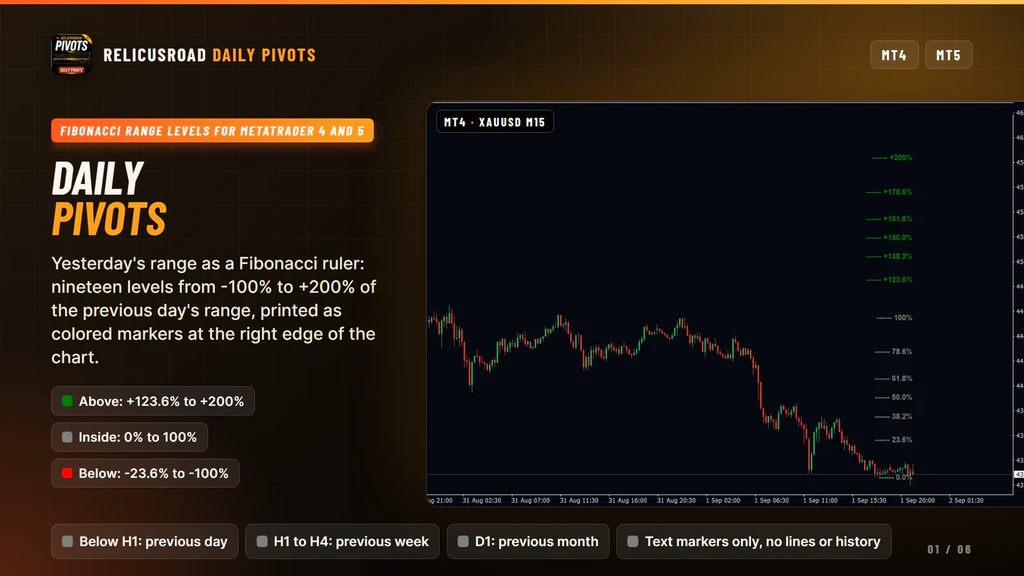
How It Works
The arithmetic is one line. For the previous completed period, with its high H and its low L:
level = L + ratio x (H - L)At ratio 0 you get the previous low, at 1.0 the previous high, at 0.5 the midpoint. Ratios above 1 and below 0 extend the same spacing past both ends of the range.
Which period supplies H and L depends on the chart:
| Chart timeframe | Reference period |
|---|---|
| Below H1 | The previous trading day |
| H1 to H4 | The previous week |
| D1 | The previous month |
| W1 and MN1 | Nothing is drawn |
- Below H1
- The previous trading day
- H1 to H4
- The previous week
- D1
- The previous month
- W1 and MN1
- Nothing is drawn
Weekend bars are skipped when the reference is chosen, so on a Monday you get Friday’s range rather
than a two-hour Sunday session. Period boundaries follow your broker’s server time, the same clock
behind the platform’s own daily and weekly candles.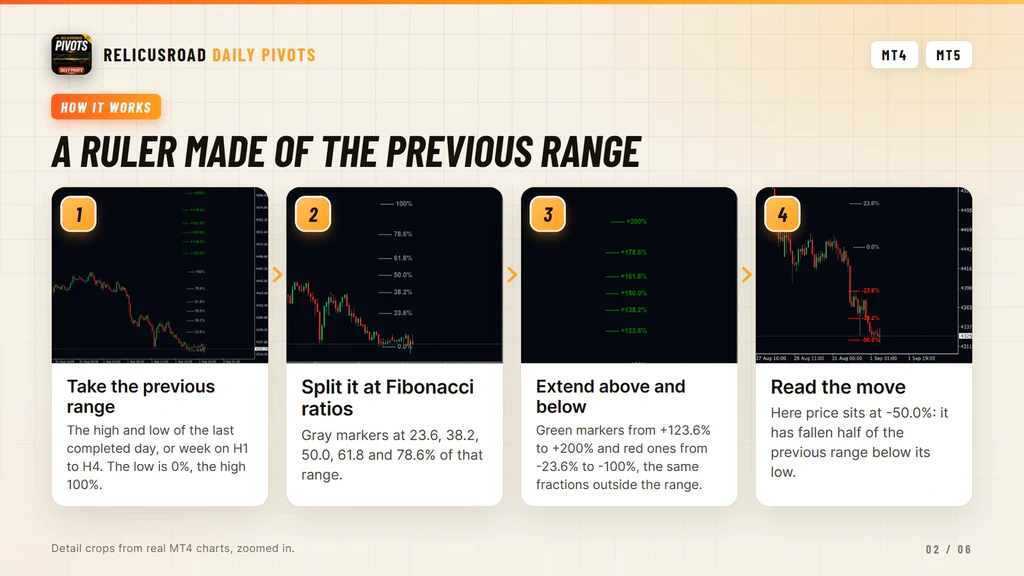
Not Floor Pivots, And The Scale Can Widen
Two things to know before you buy, because both surprise people who expect a traditional pivot tool.
This is not a floor pivot indicator. There is no central pivot, no R1, no S2. If your trading plan names those levels, this is the wrong tool and no setting will produce them. What you get instead is a proportional scale, which answers a different question: how big is today’s move compared with yesterday’s.
The second point is about the scale itself. The high and low behind it are the widest seen since the
indicator was loaded, and they are not reset when a new day starts. Leave the chart open for several
days and the ruler can end up measuring more than the latest range. The fix takes two seconds. Reload
the indicator, or switch timeframe and back, and the scale is rebuilt from the most recent completed
range.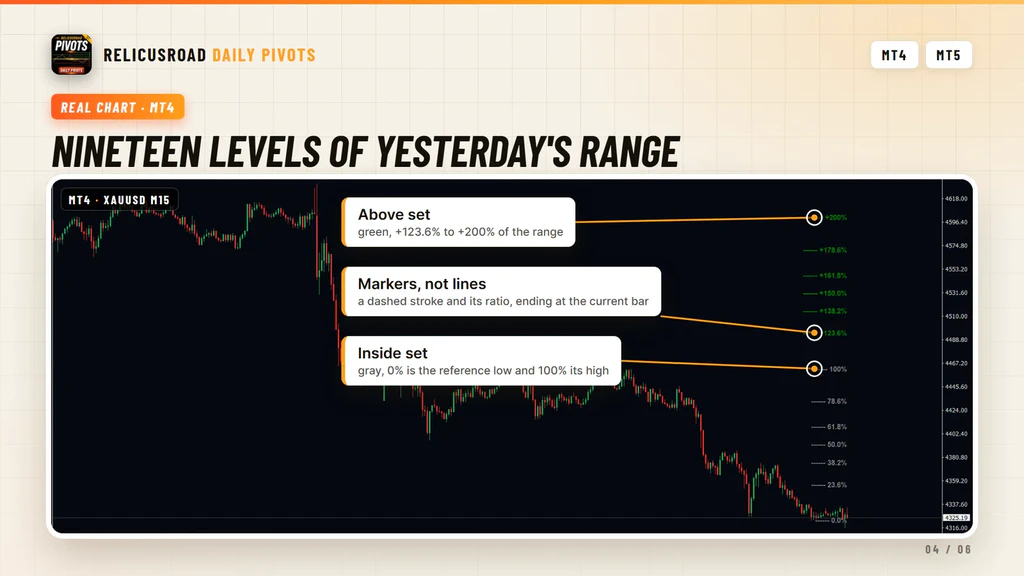
What You See On The Chart
| Element | Meaning |
|---|---|
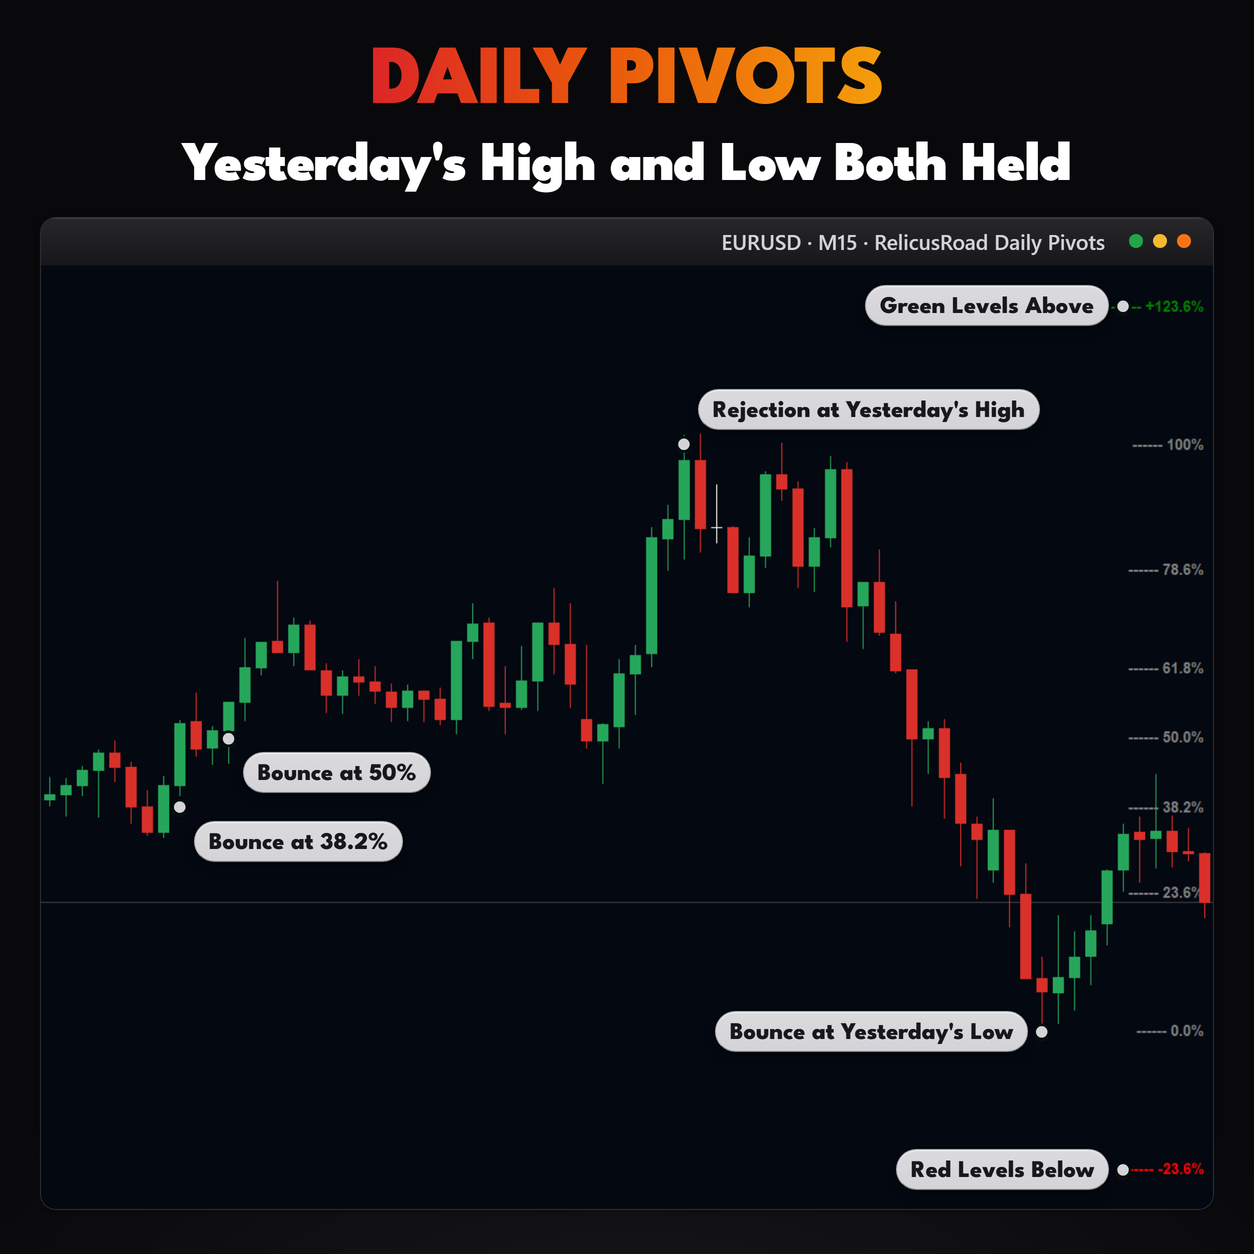
| Gray markers | Inside the range: 0, 23.6, 38.2, 50.0, 61.8, 78.6 and 100 percent |
| Green markers | Above the range: plus 123.6 through plus 200 percent |
| Red markers | Below the range: minus 23.6 through minus 100 percent |
| Marker shape | A short dashed stroke followed by its ratio, for example 61.8 percent |
| Position | The right end of every marker sits at the time of the current bar |
| Tooltip | The ratio again, for hovering when the chart is busy |
- Gray markers
- Inside the range: 0, 23.6, 38.2, 50.0, 61.8, 78.6 and 100 percent
- Green markers
- Above the range: plus 123.6 through plus 200 percent
- Red markers
- Below the range: minus 23.6 through minus 100 percent
- Marker shape
- A short dashed stroke followed by its ratio, for example 61.8 percent
- Position
- The right end of every marker sits at the time of the current bar
- Tooltip
- The ratio again, for hovering when the chart is busy
The markers are text, not line objects. They sit behind price, cannot be selected by accident, and
stay out of the object list, so they never get in the way of trendlines you drew yourself.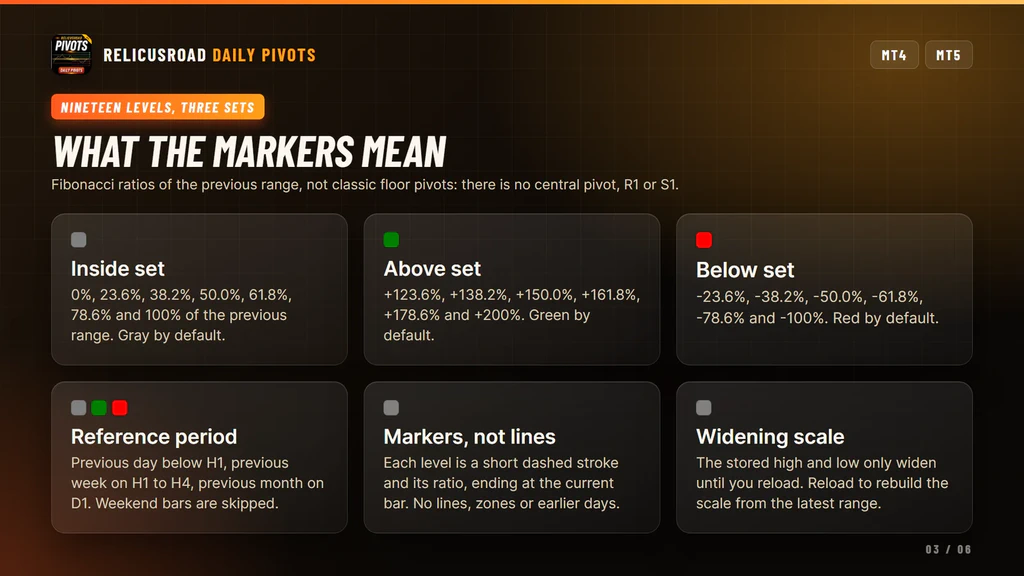
What It Does For Your Trading
Four things, each one printed on the chart rather than worked out in your head.
The Previous Range, Already Measured
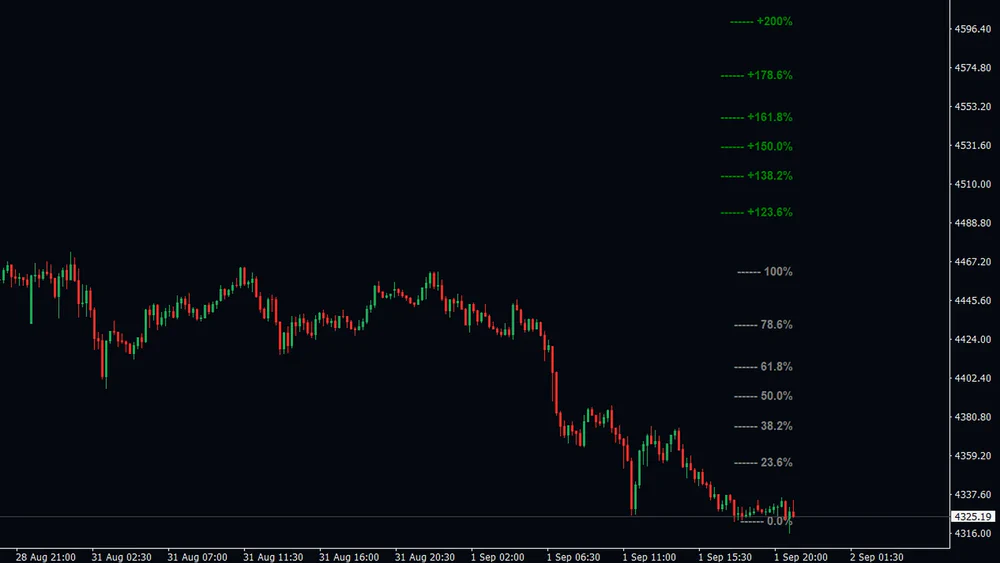
The low of the last completed session is 0.0 percent and its high is 100 percent. Every marker on the chart is a fraction of that one range, printed beside the current bar.
No dragging a Fibonacci tool between two candles and no argument with yourself about which high to anchor it to. The measurement is the same every day and on every symbol.
Retracement Levels Without Drawing
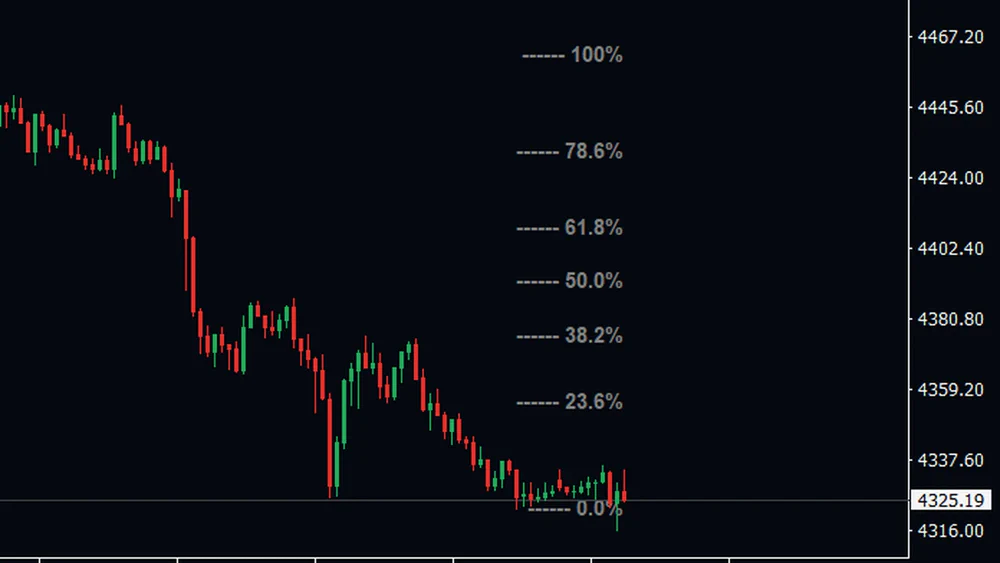
Inside the range, gray markers sit at 23.6, 38.2, 50.0, 61.8 and 78.6 percent. The 50.0 percent marker is the midpoint of the previous session, which is where a quiet market often spends its morning.
When price stalls, you can name the level it stalled at straight away instead of measuring backwards after the move is over.
Puts A Number On A Breakout
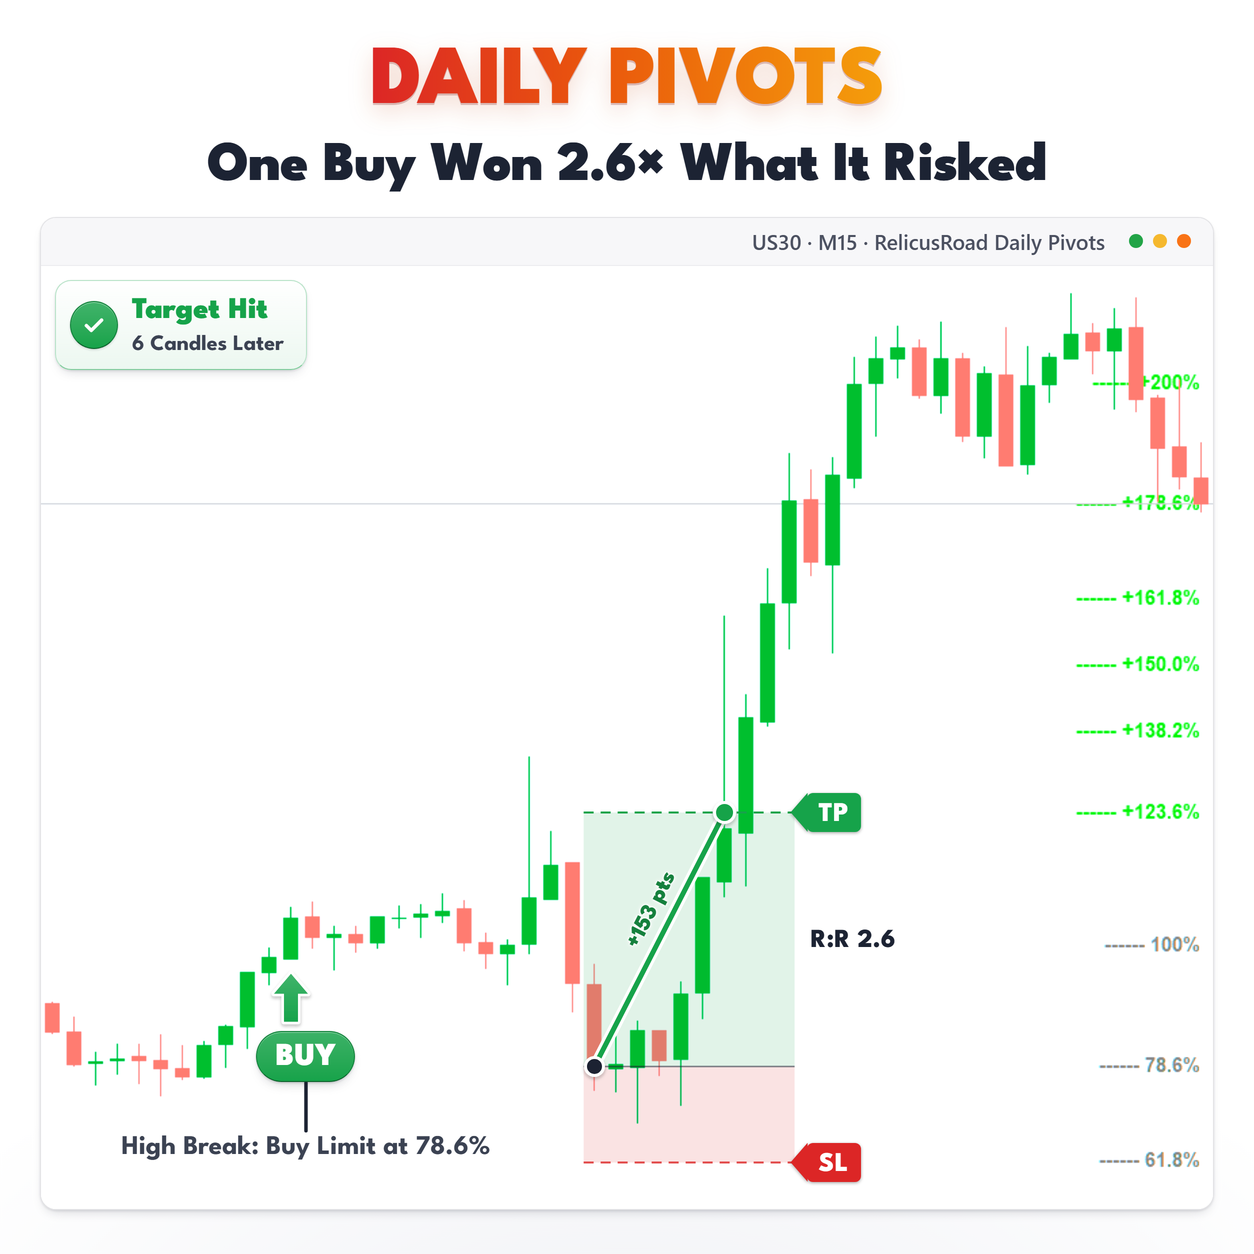
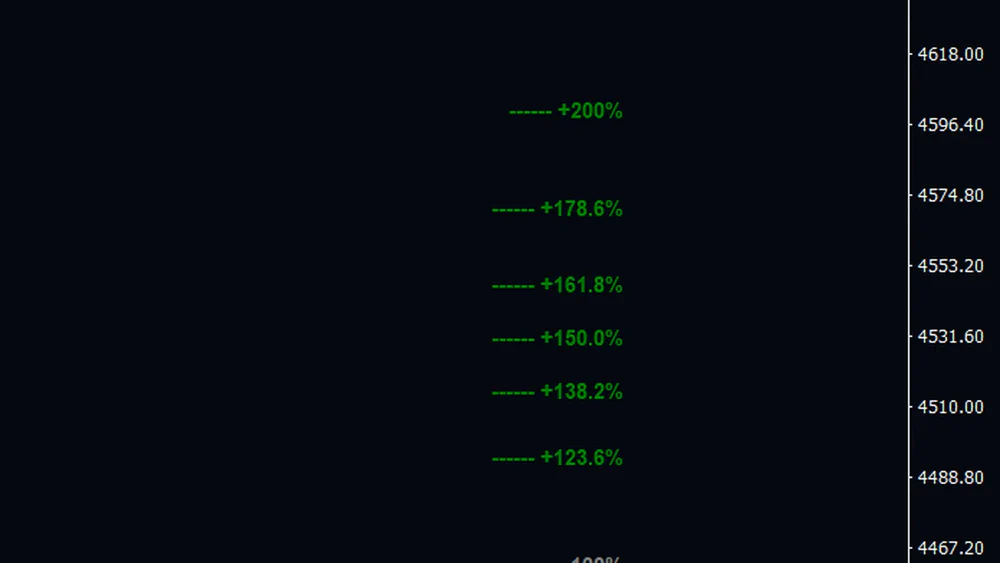
Above the range the same fractions continue in green, from plus 123.6 percent to plus 200 percent, and the red set mirrors them below. Plus 200 percent is one full previous range beyond the previous high.
Break out and the question is always how far is far. These markers answer it in the only unit that compares across symbols, which is yesterday’s own range.
Reads The Move In Plain Numbers
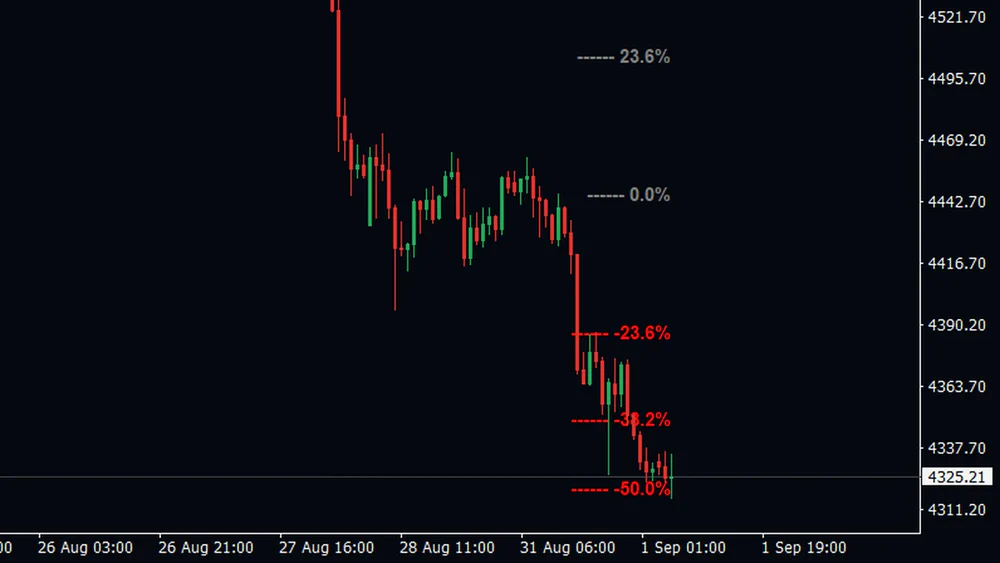
Here price sits at minus 50.0 percent. It has fallen half of the previous range below the low of that range, and you can see that without a single calculation.
Two honest notes. On an H1 chart like this one the reference is the previous week, not yesterday, and the scale is fixed when the indicator loads, so reload it after a few days to measure against the latest completed range.
Reading It On A Live Chart
Start with the gray set. Price between 0 and 100 percent is still inside the previous range, and the 50 percent marker is the middle of it, which is often where a quiet session spends the morning.
Then use the extensions as a size check. Price at plus 123.6 percent has broken out by roughly a quarter of yesterday’s range. Price at minus 61.8 percent has done the same to the downside. Compare that with how far the market usually travels in a day and you have a rough sense of whether the move is ordinary or unusual, without a single calculation of your own.
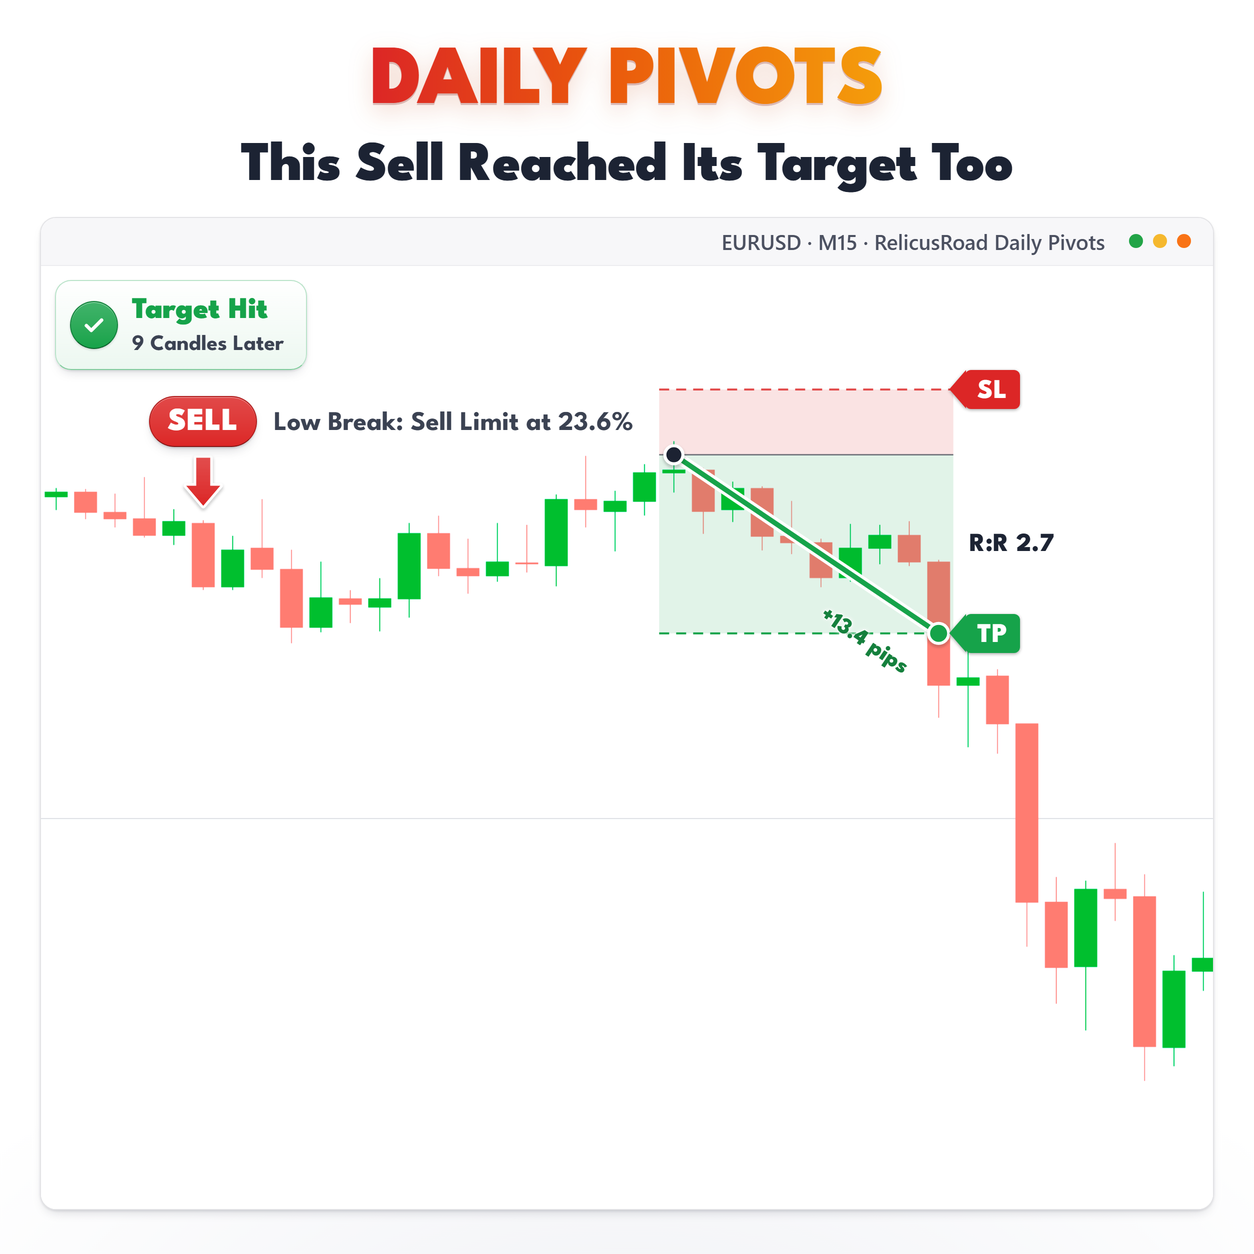
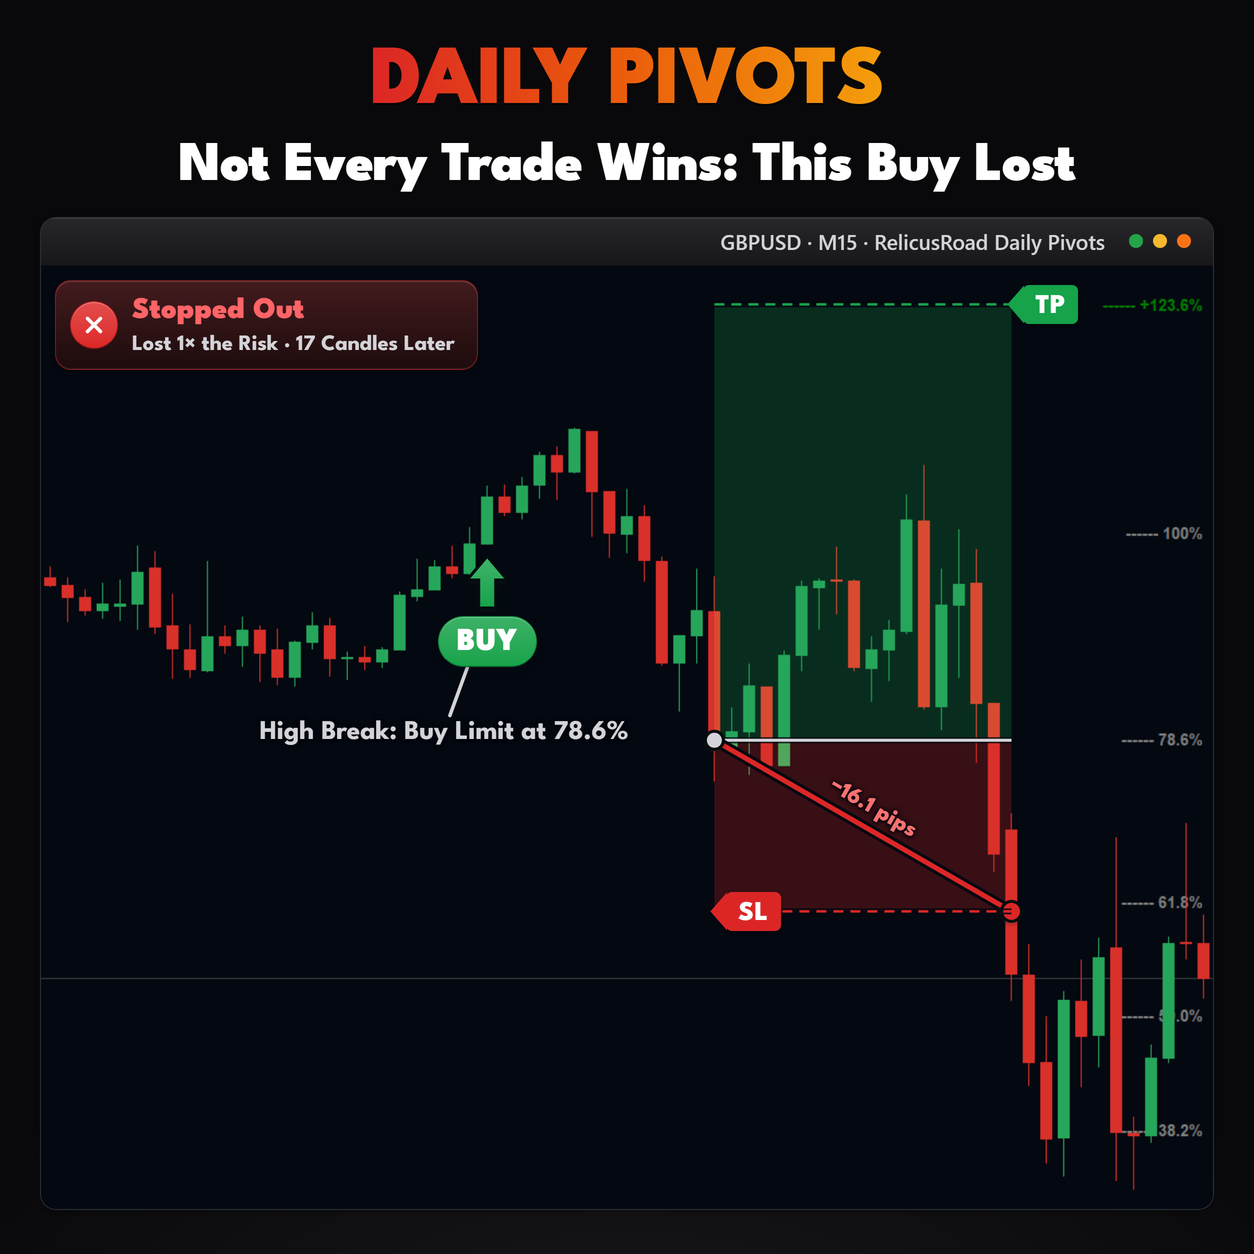
The ruler measures, it does not predict. A marker is not a signal, and price passing one says only
that the move is that many percent of the previous range.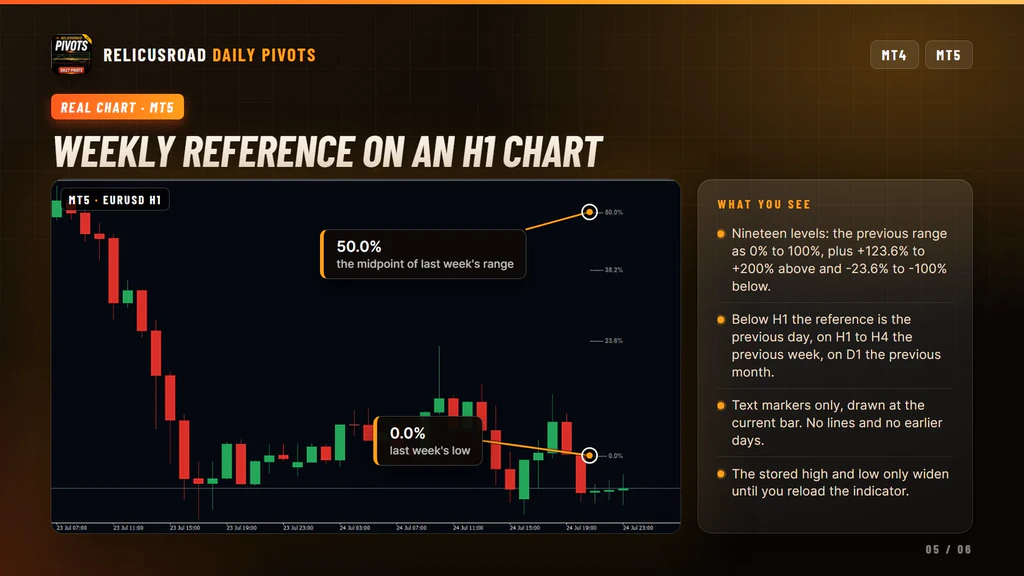
Settings You Can Change
Which sets are shown. Three toggles, one for the levels above the range, one for the levels inside it and one for the levels below. Turning the extensions off leaves the 0 to 100 percent scale on its own, which is a tidy setup on a small screen.
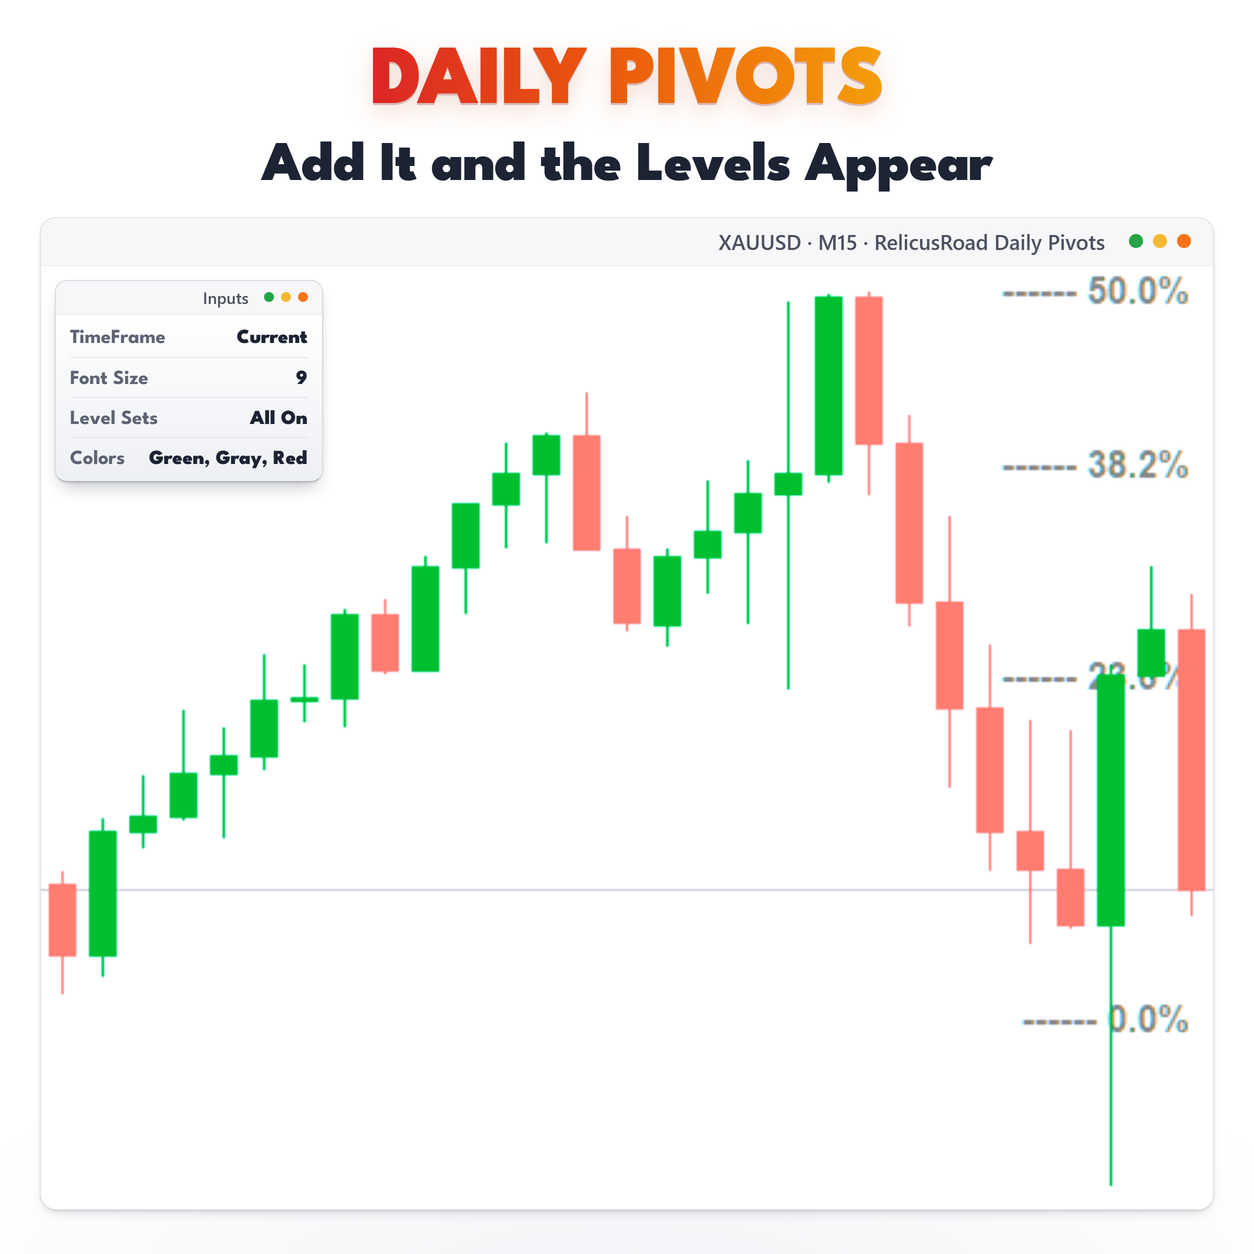
Appearance. A color for each set, green, gray and red by default, and Font Size for the marker text, 9 by default.
Reference period. Leave TimeFrame on Current. The automatic choice described above is the one this build applies, and other TimeFrame values are not used, so the honest instruction is to pick the chart that gives you the period you want: a chart below H1 for daily levels, H1 to H4 for weekly.
What It Does Not Do
Worth knowing before you install:
- It does not draw classic pivots. No central pivot, no R1, no S1.
- It does not send alerts. The Show Alerts input exists, but nothing is delivered in this build.
- It does not keep earlier days. One current set of markers is printed, with no history.
- It does not draw horizontal lines or fill buffers, so an Expert Advisor cannot read the levels.
- It does not re-anchor the scale at a new session. Reload it to rebuild from the latest range.
- It does not apply the TimeFrame input beyond Current in this build.
- It does not carry the previous high and low across the chart. For that, see RelicusRoad Daily High Low.
Setup In Three Steps
- Buy it on the MQL5 Market and install it from the Market tab of your terminal.
- Drag RelicusRoad Daily Pivots from Navigator, Indicators, Market onto an intraday chart below H1 for daily levels. Leave TimeFrame on Current.
- Turn off the sets you do not need, and raise Font Size if the markers are hard to read.
It runs on forex, gold, indices and crypto. Reload it after a few days on the same chart so the ruler
measures the most recent range. If you want Fibonacci retracements of the last swing rather than of the
last session, RelicusRoad Scalping Pivots does that job.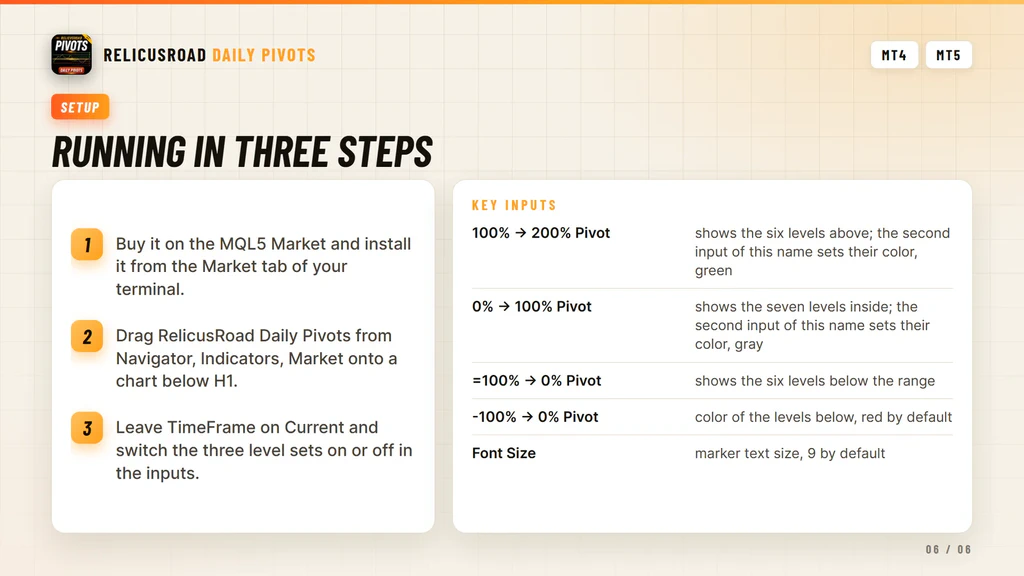
Where It Comes From
The Fibonacci range scale is the daily pivot model inside RelicusRoad Pro, published on its own for traders who measure moves against the previous session. It runs standalone and needs no other RelicusRoad product.
Support runs through the product comments and the mql5.com messaging system.
Frequently Asked Questions
Everything you need to know about RelicusRoad Daily Pivots. Still curious? Reach out anytime.
Learn How to Trade It
Every indicator ships with reference documentation and a matching strategy guide. You can also read what other traders say or start with the setup guide.
Indicator Reference
- Road Levels Dynamic S/R levels around a moving center line
- Support & Resistance Advanced S/R zones with alerts
- Action Levels Critical price levels for major moves
- Signal Lines Trend bias filter with two independent lines
- Daily High/Low/Open Daily extremes for range trading
- Daily Pivots Pro pivot points S1-S3, R1-R3
Trading Strategies
- Strategy #1: Price Action (Road) + SR + Trendlines + 2 TFs
- Strategy #2: Local Trendline + Price Position on Road + 2 TFs
- Strategy #3: Arrows + Price Action (Road) + SR
- Strategy #4: MicroScalping + Multiple Pairs + Daily Target 2-10%
Trading Guides
- Non-Repaint Forex Indicators: What 'Non-Repaint' Actually Means (and How to Verify It)
- Prop Firm Challenges: The 'Slow Boring' Strategy to Getting Funded
- Market Sessions Trading: How to Time the 'London-NY Overlap'
- What Is Forex Trading and How Does It Work?
- The Real Cost of Trading Platforms in 2026: A Broker-Neutral Teardown
- Position Sizing: The Boring Math That Keeps Traders Alive
- Forex Trading Psychology: 7 Traps and Process Fixes
Related tools
Standalone MetaTrader indicators related to this one.