
What It Does
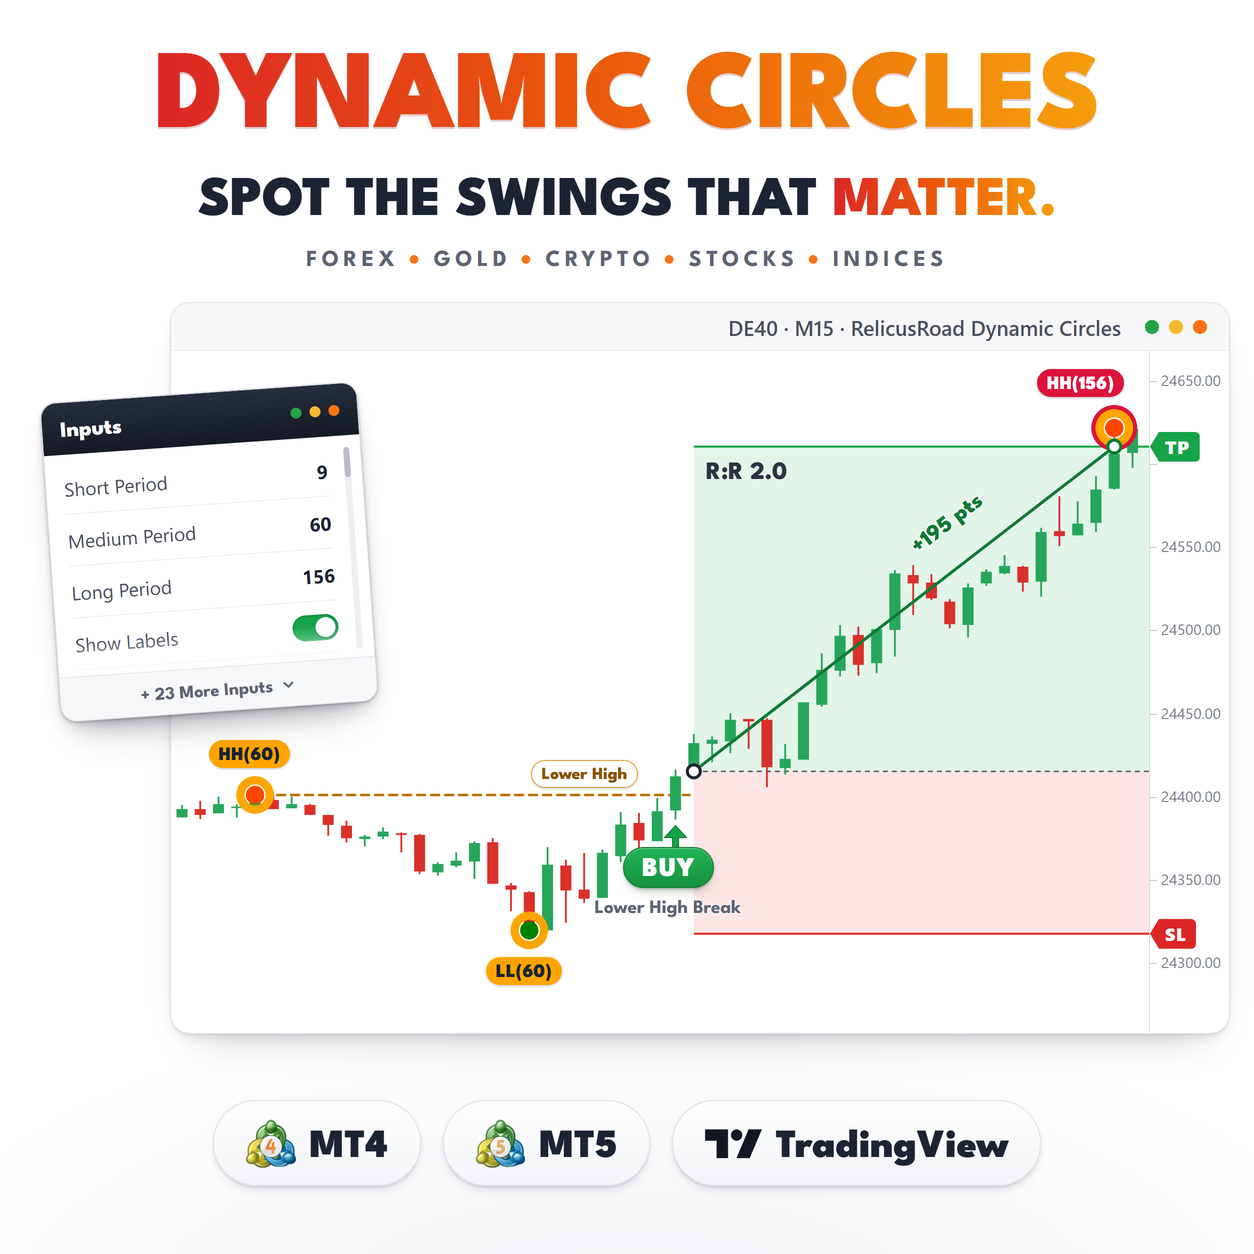
Dynamic Circles marks turning points at three lookback lengths on the same chart. A small dot for the short range, a ring for the medium, a larger ring for the long, each sitting exactly on the high or low price of its bar.
With the defaults that is 9, 60 and 156 bars. A bar that tops the last nine gets a small dot. A bar that tops the last hundred and fifty six gets the big ring, and usually all three marks at once, which is how you see at a glance that a turn mattered at more than one scale.
Every circle can carry a short label, HH(9) above a high or LL(156) below a low, so you never have to
work out which range drew what.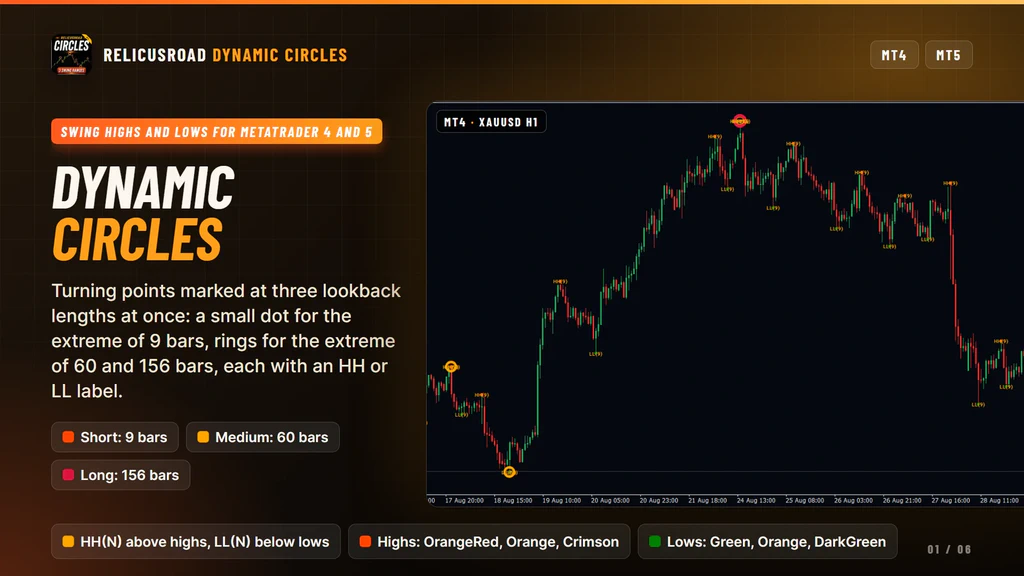
How It Works
The test is deliberately plain. For each bar, does this bar’s high top every high in the last N bars, counting the bar itself. If it does, the bar takes a high circle. Lows work the same way in reverse.
That runs three times, once per range, and the three ranges never talk to each other.
Then a second pass tidies up. When several high circles follow one another with no low circle between
them, only the one at the most extreme price survives. Lows are thinned the same way. The result
alternates high, low, high, low for each range, the way a zigzag does, so you get one mark per leg instead of a cluster.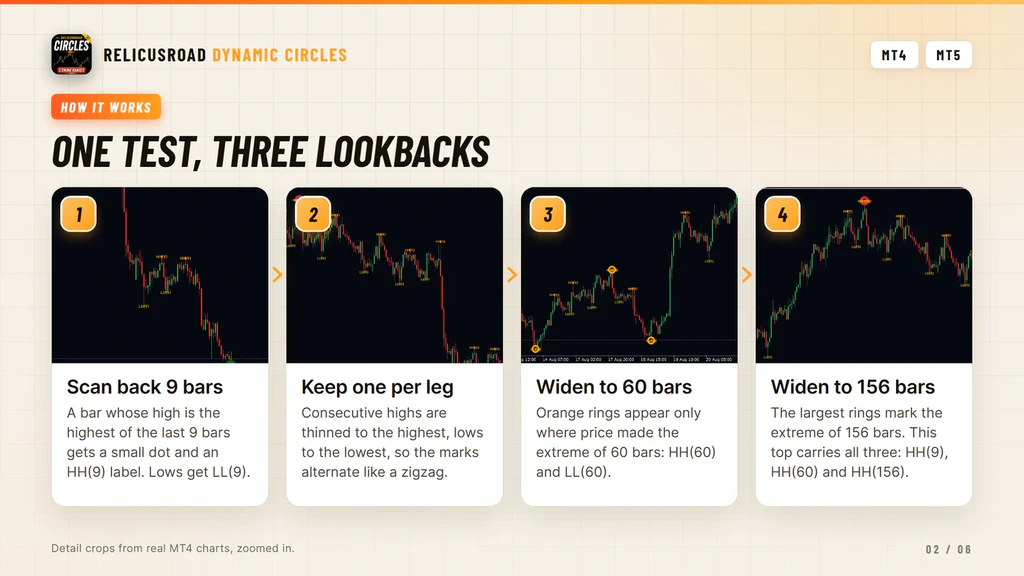
The Circles Are Not Confirmed Points
This is the trade-off at the heart of the tool, and it is worth understanding before you buy.
Because the test only looks backwards, a bar can be marked the moment it becomes the extreme so far. You see the mark immediately, with no waiting. The price of that speed is that the newest circle on each side can be removed later. When price pushes further the same way before the other side prints, the earlier circle goes and the new extreme keeps the mark.
So read the newest circle of a range as the most extreme point so far, not as a finished swing. Circles further back, with an opposite mark after them, are settled. If you want points that are tested with bars on both sides and never move once drawn, that is a different tool and a different trade-off.
One more timing note. The newest bar is evaluated when it opens, so a swing that forms inside that bar
may only pick up its circle after a chart reload. A live chart and a freshly reloaded chart can differ
on the last bar or two.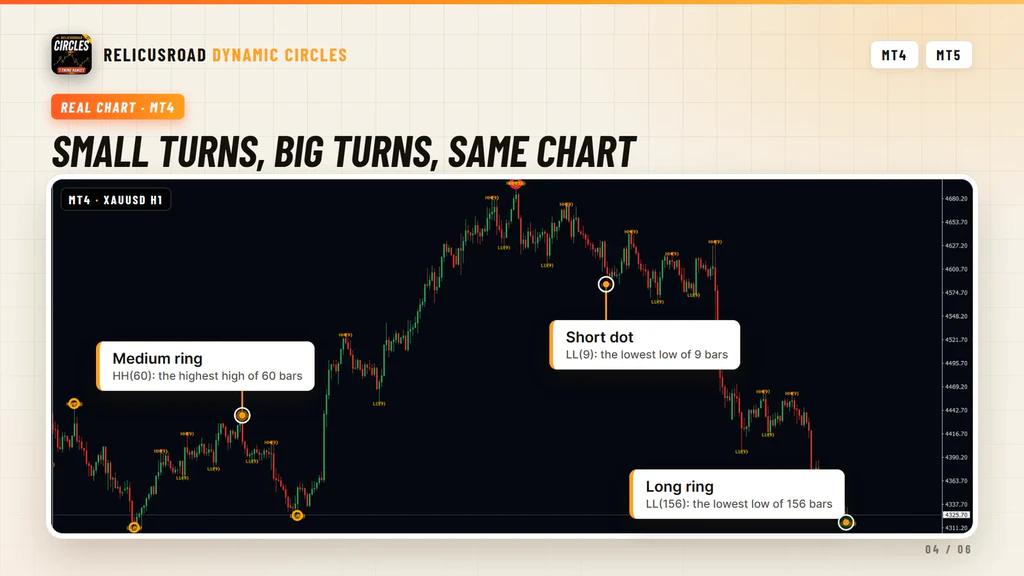
What You See On The Chart
| Element | Meaning |
|---|---|
| Small dot | Short range swing, orange-red on highs and green on lows by default |
| Ring | Medium range swing, orange on both sides, so position tells them apart |
| Larger ring | Long range swing, crimson on highs and dark green on lows |
| HH and LL labels | The range that drew the mark, such as HH(60) or LL(156) |
| Label distance | Long range labels sit further from price than short range ones |
- Small dot
- Short range swing, orange-red on highs and green on lows by default
- Ring
- Medium range swing, orange on both sides, so position tells them apart
- Larger ring
- Long range swing, crimson on highs and dark green on lows
- HH and LL labels
- The range that drew the mark, such as HH(60) or LL(156)
- Label distance
- Long range labels sit further from price than short range ones
Circles sit on the exact high or low price of their bar, not above or below it, so you can read a
level straight off the mark. Nothing else is added to the chart.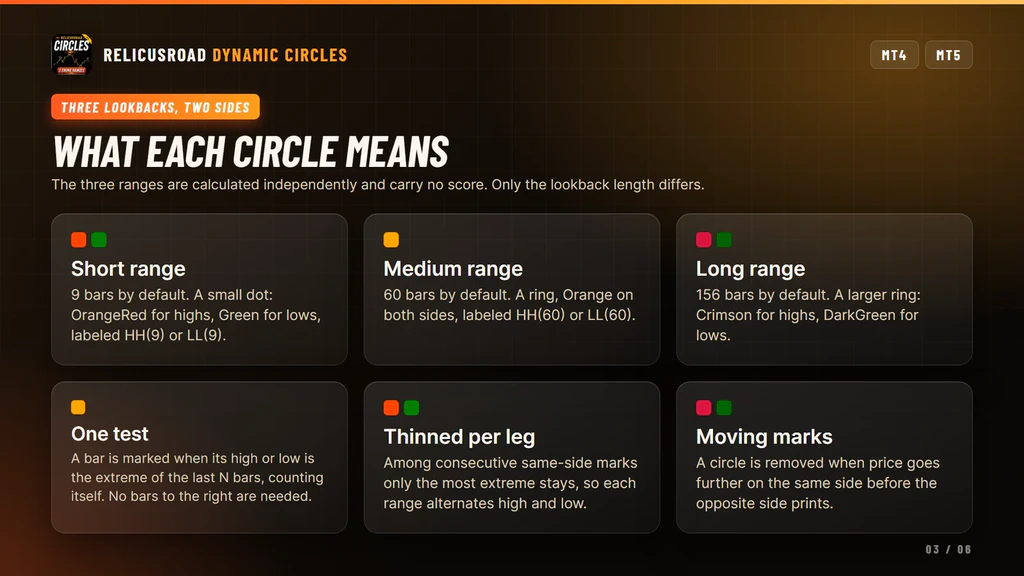
What It Does For Your Trading
Four things, each one you can check on the chart before you trust it.
Names Every Turn It Marks
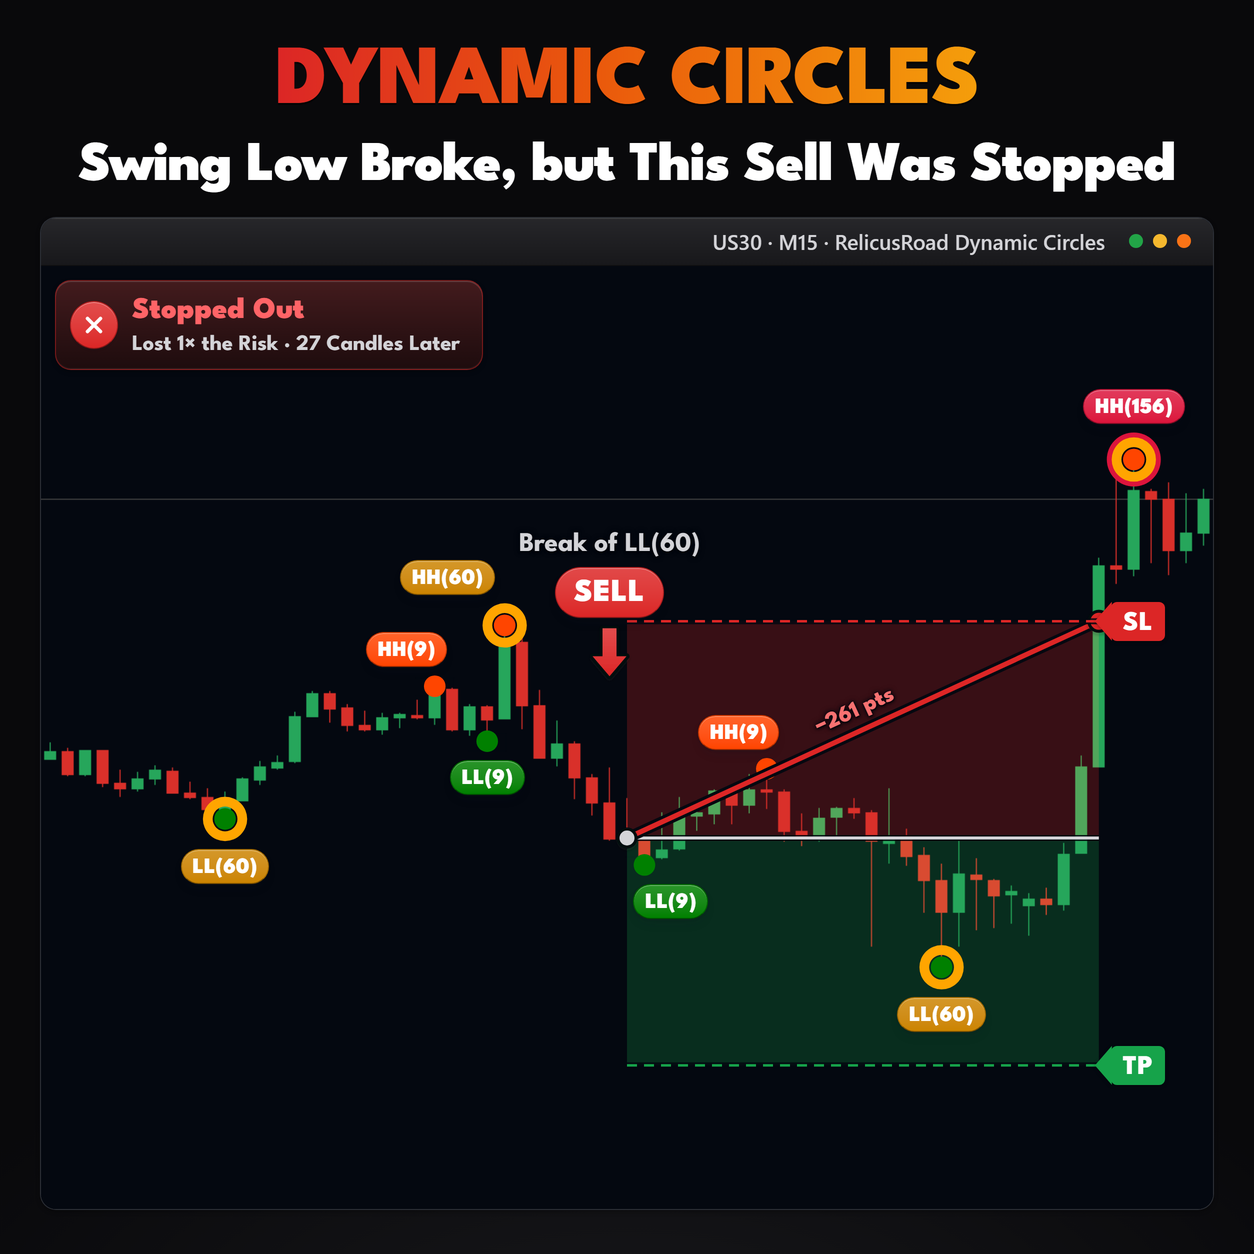
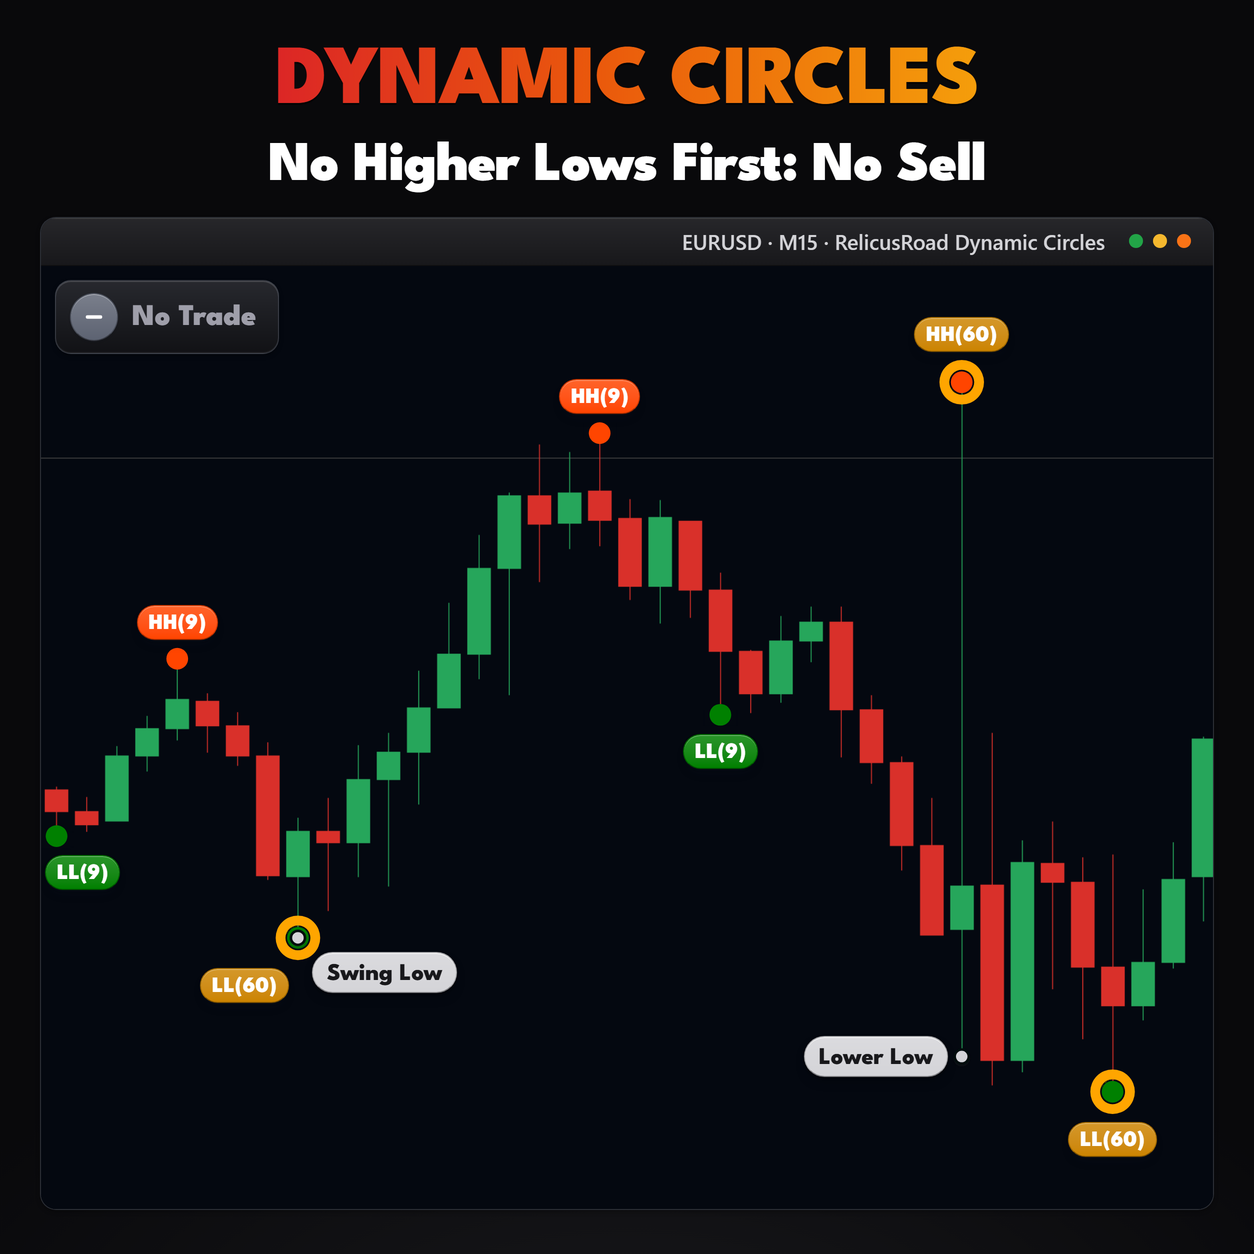
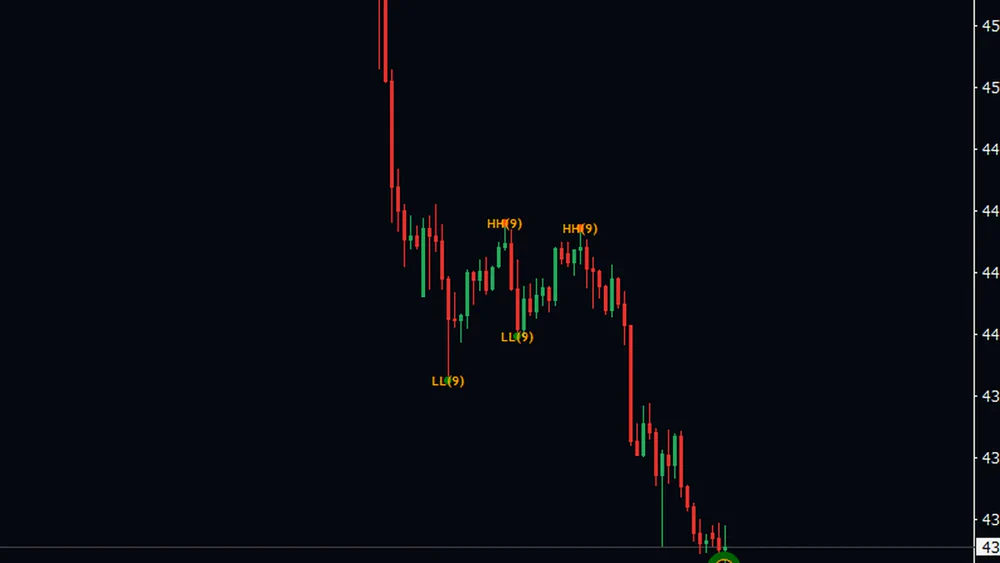
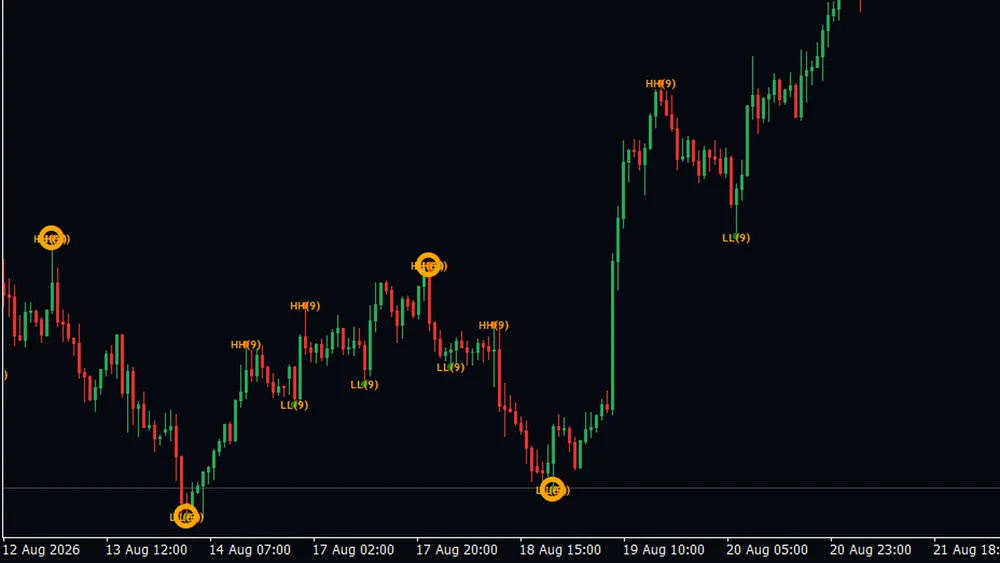
Each mark carries its own label, HH above a high and LL below a low, with the lookback length in brackets. In this crop the short range has tagged two highs and two lows inside one leg down.
You never have to work out which range drew what. That matters the moment you have all three lengths running, because the label answers it before you can ask.
Keeps One Mark Per Leg
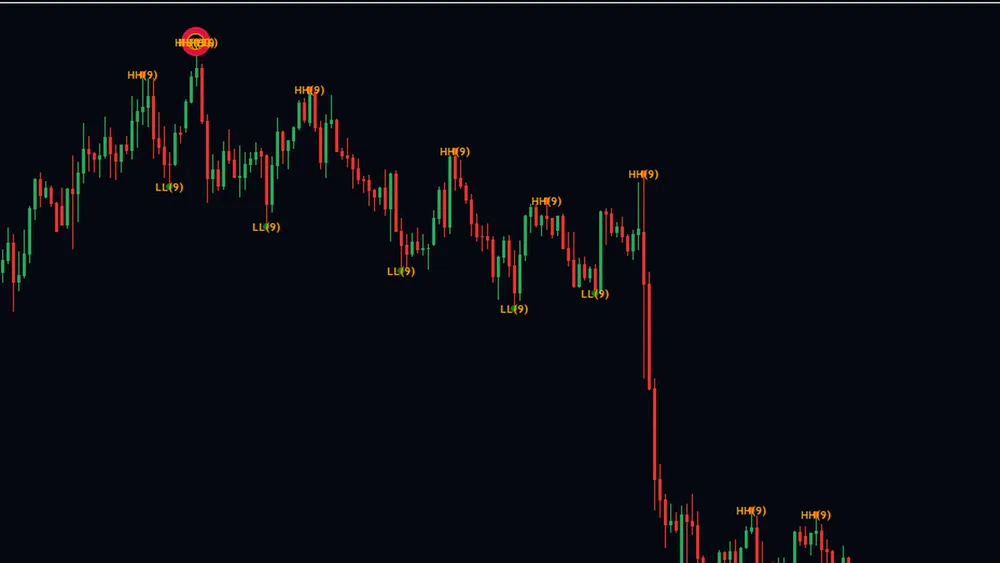
Consecutive highs with no low between them are thinned down to the one at the top, and lows to the one at the bottom, so the chart alternates high, low, high, low instead of stacking marks through a push.
That is what makes the output readable at a glance. You are looking at the skeleton of the move, not at every bar that happened to poke above its neighbours.
Separates Big Turns From Small
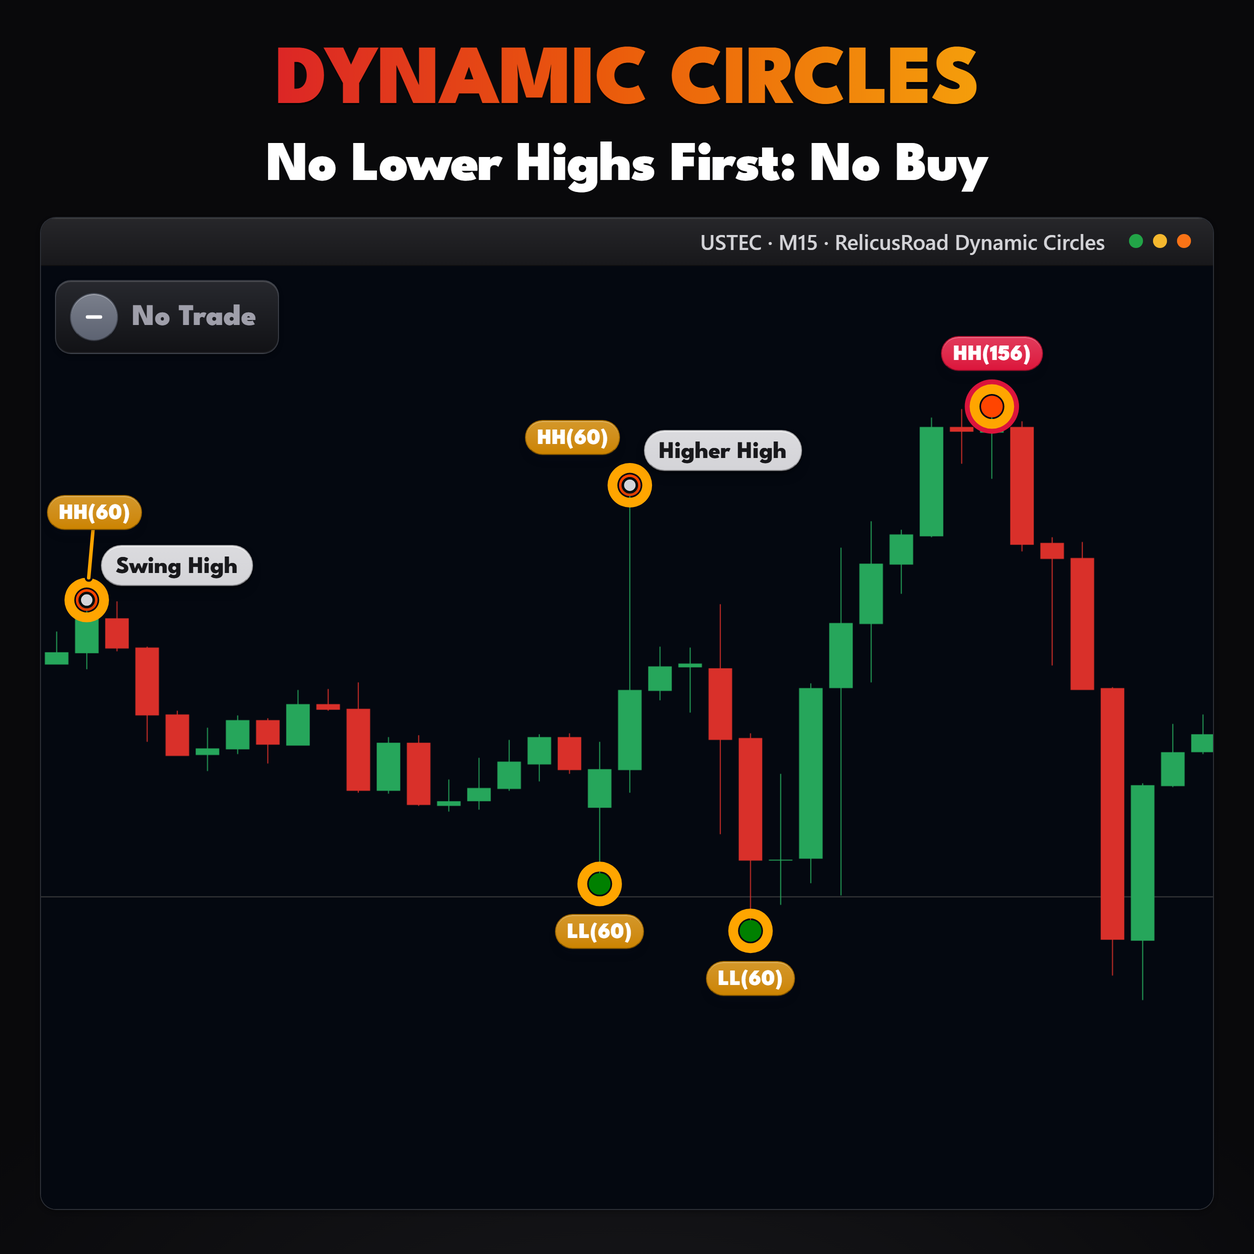
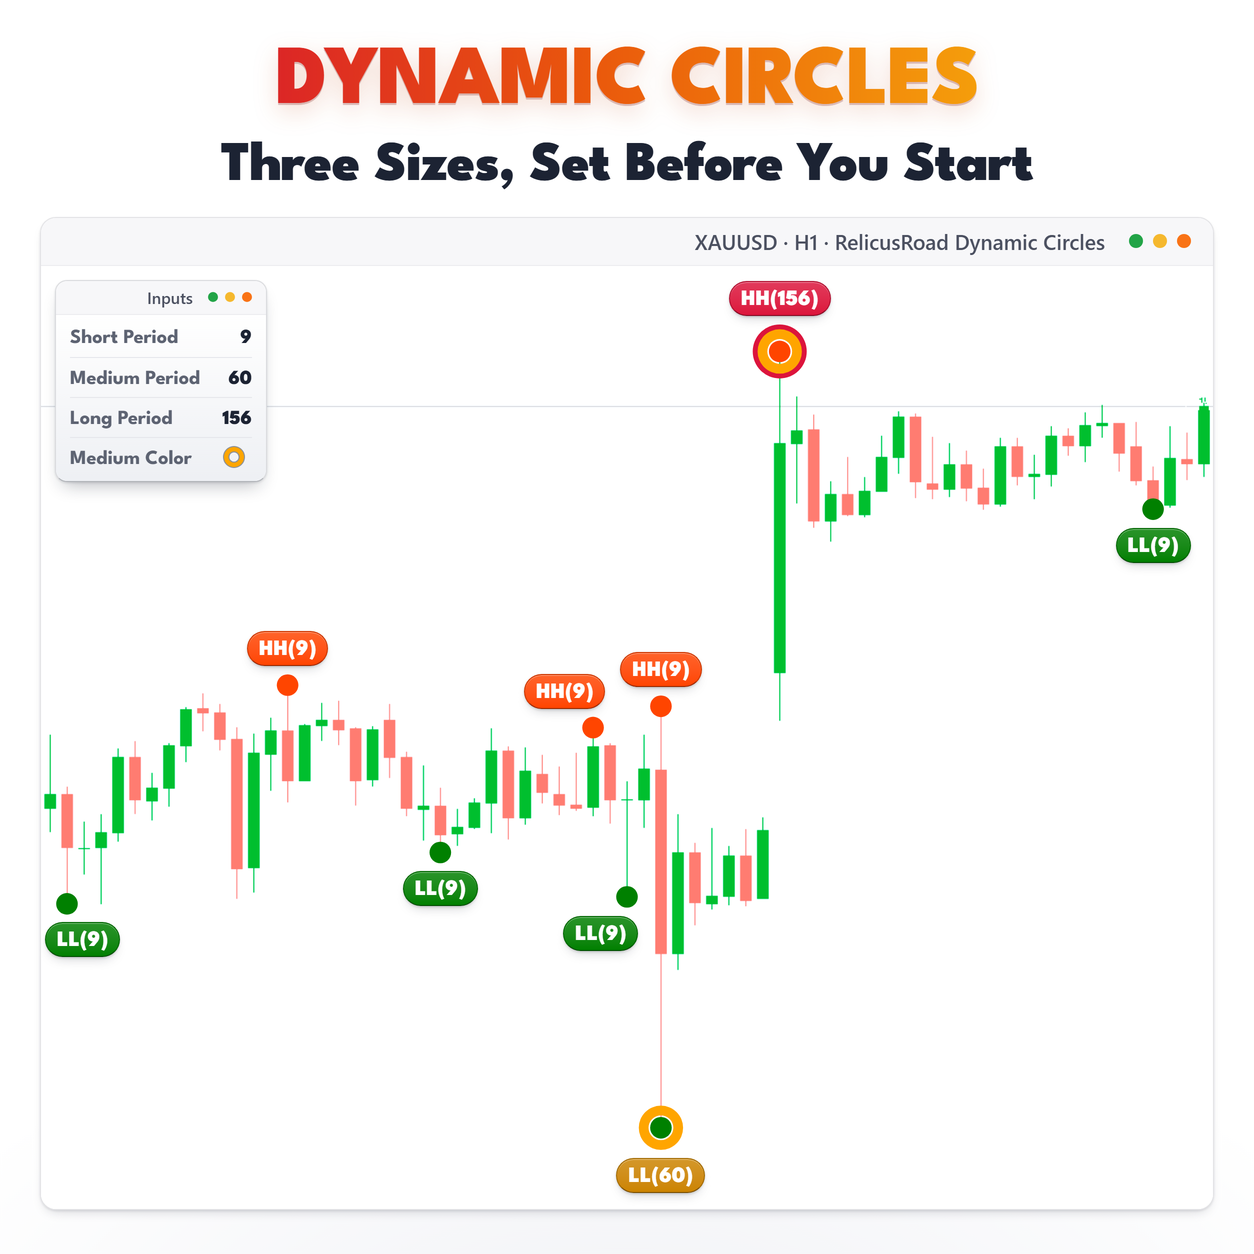
The medium range only marks a bar that was the extreme of a much longer window, so its orange rings appear at four points here while the short marks tag every leg in between.
Those rings are the levels worth writing down. They are where you place a stop behind structure rather than behind the last wiggle, and they stand out without you squinting at the chart.
Picks Out The Turn That Mattered
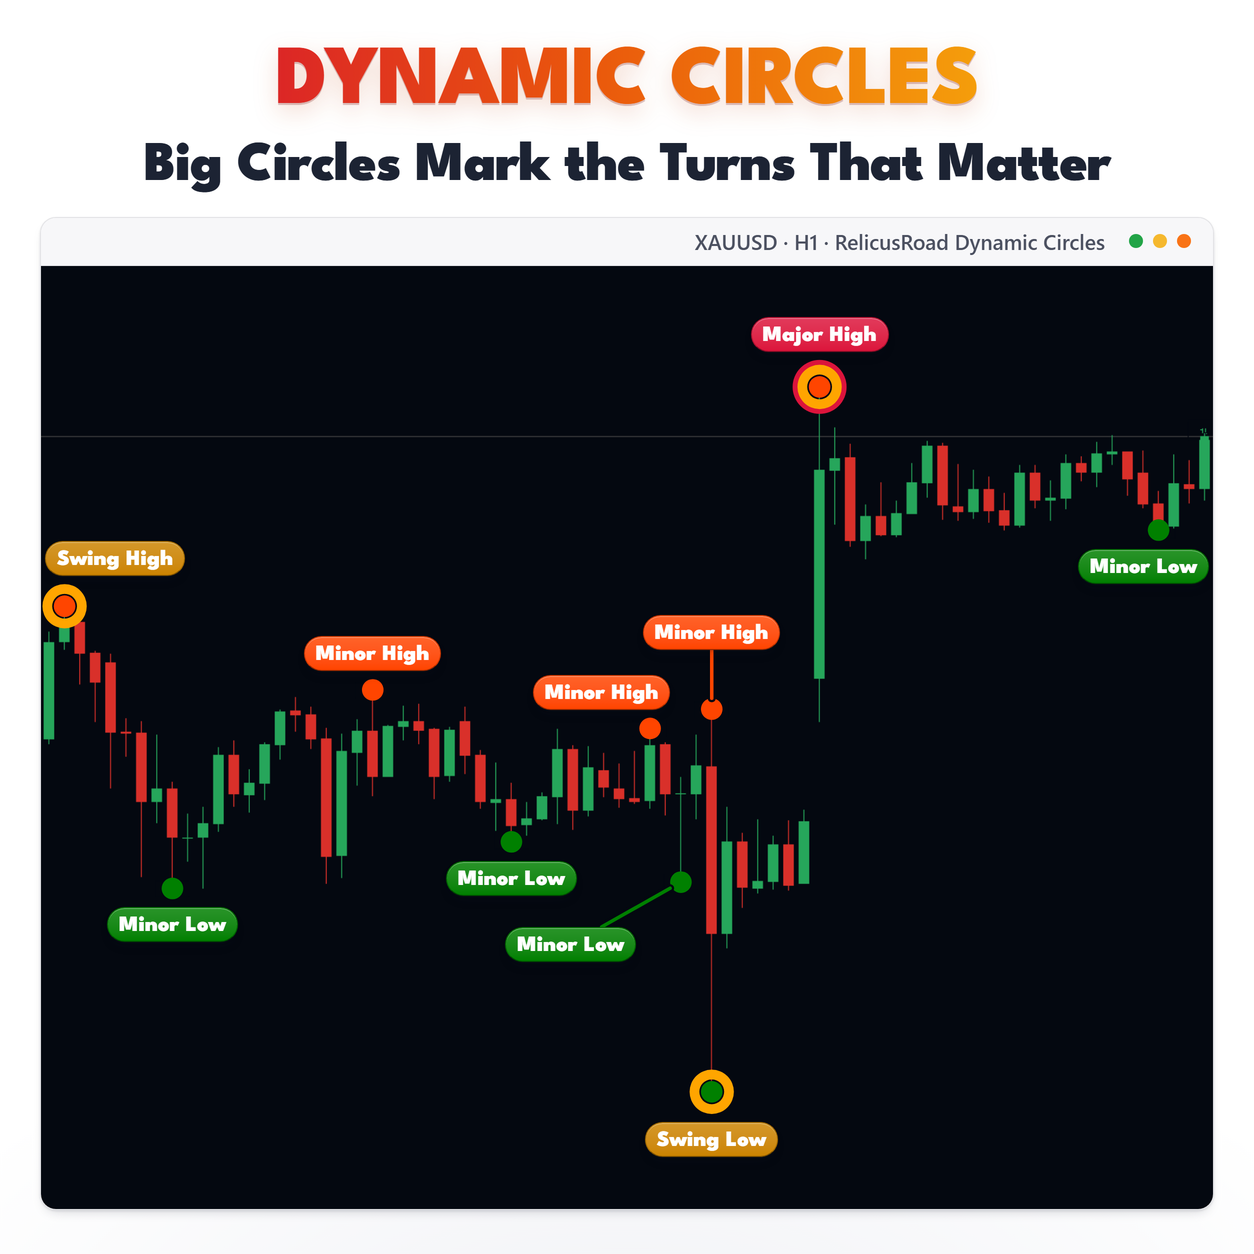
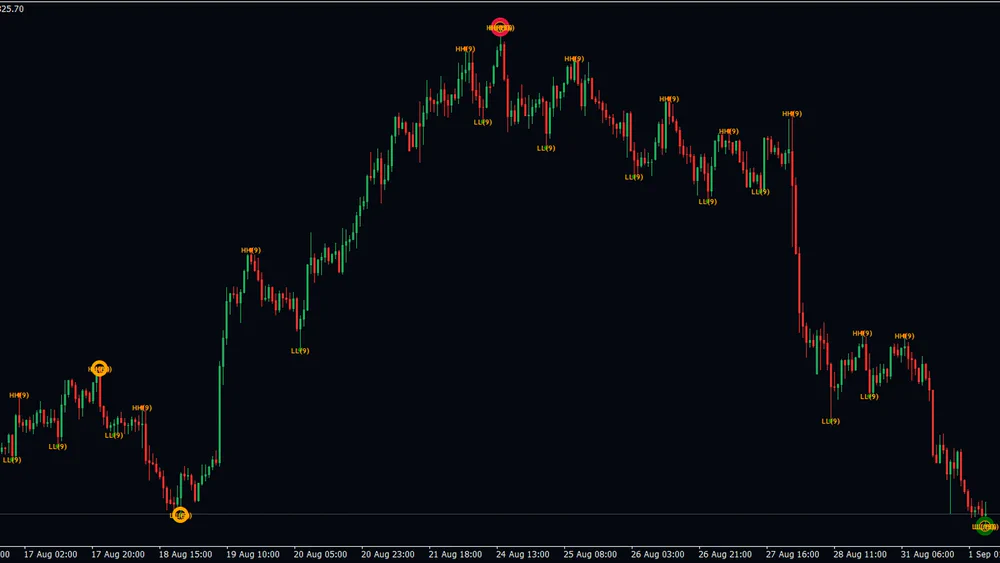
Pulled back to about two weeks of gold, the short range has tagged every leg with an HH or LL label, and only three points carry a ring. Two orange ones sit either side of the mid-August swing, and the large ring sits on the late-August top, where all three ranges mark the same bar and their labels stack on one point.
That ring is the level the whole fortnight turned on, the end of the rally and the start of the sell-off that runs to the green ring at the right edge. It is the one price you would write on a sticky note, and the chart hands it to you without you scrolling back through the history to find it.
Reading It On A Live Chart
Start with the long rings. They are the turns the chart is built around, and a sequence of them stepping up or down is the trend in its simplest form. Because they need an extreme of 156 bars, they are rare, and that is the point.
Medium rings give you the swing structure inside that. Short dots give you the path, every small pullback and pop. They are useful for timing and for trailing, and noisy if you read them as structure.
The interesting bars are the ones carrying all three marks. A turn that is simultaneously the extreme
of 9, 60 and 156 bars is a level worth writing down, and it is usually where the next reaction comes
from. A bar with only a short dot on it rarely deserves the same attention.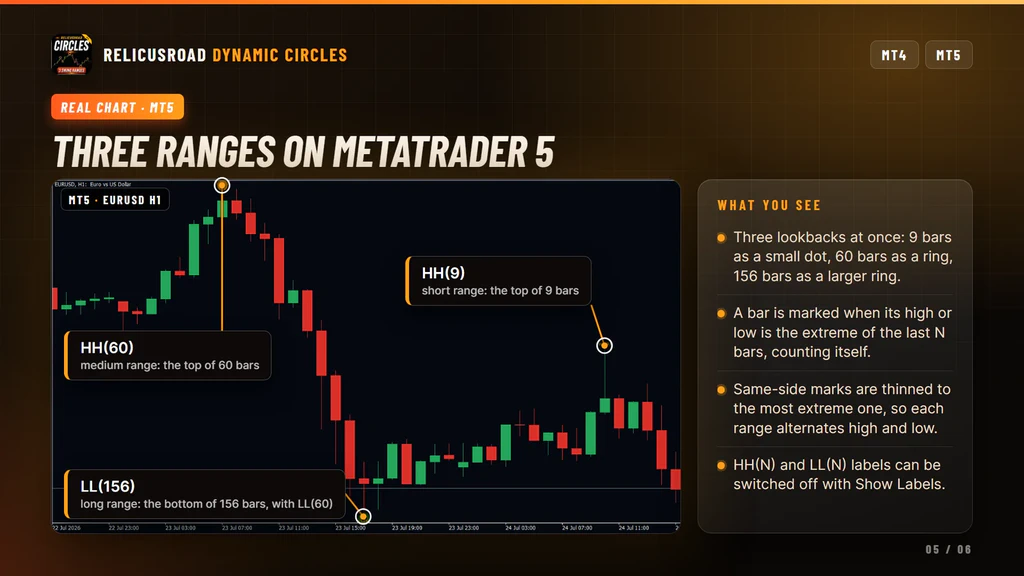
Settings You Can Change
Ranges: Short Period, Medium Period and Long Period, 9, 60 and 156 by default. On daily and weekly charts, lower the long range so it still marks several turns inside the history you can see.
Visibility: each range has its own show switch for highs and for lows, so you can keep long highs and hide short lows if that is how you read a chart. Show Labels turns all the HH and LL text on or off together.
Appearance: a color for each range and side, and a size for each range, 2, 4 and 5 by default. The label style itself is fixed, small orange text in a bold font.
Calculation: History, the number of recent bars calculated, 3000 by default and capped at 5000. The Timeframe input should stay on the current chart.
What It Does Not Do
Worth knowing before you buy:
- It does not confirm swings with bars on both sides. Recent circles can be removed.
- It does not read other timeframes correctly. Leave the Timeframe input alone.
- It does not send alerts in this build, whatever the toggle suggests.
- It has a Performance Mode input that does nothing in this build. Lower History instead if a chart feels slow.
- It does not grade or score the points. The only difference between the three ranges is the lookback length.
Setup In Three Steps
- Buy it on the MQL5 Market and install it from the Market tab of your terminal.
- Drag RelicusRoad Dynamic Circles from Navigator, Indicators, Market onto the chart you trade.
- Set the three ranges for your timeframe and hide the sides you do not want to see.
It runs on forex, gold, indices, stocks and crypto, on any chart timeframe. Circles recalculate when a
new bar opens rather than on every tick, so the chart stays quiet while a bar is forming.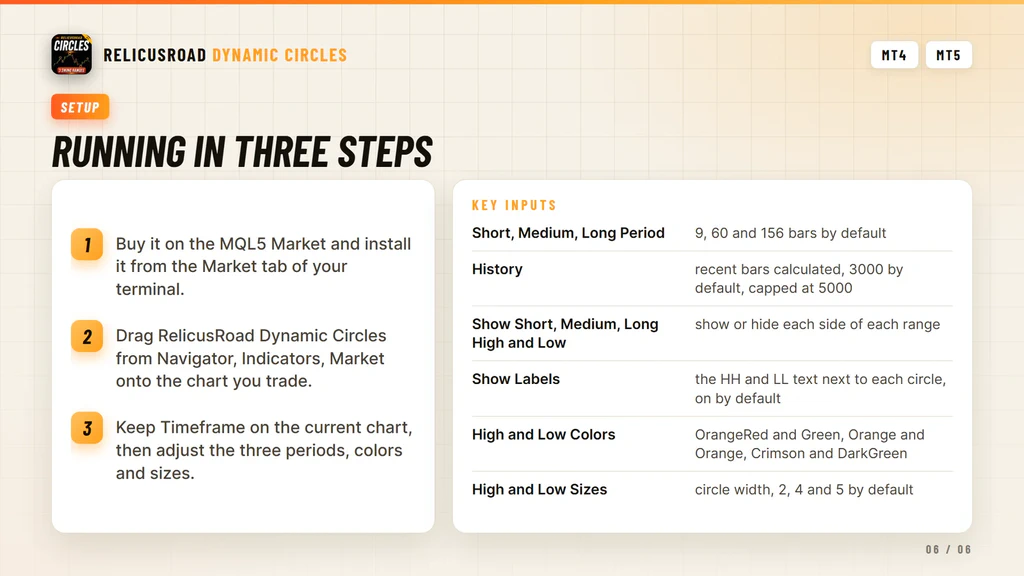
Where It Comes From
Three-range swing marking is the dynamic circles module of RelicusRoad Pro, published on its own for traders who read structure by hand. It runs standalone and needs no other RelicusRoad product. Traders who want those turns turned into zones use Support Resistance, and Trendlines connects confirmed pivots into channels for you.
Support runs through the product comments and the mql5.com messaging system.
Frequently Asked Questions
Everything you need to know about RelicusRoad Dynamic Circles. Still curious? Reach out anytime.
Learn How to Trade It
Every indicator ships with reference documentation and a matching strategy guide. You can also read what other traders say or start with the setup guide.
Indicator Reference
- Road Levels Dynamic S/R levels around a moving center line
- Support & Resistance Advanced S/R zones with alerts
- Action Levels Critical price levels for major moves
- Signal Lines Trend bias filter with two independent lines
- Daily High/Low/Open Daily extremes for range trading
- Daily Pivots Pro pivot points S1-S3, R1-R3
Trading Strategies
- Strategy #1: Price Action (Road) + SR + Trendlines + 2 TFs
- Strategy #2: Local Trendline + Price Position on Road + 2 TFs
- Strategy #3: Arrows + Price Action (Road) + SR
- Strategy #4: MicroScalping + Multiple Pairs + Daily Target 2-10%
Trading Guides
- Non-Repaint Forex Indicators: What 'Non-Repaint' Actually Means (and How to Verify It)
- Prop Firm Challenges: The 'Slow Boring' Strategy to Getting Funded
- Market Sessions Trading: How to Time the 'London-NY Overlap'
- What Is Forex Trading and How Does It Work?
- The Real Cost of Trading Platforms in 2026: A Broker-Neutral Teardown
- Position Sizing: The Boring Math That Keeps Traders Alive
- Forex Trading Psychology: 7 Traps and Process Fixes
Related tools
Single RelicusRoad indicators for MT4 and MT5, each one standalone.



