
What It Does
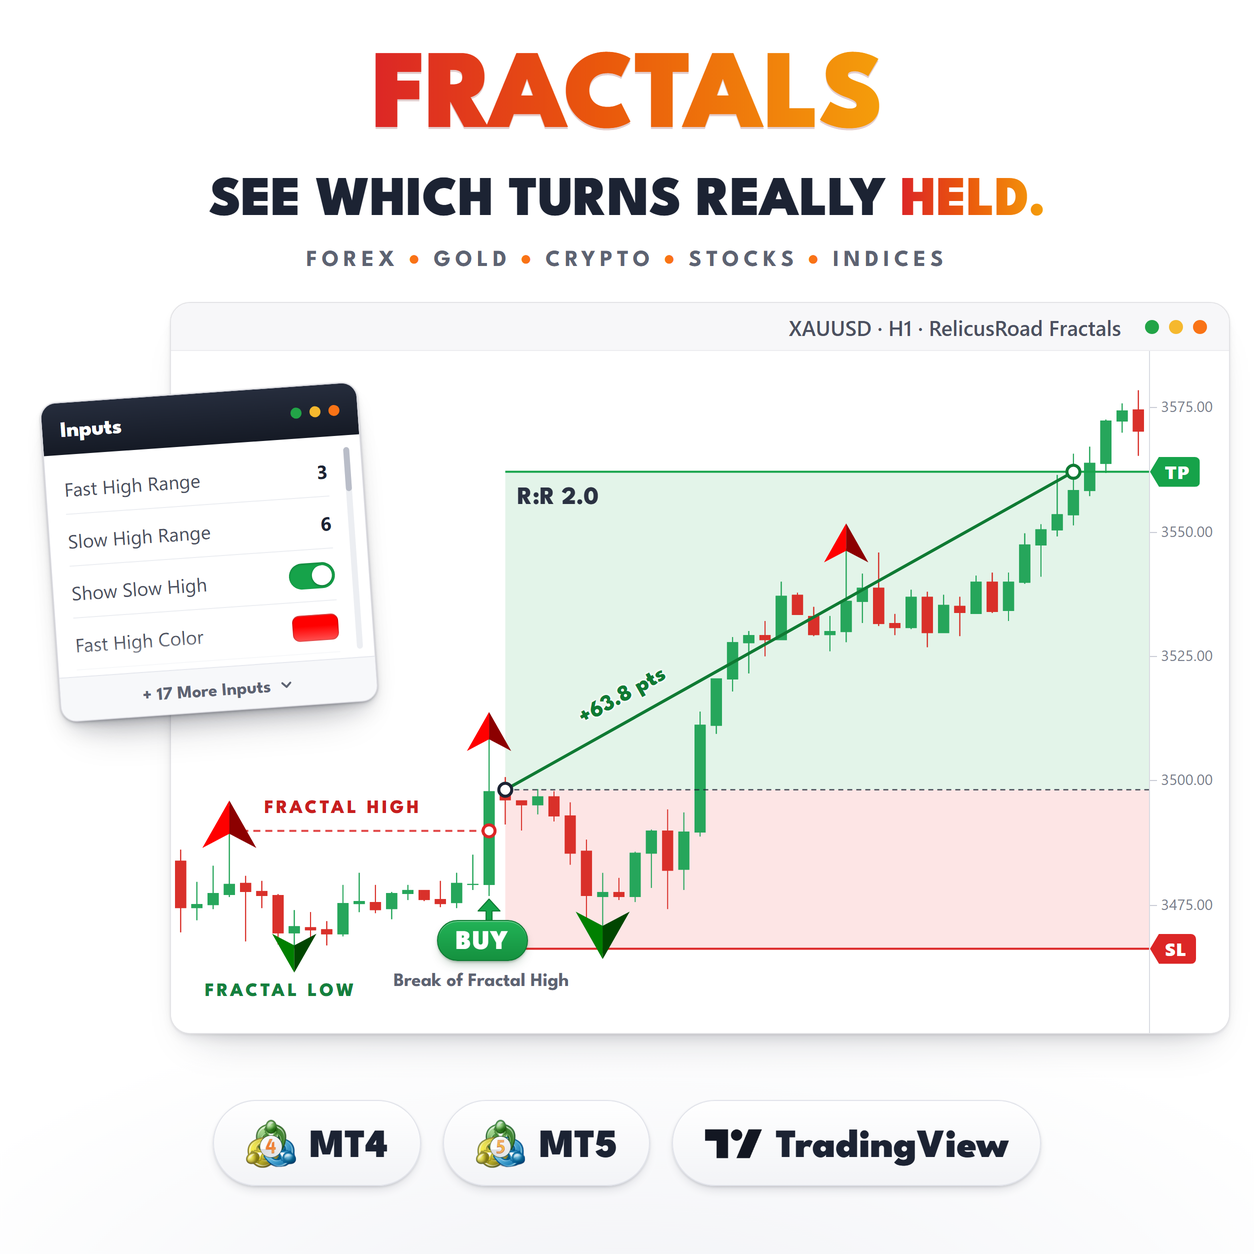
A fractal marks the bar that turned the market. RelicusRoad Fractals runs that test twice on the same chart, at two fixed strengths, and draws the result as an arrowhead at the exact high or low of the swing bar.
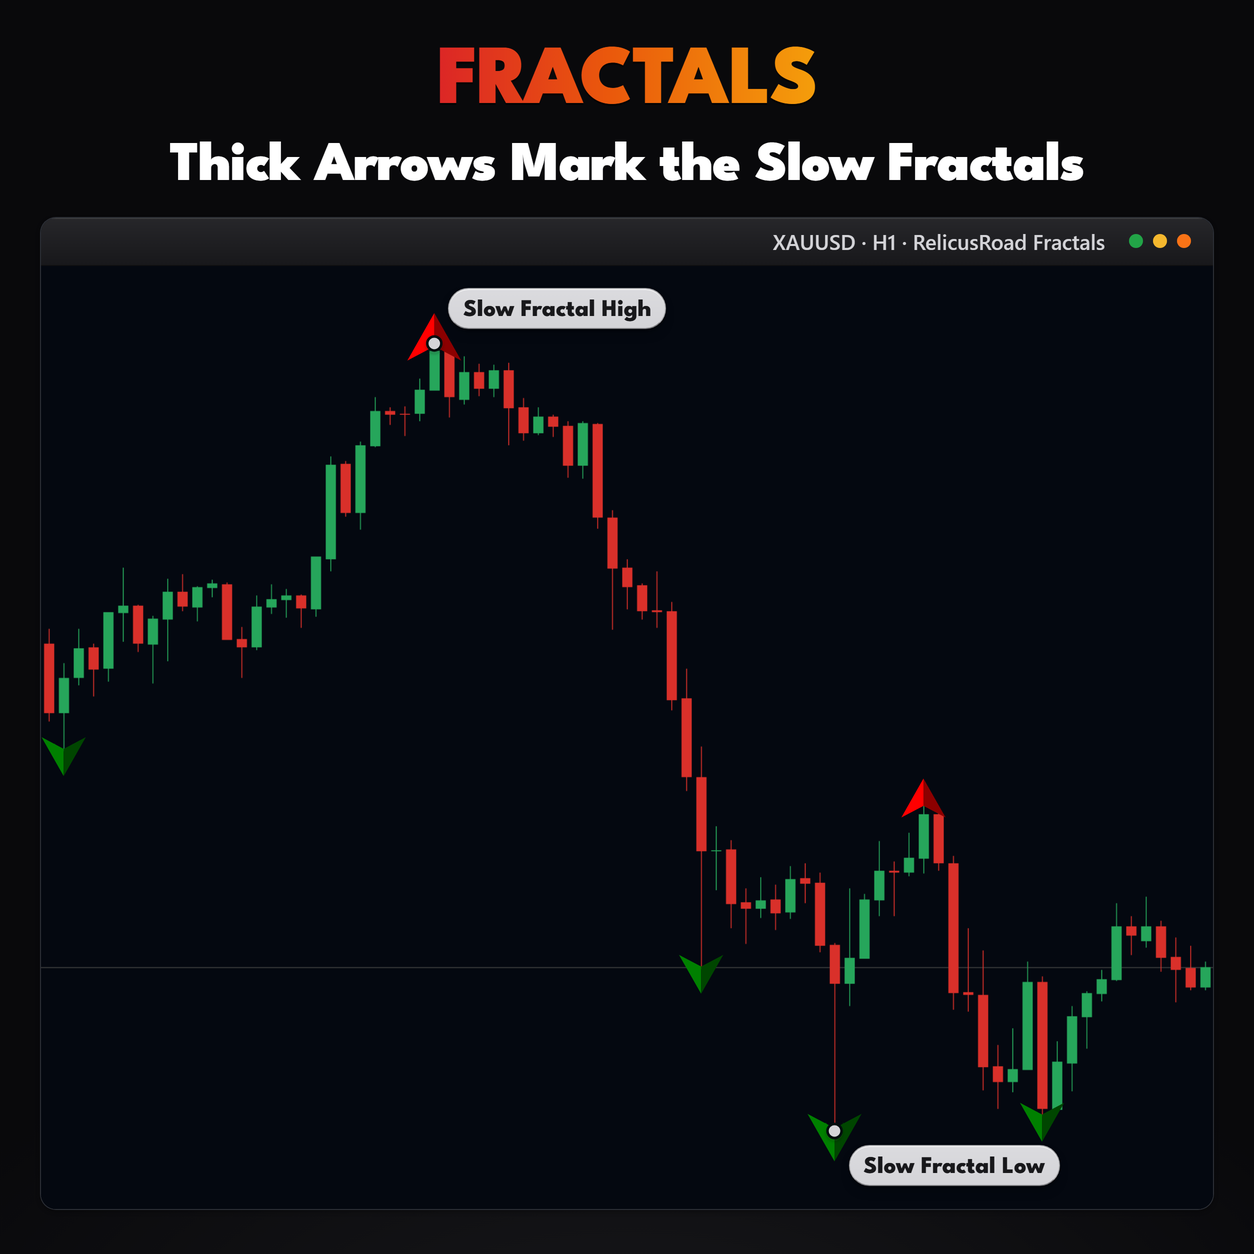
The fast test asks whether a high beat the 7 bars on either side of it. The slow test asks for 15. A 7-bar window on each side already filters out most small wiggles; the slow test asks for more than twice that, so its thicker arrows pick out the swings that held over a much wider stretch of chart. Both run at once, which is the point: you can see at a glance which turns were noise and which ones the market respected.
Nothing else is added. No lines, no boxes, no labels, no panel.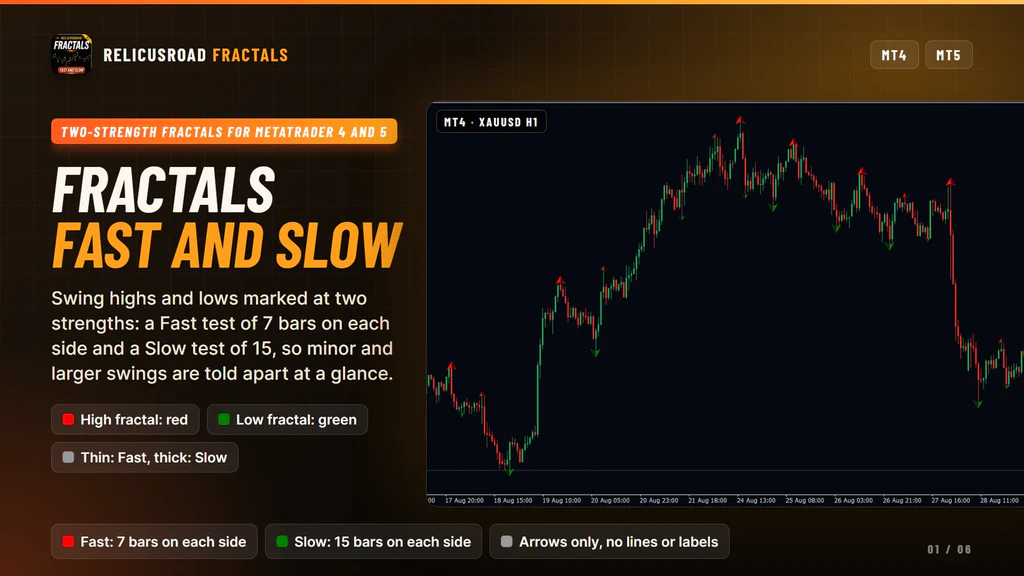
How It Works
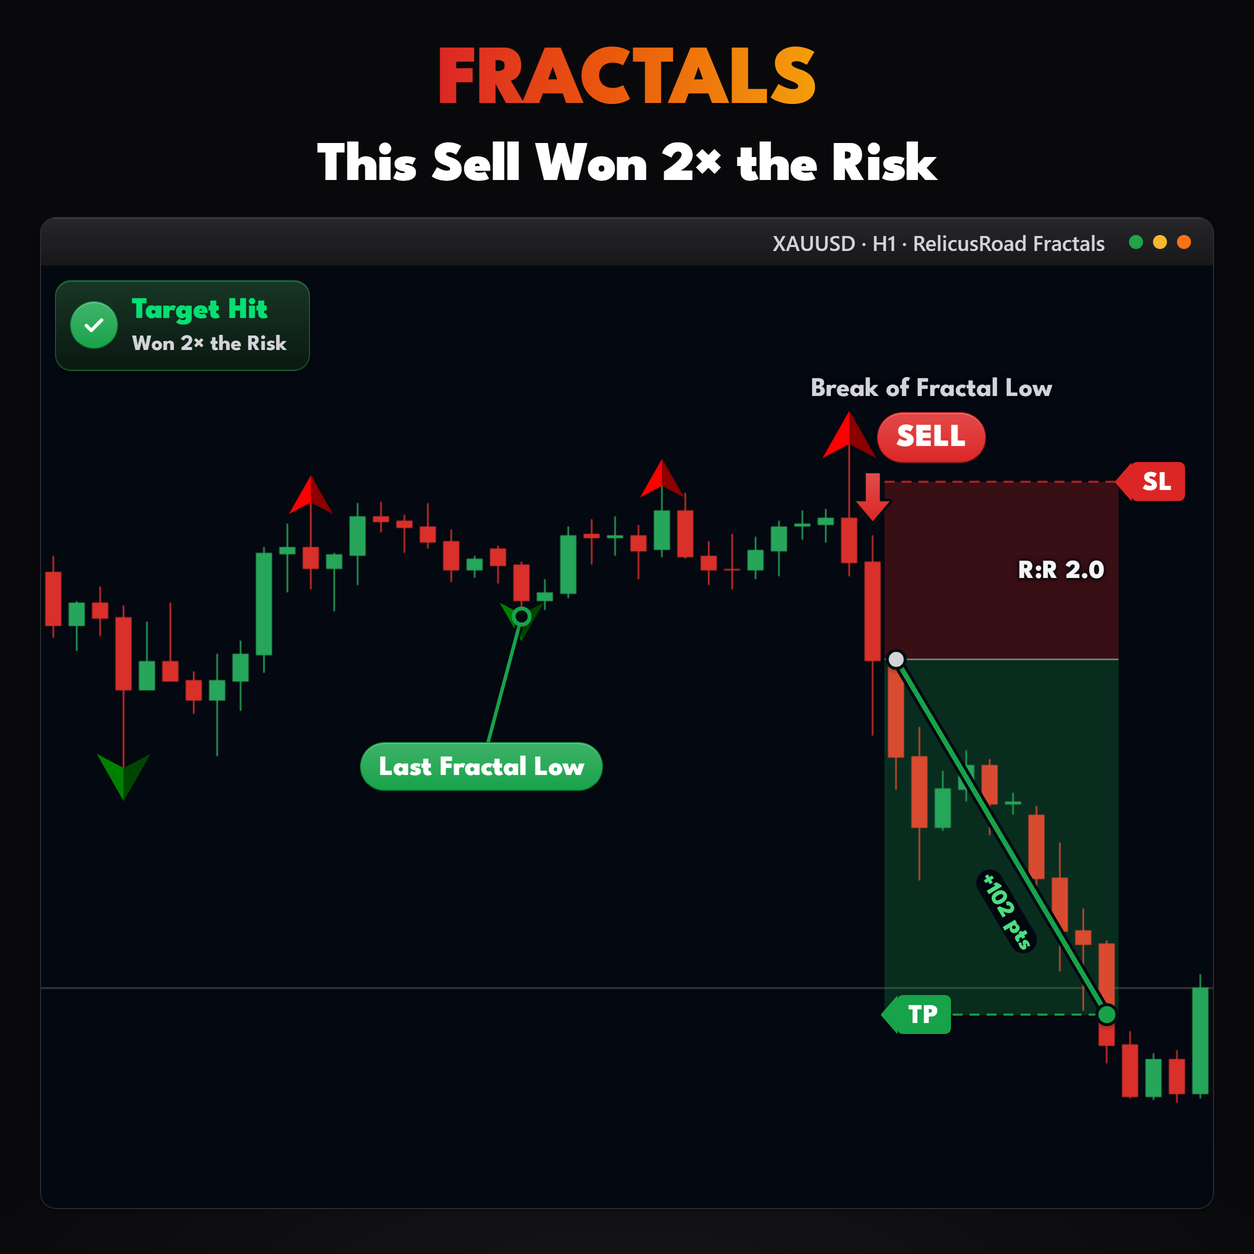
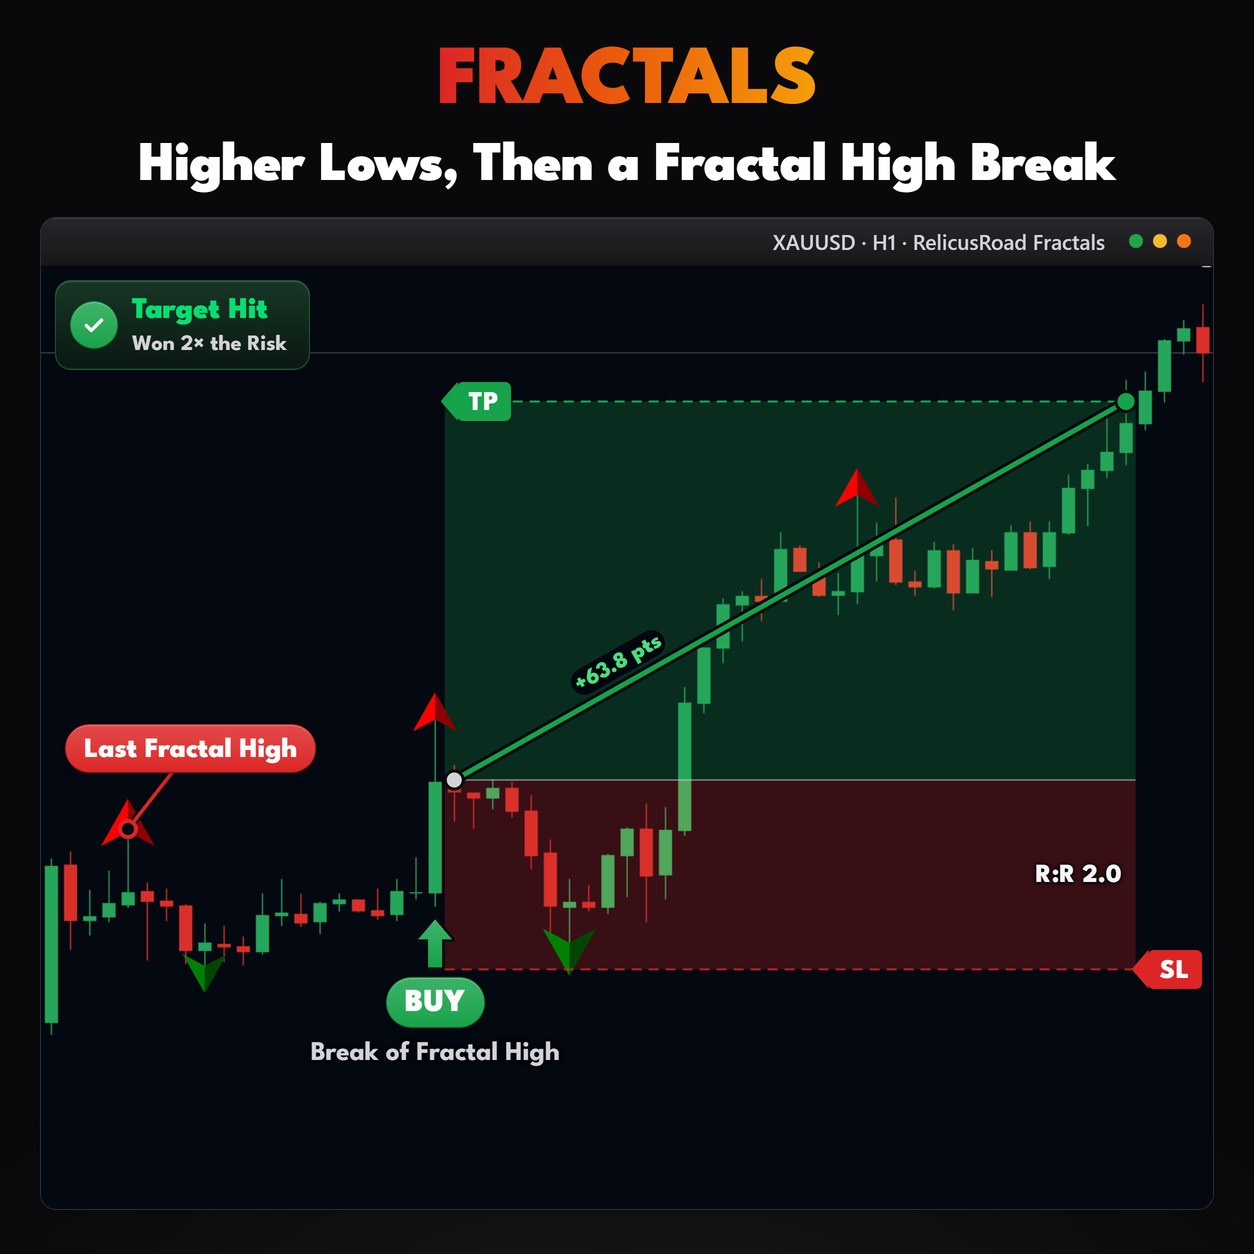
A bar is a high fractal when no bar within the window to its left has a higher high, and no bar within the window to its right has a high that is higher or equal. On a tie, the newer bar takes the mark. Low fractals are the mirror image.
That is the whole rule, applied at two window sizes:
- Fast. The high or low must stand out against 7 bars on each side.
- Slow. The high or low must stand out against 15 bars on each side.
Because the 15-bar window contains the 7-bar window, every slow fractal is also a fast fractal. A
thick arrow always sits on a bar that carries a thin one underneath it.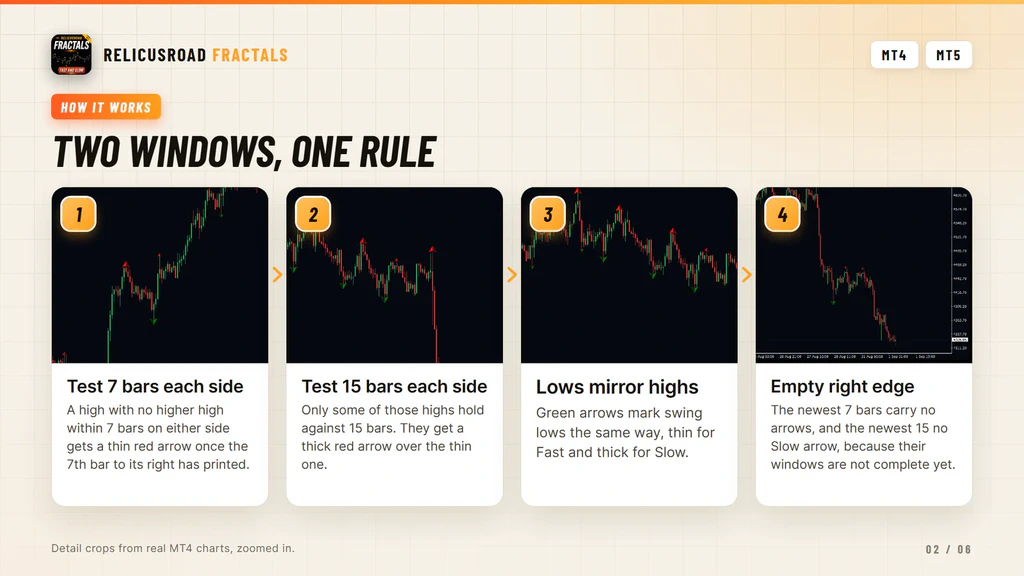
The Delay Is The Feature
The test needs bars on the right, so an arrow cannot appear until those bars exist. The newest possible fast arrow is 7 bars back. The newest possible slow arrow is 15 bars back. The right edge of your chart will always be empty.
Traders new to fractals read that as lag. It is the reason the arrows stay where they printed. An indicator that marks a swing high on the forming bar is guessing, and it takes the mark back when the guess fails. This one waits for the evidence, then commits.
Two honest caveats. A fast arrow is first tested while the newest bar is still forming, so it can
appear and then be removed a bar later, before its window is complete. Once 7 closed bars sit to its
right, it is final. A slow arrow is judged once, at the moment the fifteenth bar to its right opens,
so if that bar then runs past the swing the arrow stays until you reload the chart, and the reload
removes it.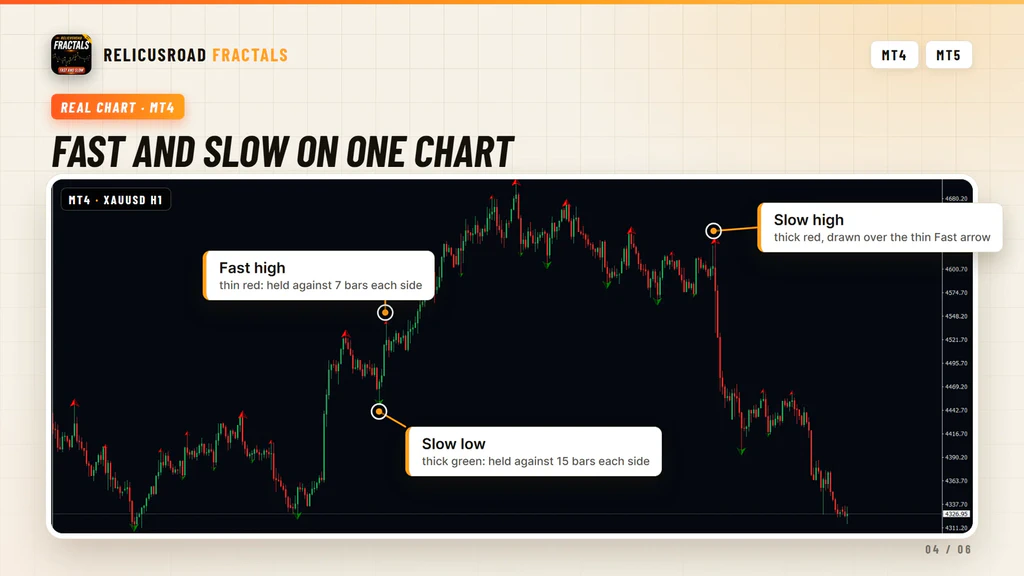
What You See On The Chart
| Marker | Meaning |
|---|---|
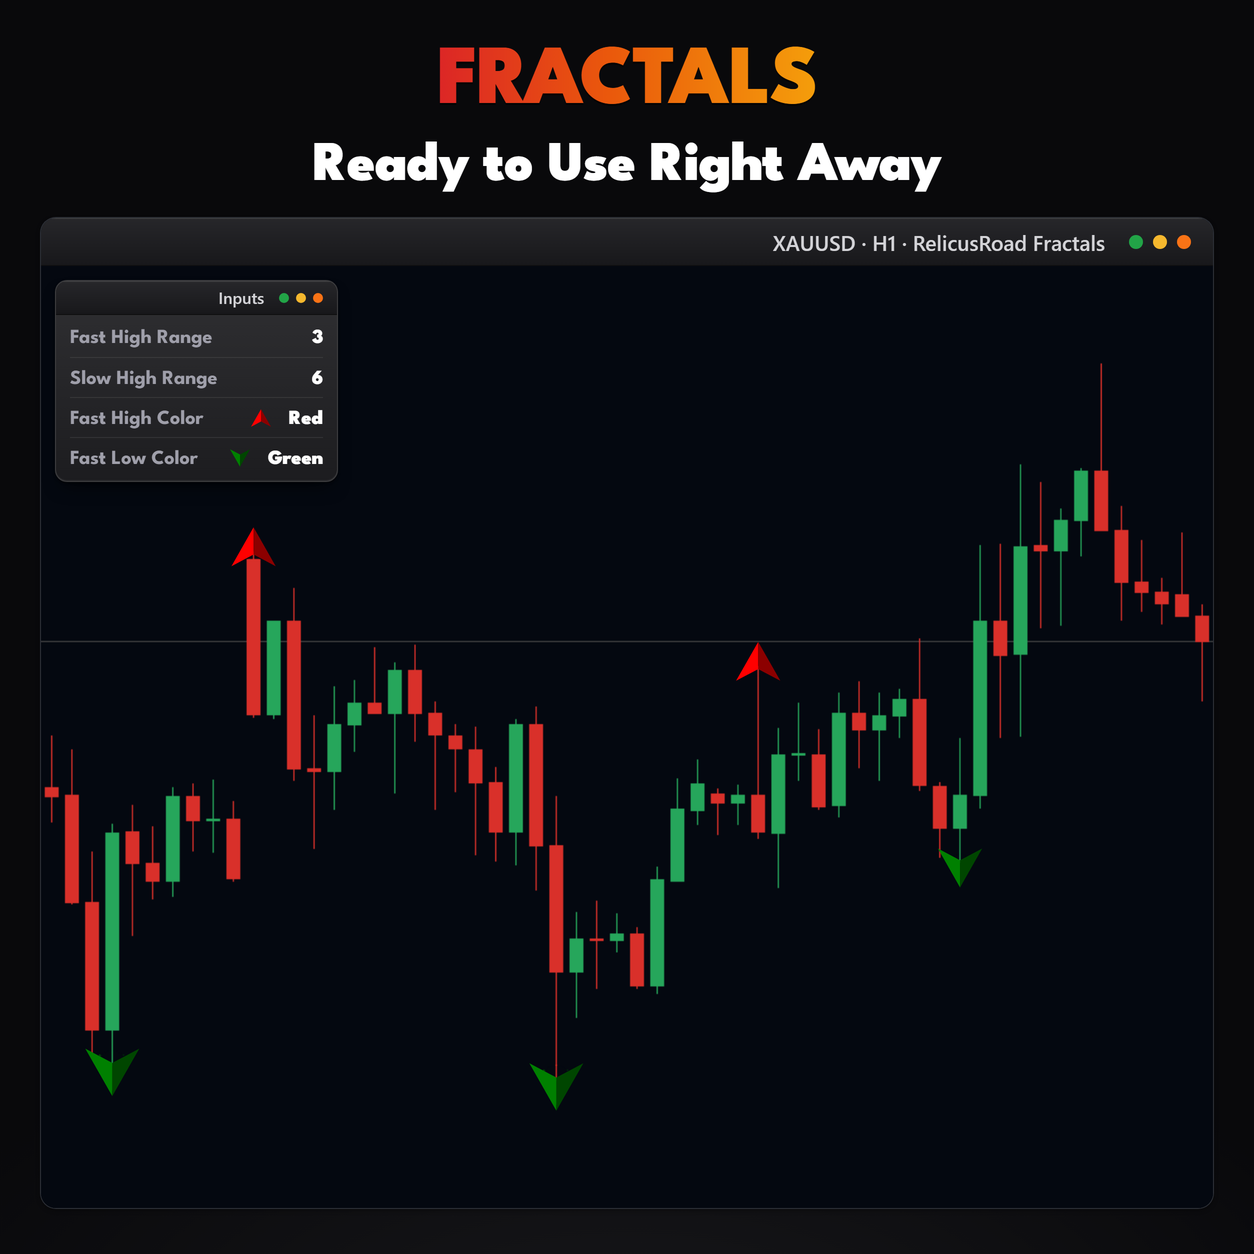
| Thin red arrowhead | Fast swing high, drawn at the exact high of the bar |
| Thin green arrowhead | Fast swing low, at the exact low |
| Thick red arrowhead | Slow swing high, drawn over the thin fast arrow on the same bar |
| Thick green arrowhead | Slow swing low, over the thin fast arrow |
| Empty right edge | The newest bars, whose windows are not complete yet |
- Thin red arrowhead
- Fast swing high, drawn at the exact high of the bar
- Thin green arrowhead
- Fast swing low, at the exact low
- Thick red arrowhead
- Slow swing high, drawn over the thin fast arrow on the same bar
- Thick green arrowhead
- Slow swing low, over the thin fast arrow
- Empty right edge
- The newest bars, whose windows are not complete yet
With the default settings, fast and slow share the same glyph and color and differ only in width,
1 against 3. If you want the two strengths easier to separate at a glance, give the slow arrows their
own color. It takes ten seconds in the settings dialog.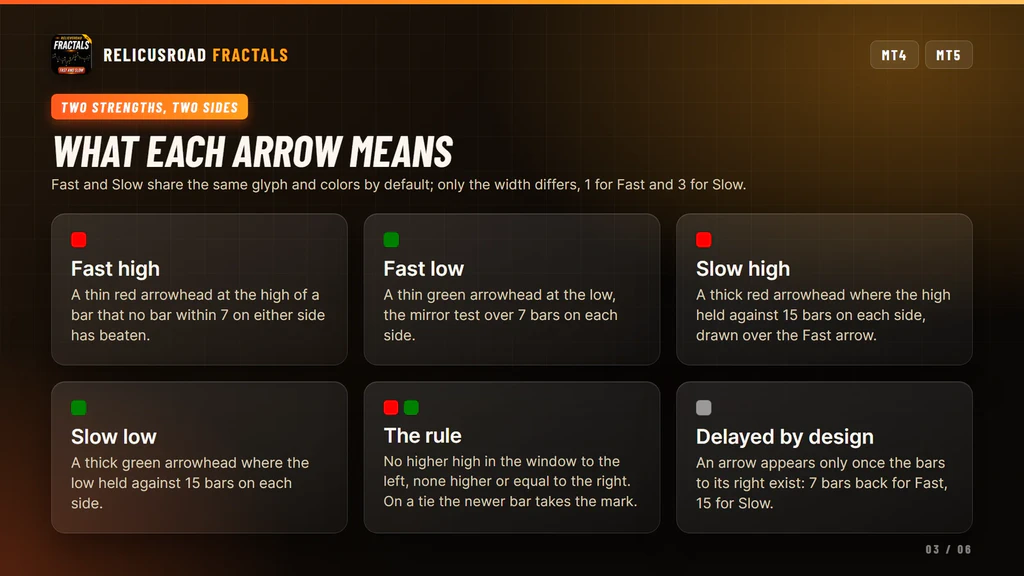
What It Does For Your Trading
Four things, each one you can check on the chart before you trust it.
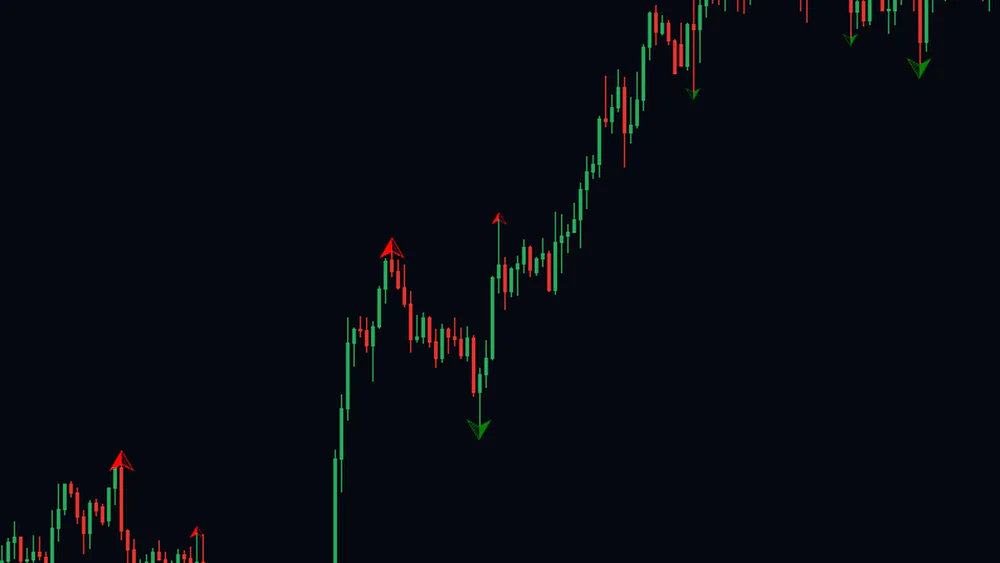
Marks The Turns You Would Have Drawn Anyway
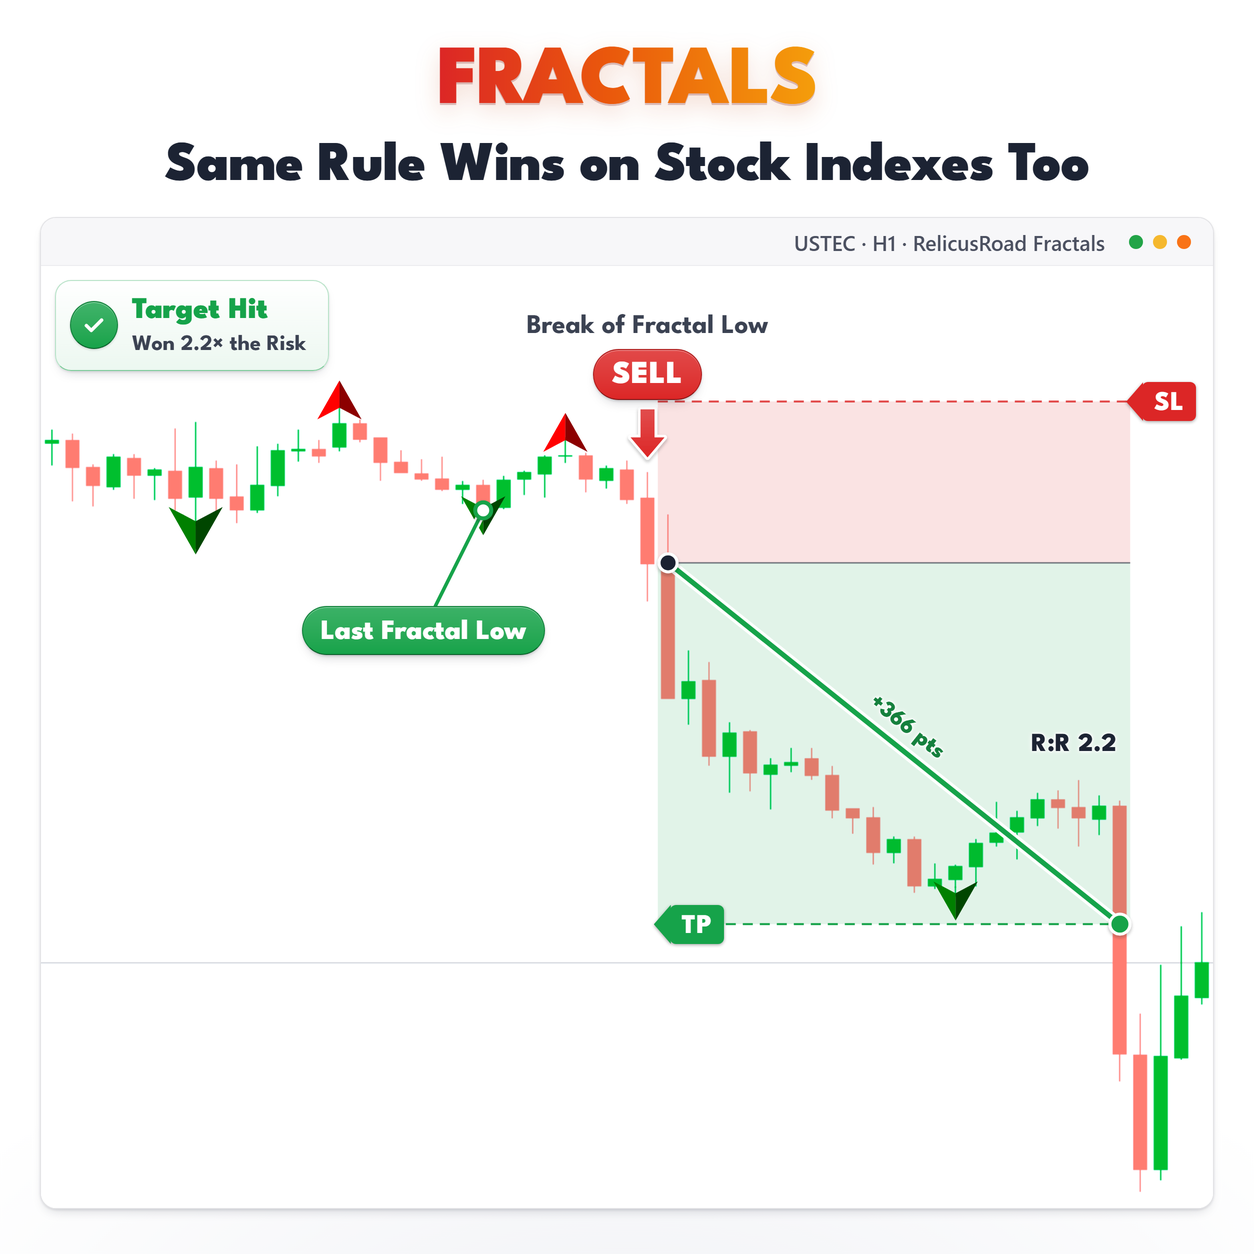
A high with no higher high within seven bars on either side gets a thin red arrow, once the seventh bar to its right has printed. That is the swing you would have marked by eye, found the same way every time, on every symbol you open.
Stop hunting for the pivot. It is already on the chart when you get there.
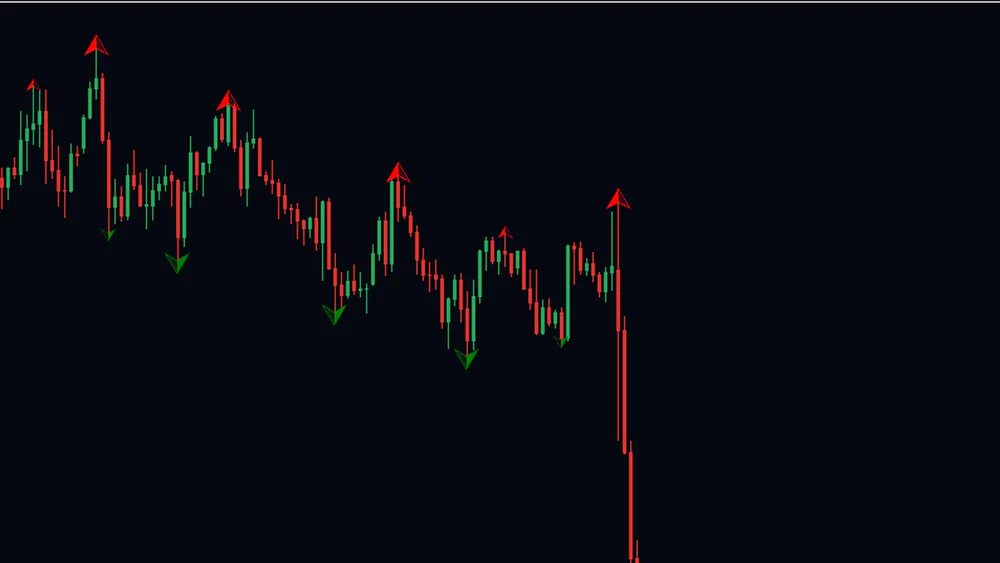
Separates A Real Swing From A Wiggle
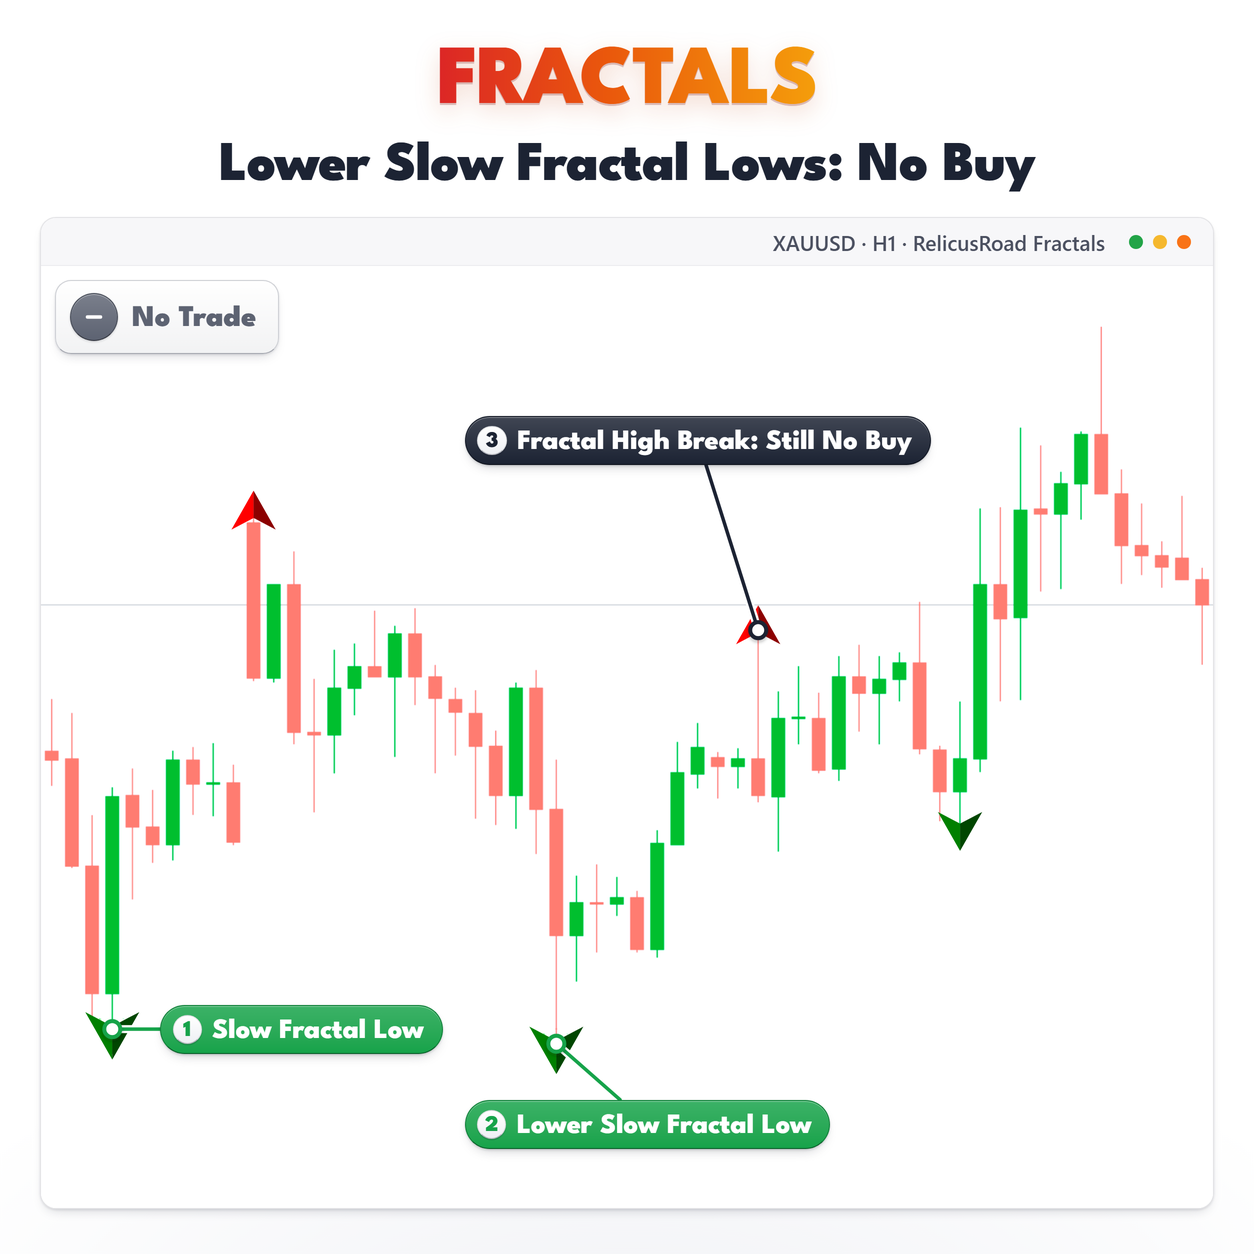
Only some of those highs hold against fifteen bars. Those get a thick arrow drawn over the thin one, so the chart tells you at a glance which turns the market actually respected.
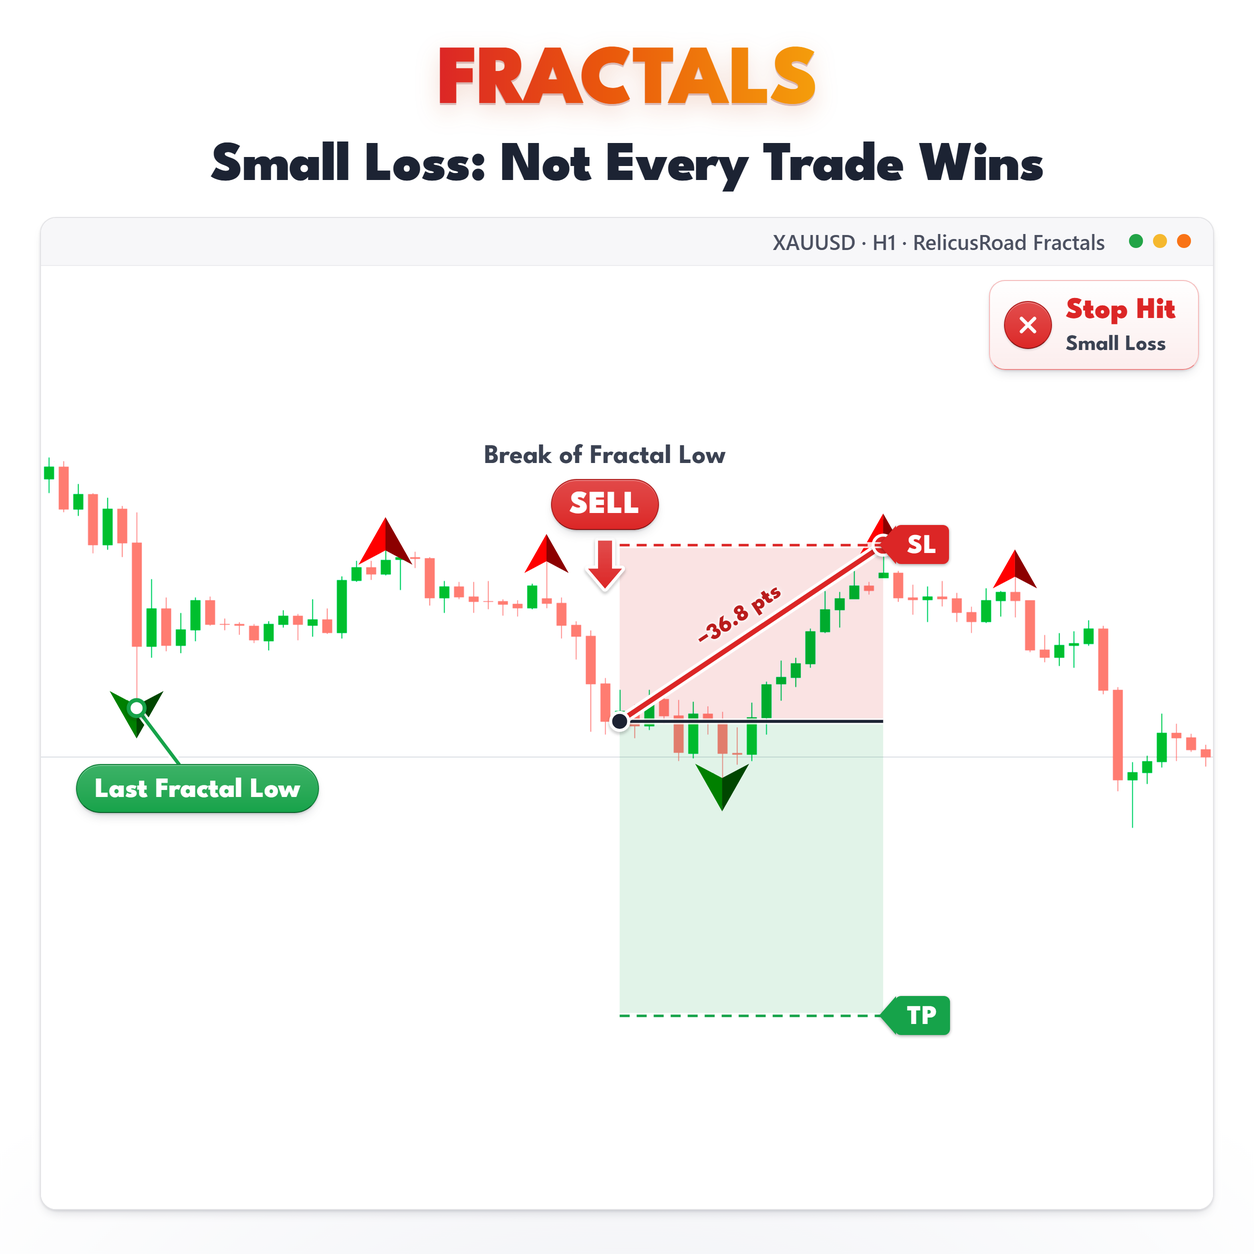
This is the difference between a stop placed behind noise and a stop placed behind structure.
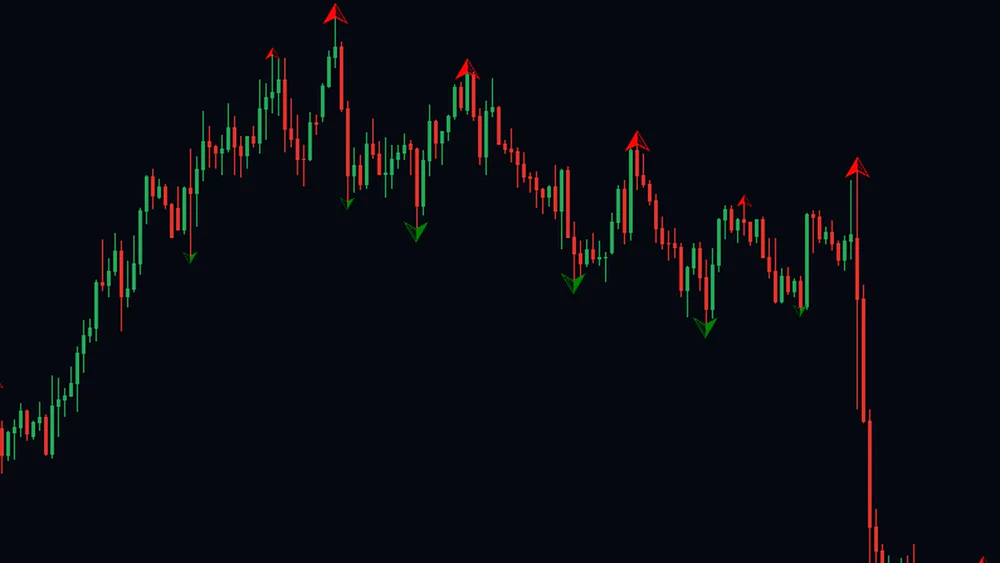
Gives You Both Sides Of The Range
Green arrows mark swing lows on the same rule, thin for fast and thick for slow. Highs and lows together give you the two edges you need for a range, a break, or a measured move.
Read the sequence and you have the trend named for you: thick highs stepping down with thick lows doing the same is not a judgment call.
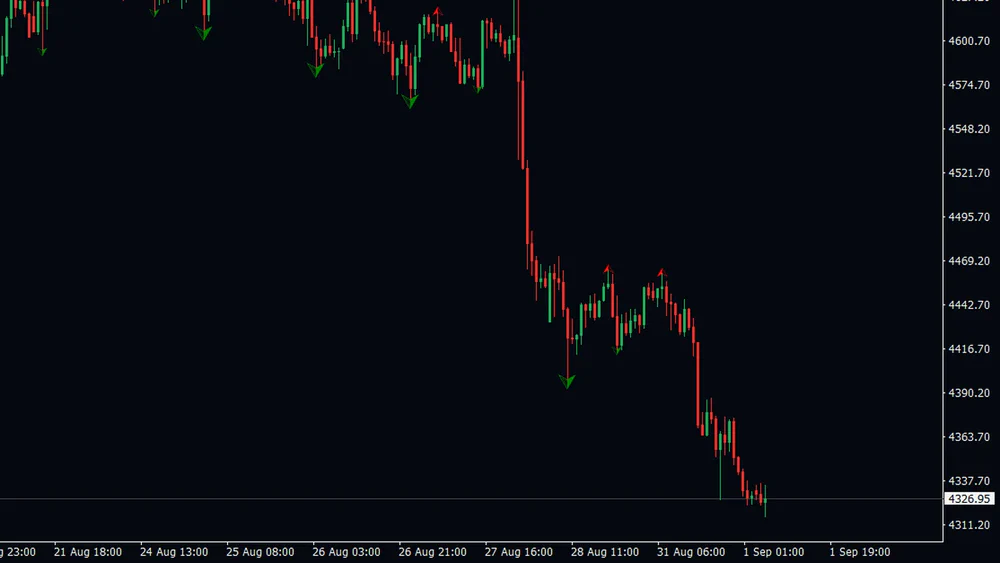
Tells You When It Does Not Know Yet
The newest seven bars carry no fast arrow and the newest fifteen no slow arrow, because their windows are not complete. The right edge stays empty on purpose.
An indicator that marks the turn on the forming bar is guessing, and it takes the mark back when the guess fails. This one waits, then commits, so what you see in your screenshots is what was on the chart at the time.
Reading It On A Live Chart
A thin arrow on its own is a minor swing: the market turned, but only against seven bars of context. A thick arrow marks a point that held against fifteen bars on each side, which is the kind of level traders use for structure and for stop placement.
Sequences matter more than single arrows. Thick highs stepping down while thick lows also step down
is a trend you can name. Thick arrows clustering at one price is a level the market has tested more
than once.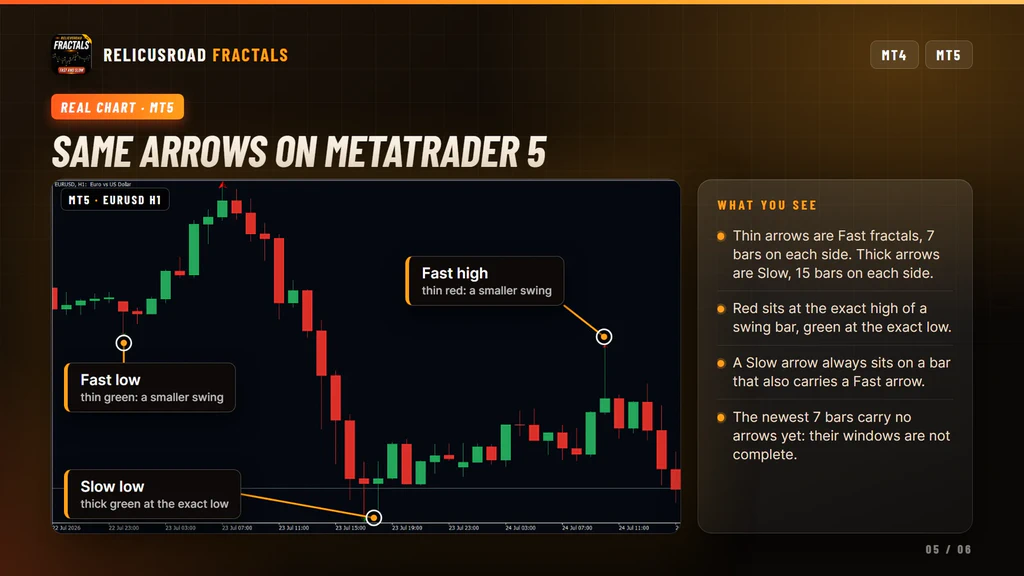
Settings You Can Change
Fast arrows: fast high color (red by default), fast low color (green), fast high size and fast low size (arrow width, 1 by default).
Slow arrows and history: slow high color (red), slow low color (green), slow high size and slow low size (width, 3 by default), and history, the number of recent bars calculated, 3000 by default and capped at 5000.
That is the complete list. The two windows are fixed at 7 and 15 bars, and there is no timeframe input: the arrows always describe the swings of the chart you attached it to.
What It Does Not Do
Worth knowing before you install:
- It does not adjust the windows. Both strengths are fixed in this build.
- It does not read a higher timeframe. Attach a second chart, or use Multi Timeframe Levels for that job.
- It does not send alerts in this build.
- It does not tell you where to enter or exit. It marks structure; the decision stays yours.
- It does not mark the newest swings, by design, until their windows fill.
Setup In Three Steps
- Buy it on the MQL5 Market and install it from the Market tab of your terminal.
- Drag RelicusRoad Fractals from Navigator, Indicators, Market onto the timeframe you want to map.
- Give the slow arrows a different color if you want the two strengths easier to tell apart.
It runs on forex, gold, indices, stocks and crypto, on any chart timeframe. Let the chart load enough
history for the windows to fill before you read the output. The calculation runs when a new bar
opens, not on every tick.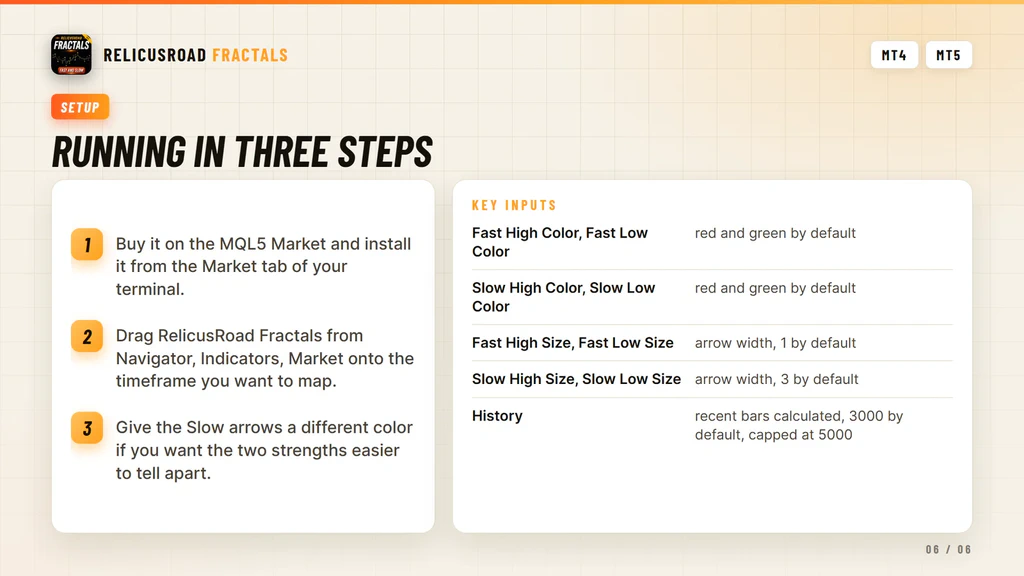
Where It Comes From
Two-strength fractal detection is the swing engine underneath several RelicusRoad Pro modules. This is that engine on its own, for traders who map structure with fractals and do not need the rest of the system. It runs standalone and needs no other RelicusRoad product.
Support runs through the product comments and the mql5.com messaging system.
Frequently Asked Questions
Everything you need to know about RelicusRoad Fractals. Still curious? Reach out anytime.
Learn How to Trade It
Every indicator ships with reference documentation and a matching strategy guide. You can also read what other traders say or start with the setup guide.
Indicator Reference
- Road Levels Dynamic S/R levels around a moving center line
- Support & Resistance Advanced S/R zones with alerts
- Action Levels Critical price levels for major moves
- Signal Lines Trend bias filter with two independent lines
- Daily High/Low/Open Daily extremes for range trading
- Daily Pivots Pro pivot points S1-S3, R1-R3
Trading Strategies
- Strategy #1: Price Action (Road) + SR + Trendlines + 2 TFs
- Strategy #2: Local Trendline + Price Position on Road + 2 TFs
- Strategy #3: Arrows + Price Action (Road) + SR
- Strategy #4: MicroScalping + Multiple Pairs + Daily Target 2-10%
Trading Guides
- Non-Repaint Forex Indicators: What 'Non-Repaint' Actually Means (and How to Verify It)
- Prop Firm Challenges: The 'Slow Boring' Strategy to Getting Funded
- Market Sessions Trading: How to Time the 'London-NY Overlap'
- What Is Forex Trading and How Does It Work?
- The Real Cost of Trading Platforms in 2026: A Broker-Neutral Teardown
- Position Sizing: The Boring Math That Keeps Traders Alive
- Forex Trading Psychology: 7 Traps and Process Fixes
Related tools
Single RelicusRoad indicators for MT4 and MT5, each one standalone.



