
What It Does
The swing levels that matter most are usually on a chart you are not looking at. You trade M15, the level that stops the move is the last weekly swing high, and you find out afterwards.
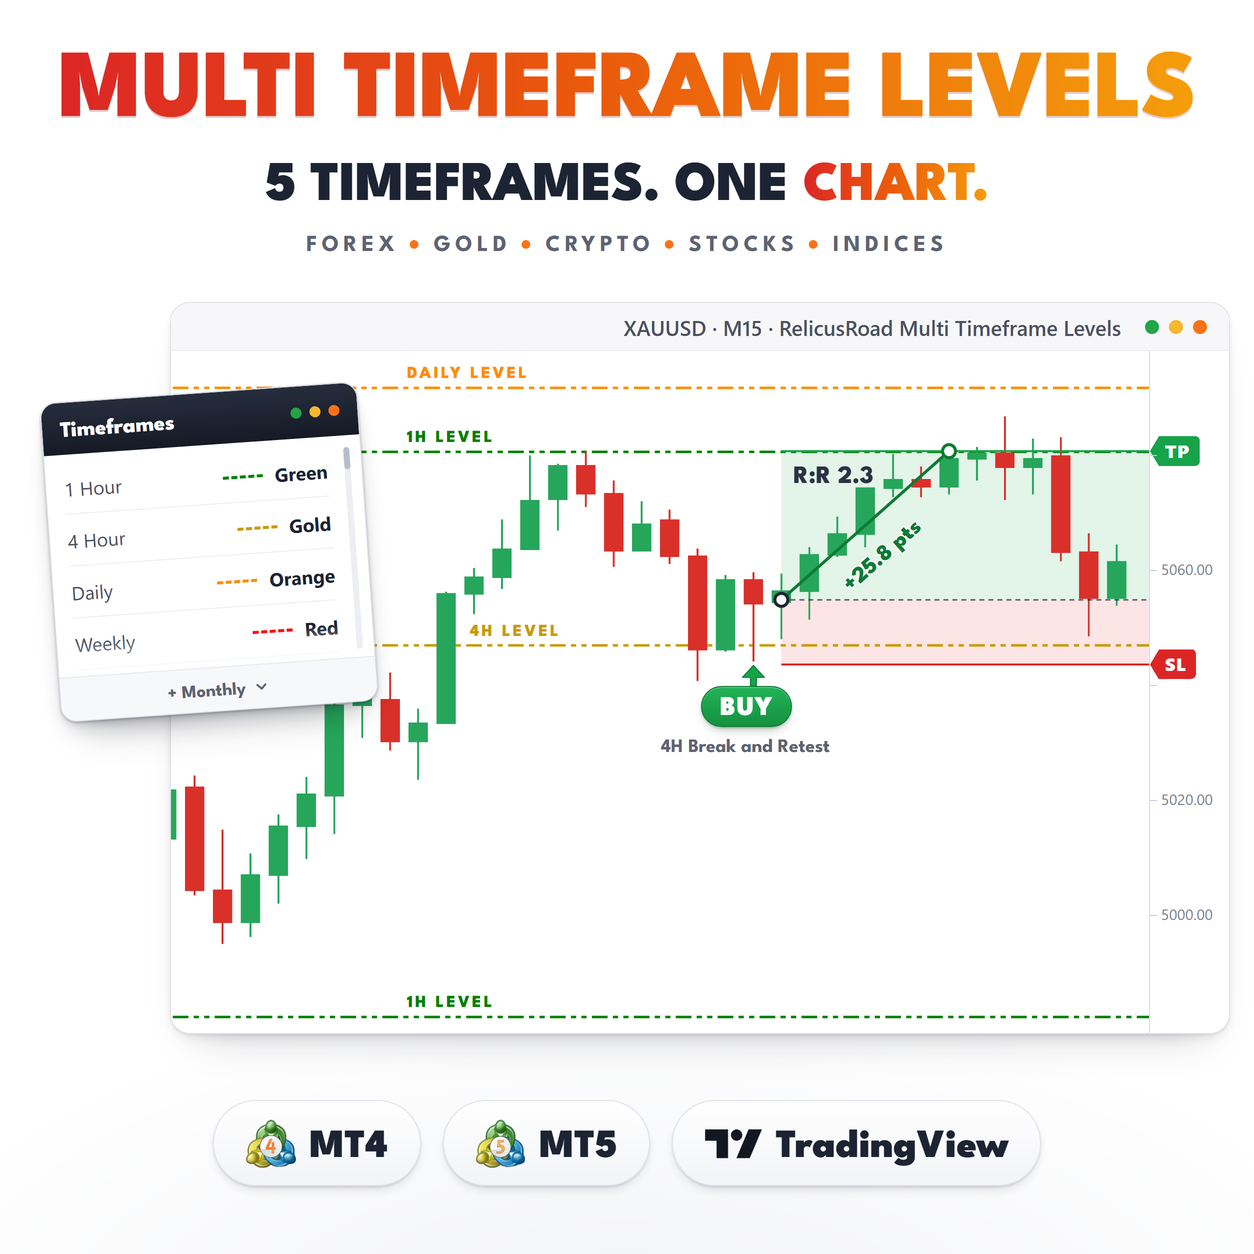
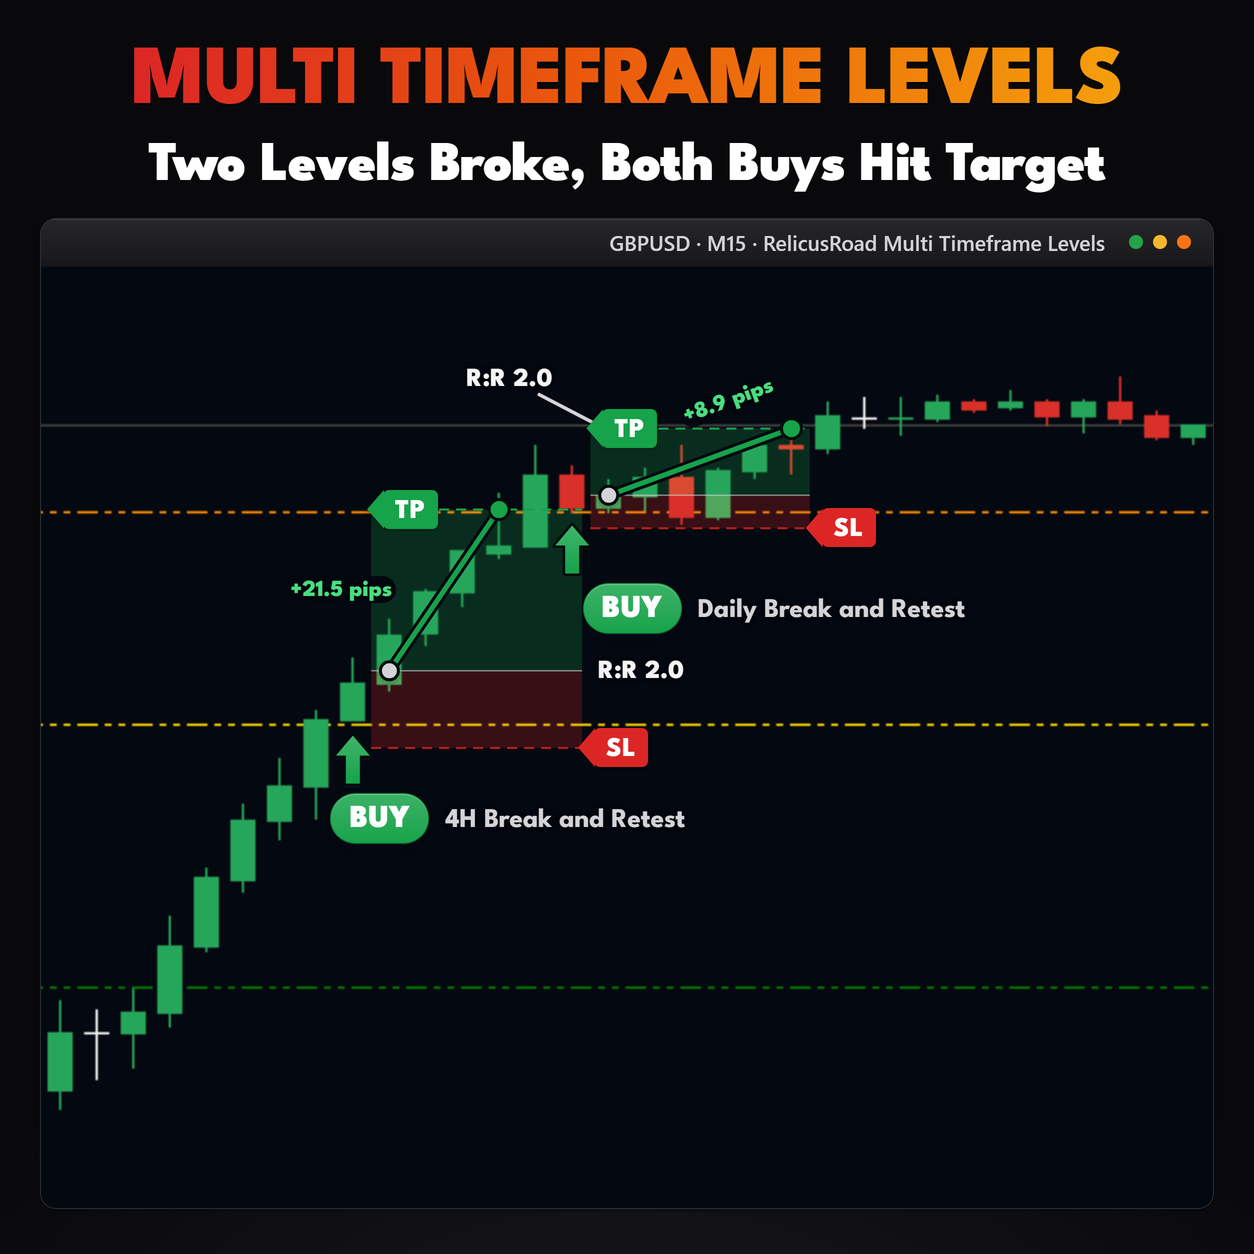
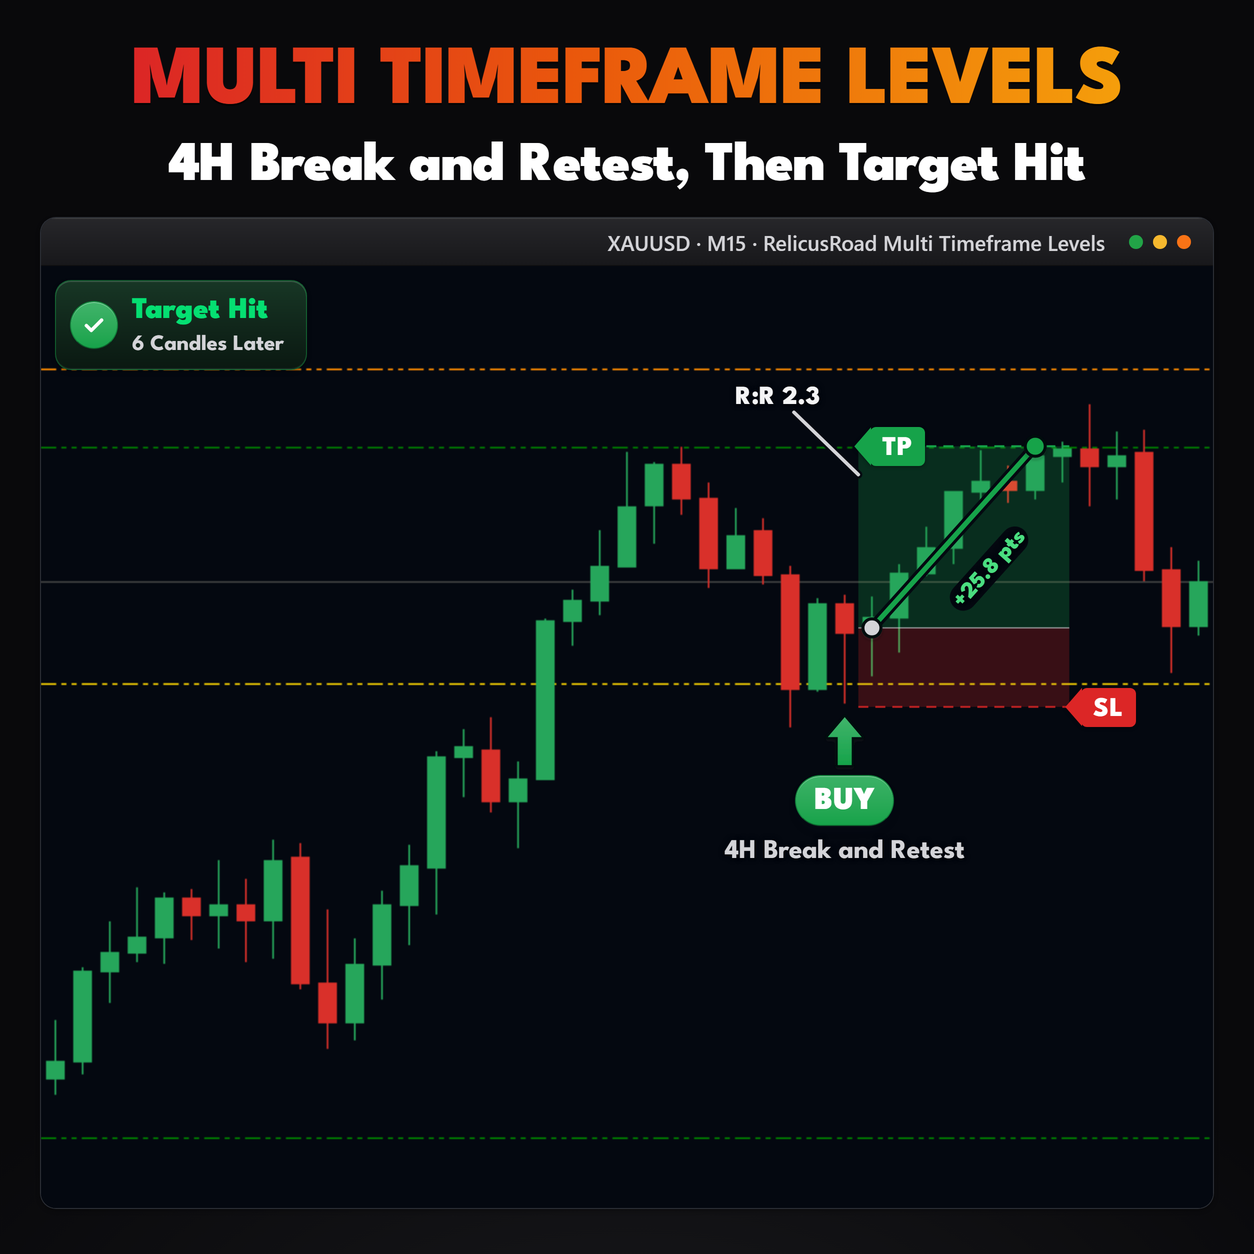
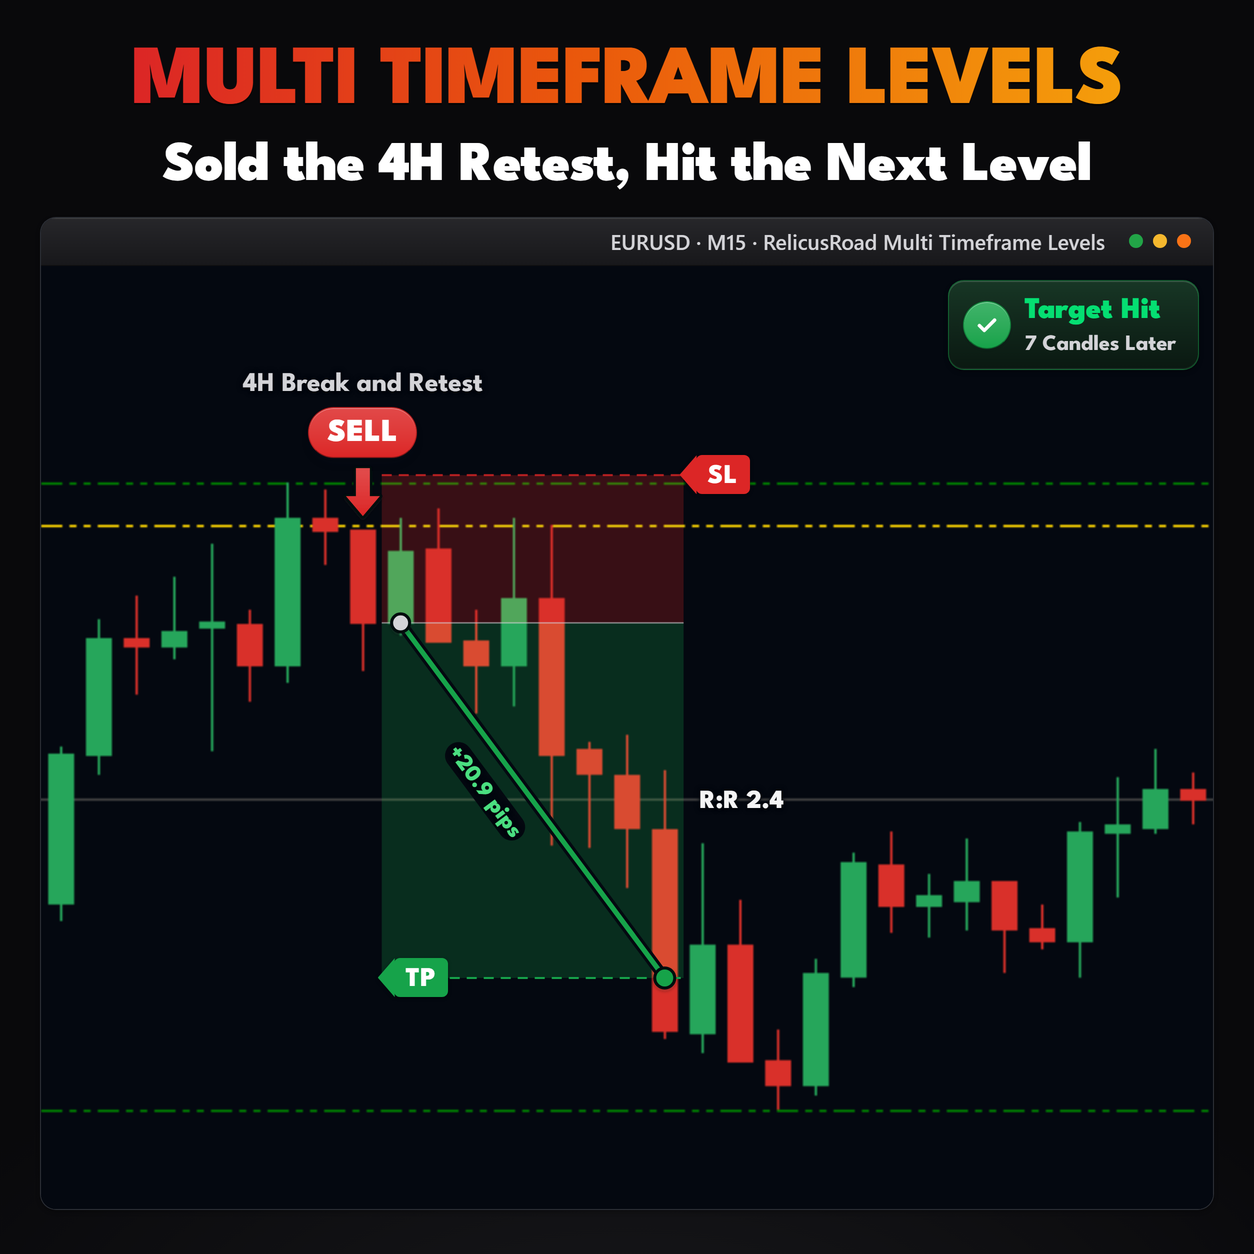
RelicusRoad Multi Timeframe Levels puts those levels on the chart in front of you. It takes the newest swing high and the newest swing low from H1, H4, D1, W1 and MN1, and draws each one as a horizontal line in that timeframe’s color. Ten lines at most, two per timeframe.
There is no panel, no label and no score. It is a set of prices, color coded by where they came from.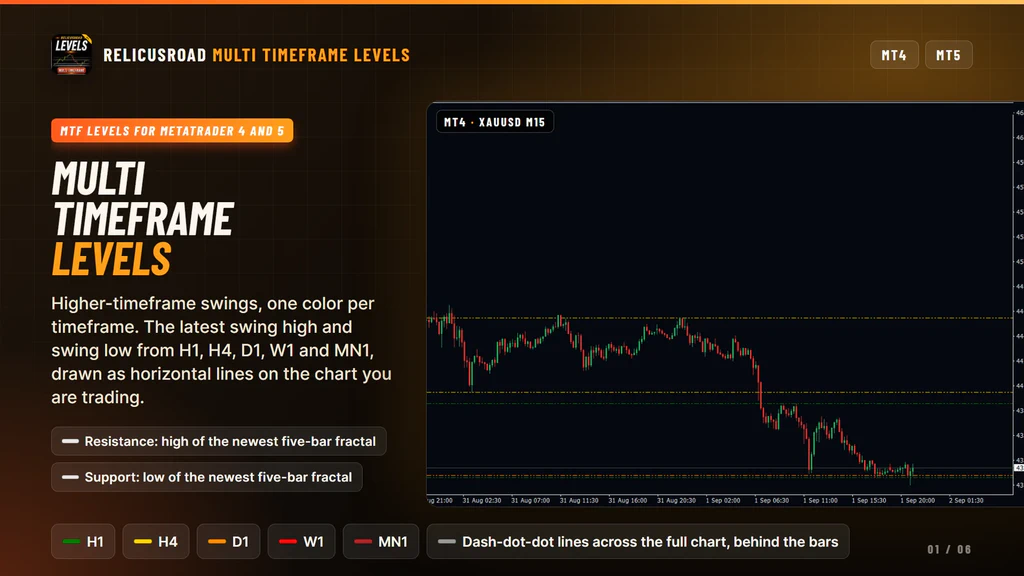
How It Works
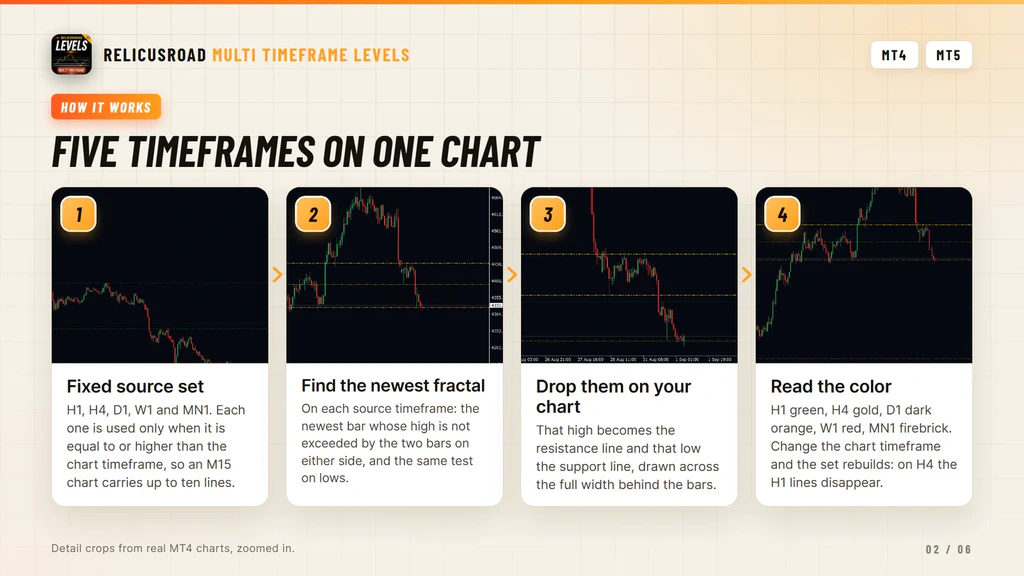
Each line comes from a five-bar fractal. On the source timeframe, the indicator looks for the newest bar whose high is not exceeded by the two bars on either side of it. That high becomes the resistance line for the timeframe. The same test on lows gives the support line.
That is the classic Bill Williams swing test, run once per timeframe rather than once per chart. If you want the same swings drawn as arrows on a single chart, with wider windows, RelicusRoad Fractals does that job.
Which timeframes appear depends on the chart you attach it to. A source timeframe is used only when it is equal to or higher than the chart timeframe:
| Your chart | Lines you get |
|---|---|
| M1 to M30 | All five, H1 through MN1, up to ten lines |
| H1 | H1, H4, D1, W1, MN1 |
| H4 | H4, D1, W1, MN1, with the green H1 pair gone |
| D1 | D1, W1, MN1 |
| W1 or MN1 | The weekly and monthly pairs, or the monthly pair alone |
- M1 to M30
- All five, H1 through MN1, up to ten lines
- H1
- H1, H4, D1, W1, MN1
- H4
- H4, D1, W1, MN1, with the green H1 pair gone
- D1
- D1, W1, MN1
- W1 or MN1
- The weekly and monthly pairs, or the monthly pair alone
The Lines Move, And That Is The Design
Buyers who expect a level to stay where it printed should read this part first. Each line tracks the newest fractal on its timeframe, so it moves for two reasons.
A newer fractal forms, and the line steps to it. That is the common case, and it is what keeps the levels current instead of showing you a swing from three months ago.
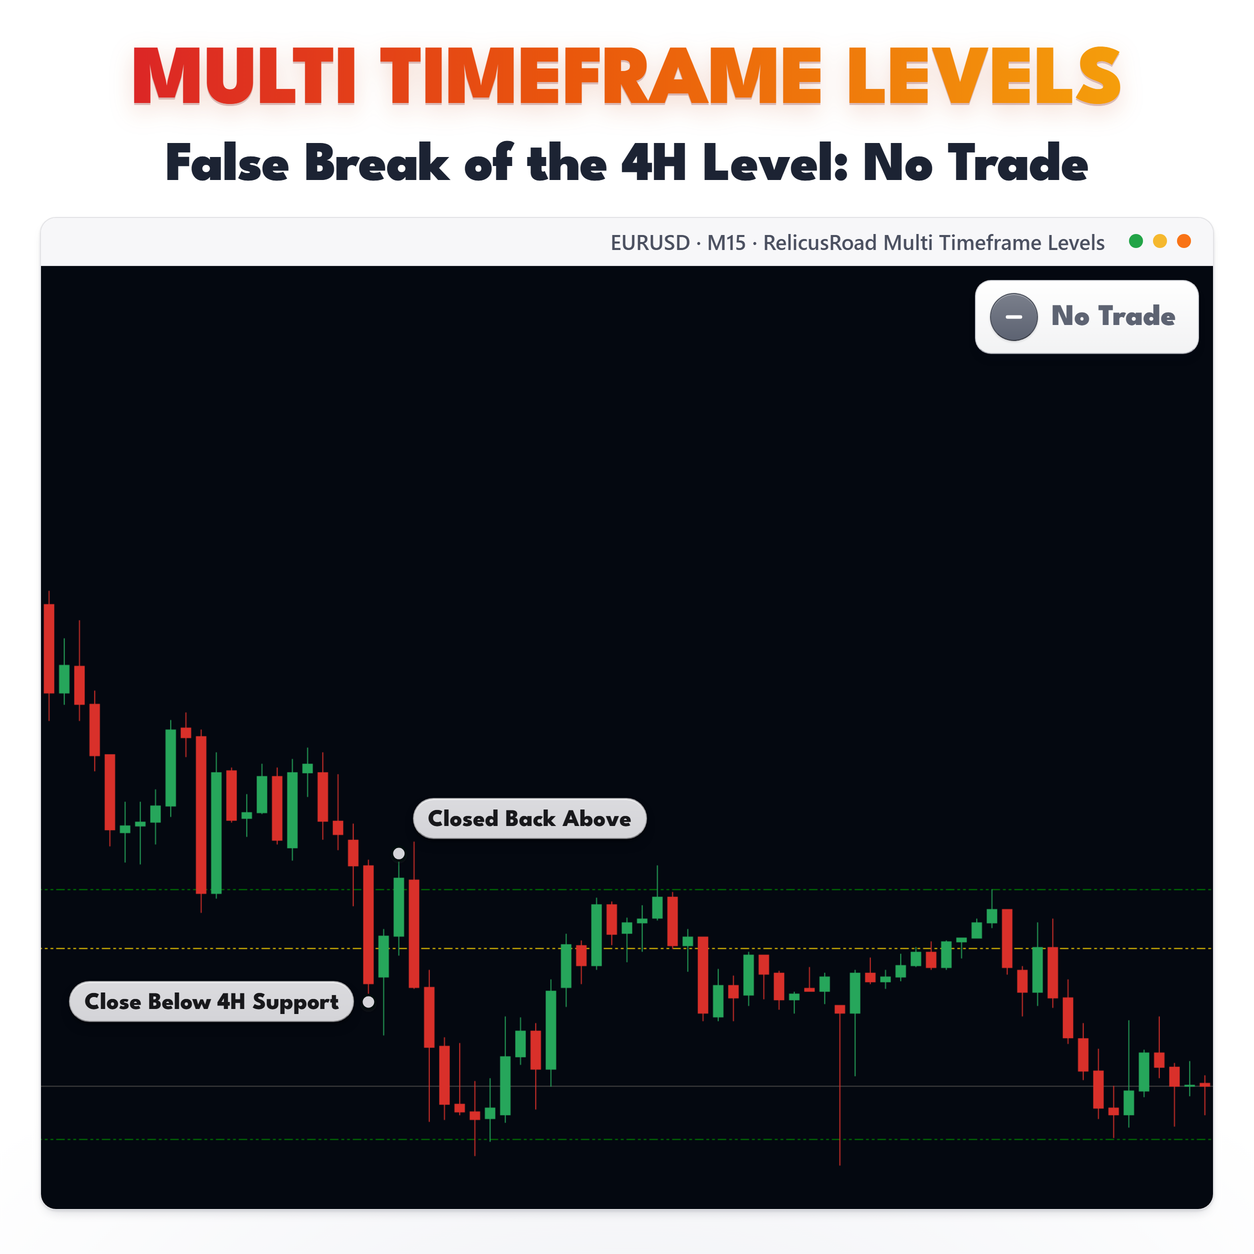
The forming bar on a higher timeframe pushes past the last fractal, which cancels it, and the line falls back to an older swing. A weekly line can sit still for days and then move once the week’s bar takes out the level it was built from.
The other thing to know is that the labels describe origin, not position. A line named resistance was
found as a fractal high. If price has since traded above it, nothing renames it and nothing removes
it. You read where price is against the line yourself.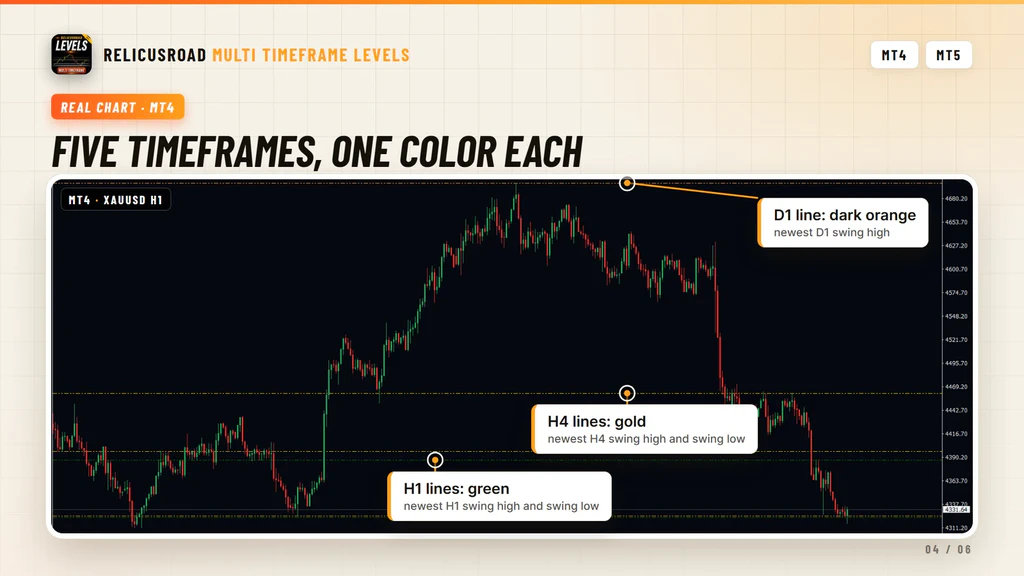
What You See On The Chart
| Element | What it tells you |
|---|---|
| Green lines | The newest H1 swing high and swing low |
| Gold lines | The newest H4 pair |
| Dark orange lines | The newest daily pair |
| Red lines | The newest weekly pair |
| Firebrick lines | The newest monthly pair, present on every chart |
| Line style | Thin dash-dot-dot, full chart width, drawn behind the candles |
| Object names | Each line is named for its timeframe and side in the terminal object list |
- Green lines
- The newest H1 swing high and swing low
- Gold lines
- The newest H4 pair
- Dark orange lines
- The newest daily pair
- Red lines
- The newest weekly pair
- Firebrick lines
- The newest monthly pair, present on every chart
- Line style
- Thin dash-dot-dot, full chart width, drawn behind the candles
- Object names
- Each line is named for its timeframe and side in the terminal object list
Nothing is written on the chart itself. The color is the label, which is why the five colors run from
green at H1 to deep red at MN1, cool for the fast timeframes and hot for the slow ones.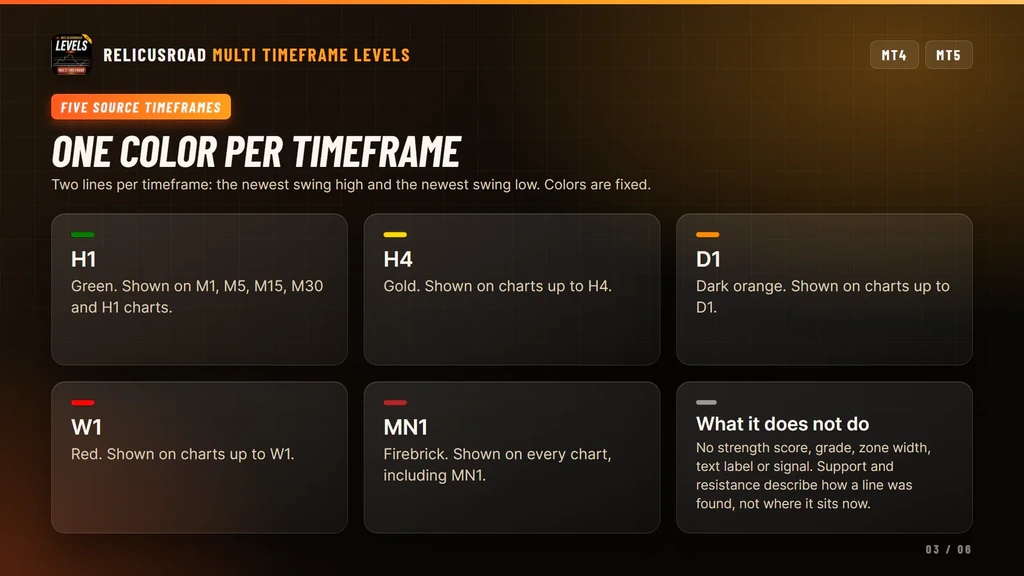
What It Does For Your Trading
Four things, each one you can check on a real chart before you trust it.
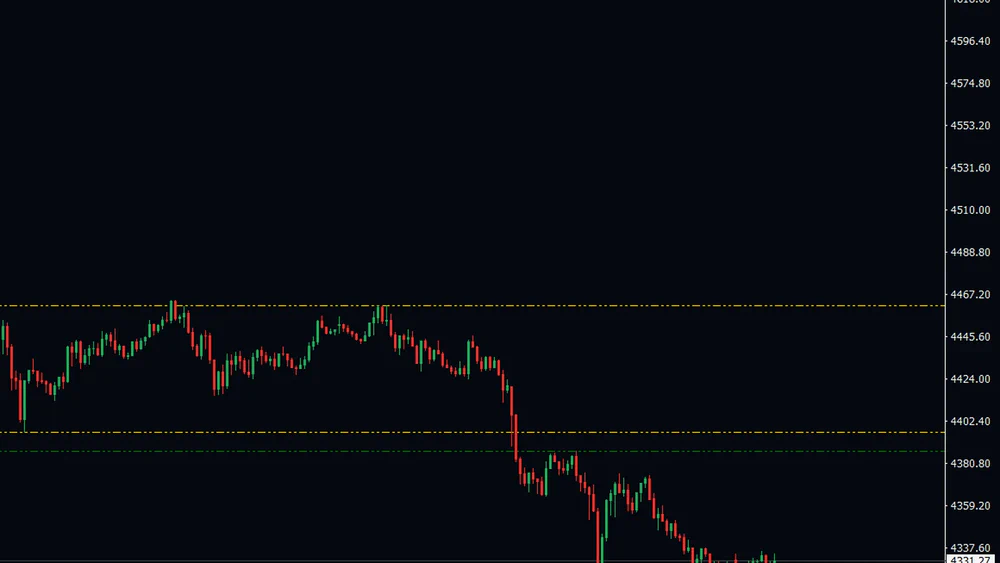
Higher Timeframe Swings On One Chart
The newest swing high and swing low of each higher timeframe are dropped onto the chart you are looking at, as thin dash-dot lines drawn behind the candles. On an intraday chart that is up to ten prices, gathered without opening a single other chart.
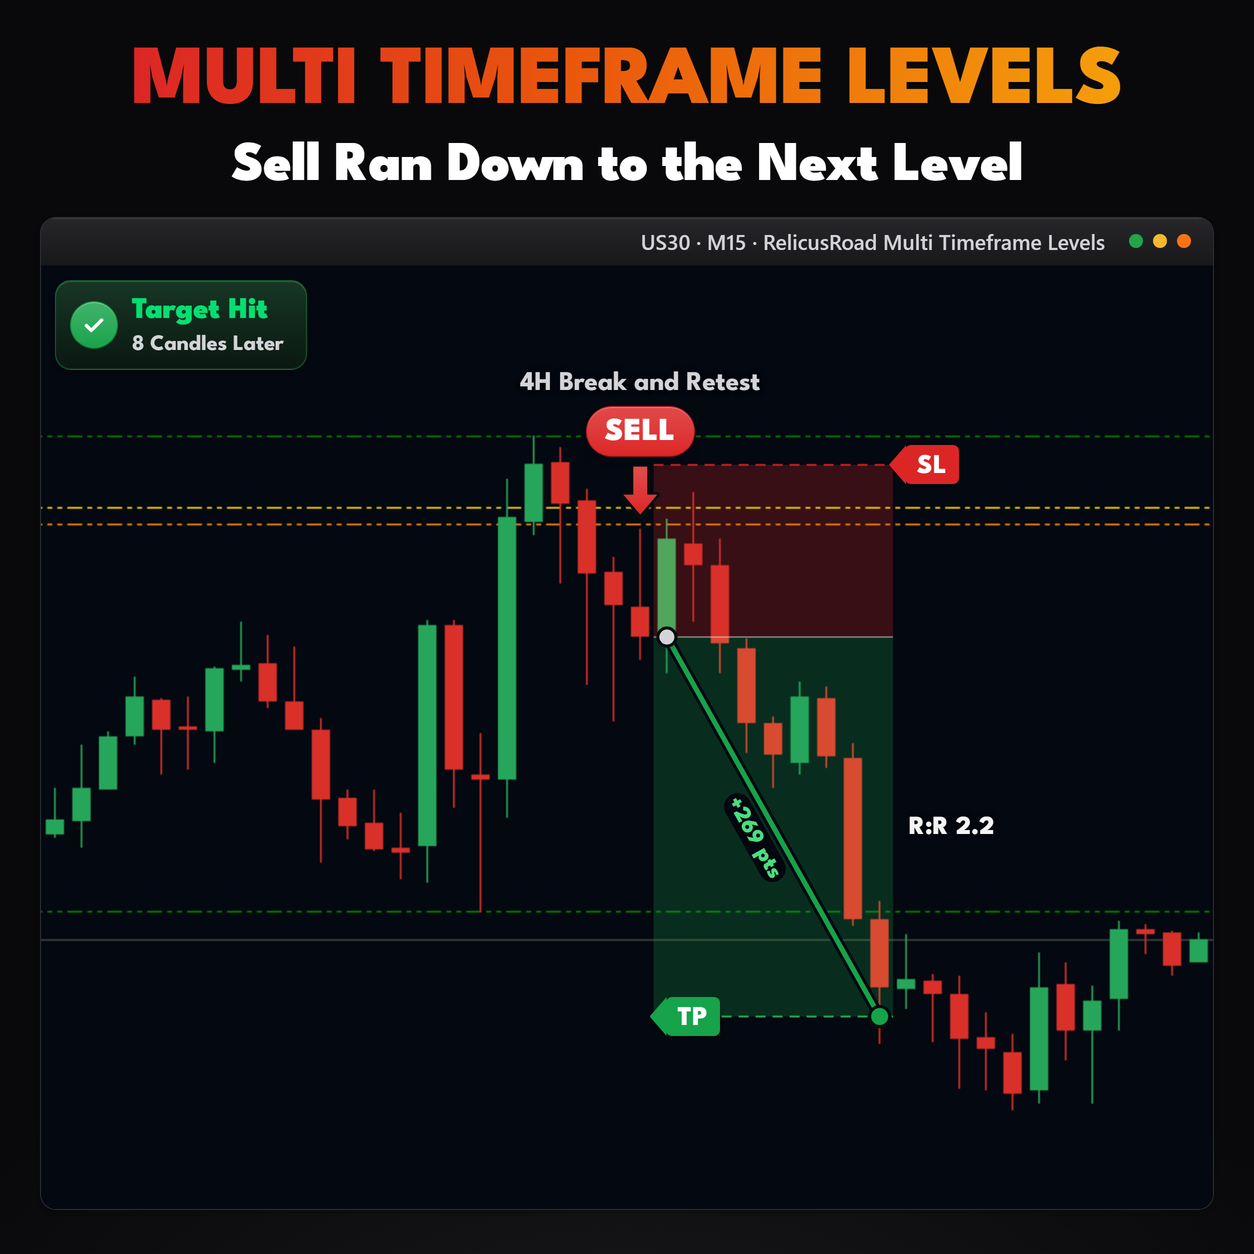
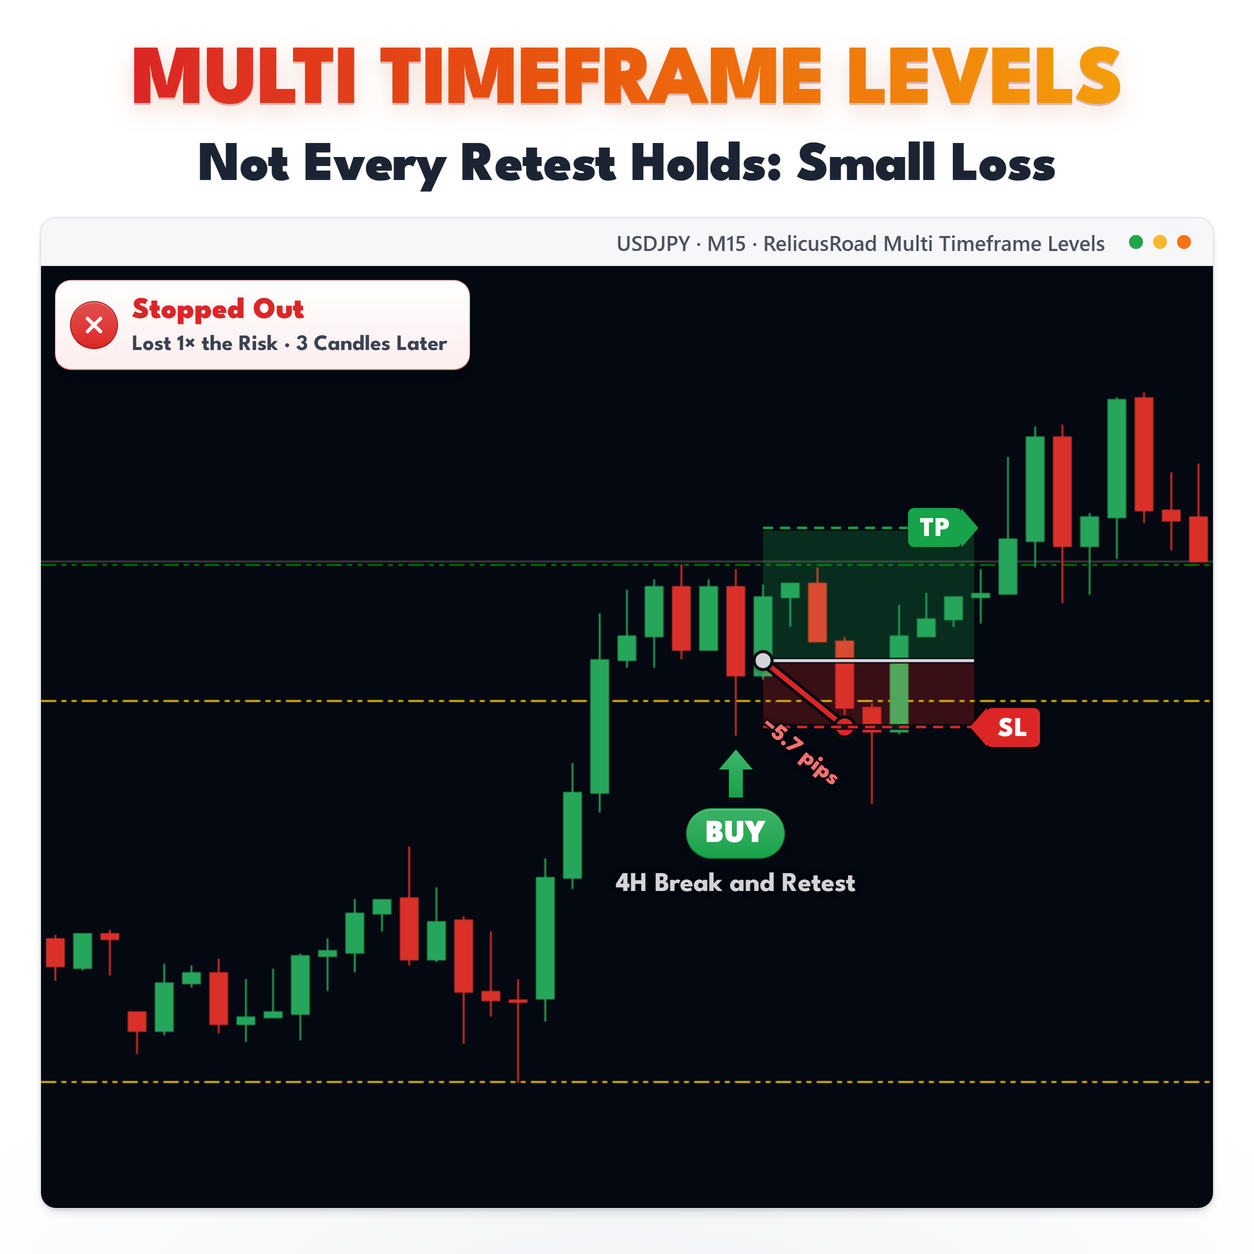
The level that ends an intraday move is often a swing from a slower chart. This puts it in front of you before the move reaches it, not after.
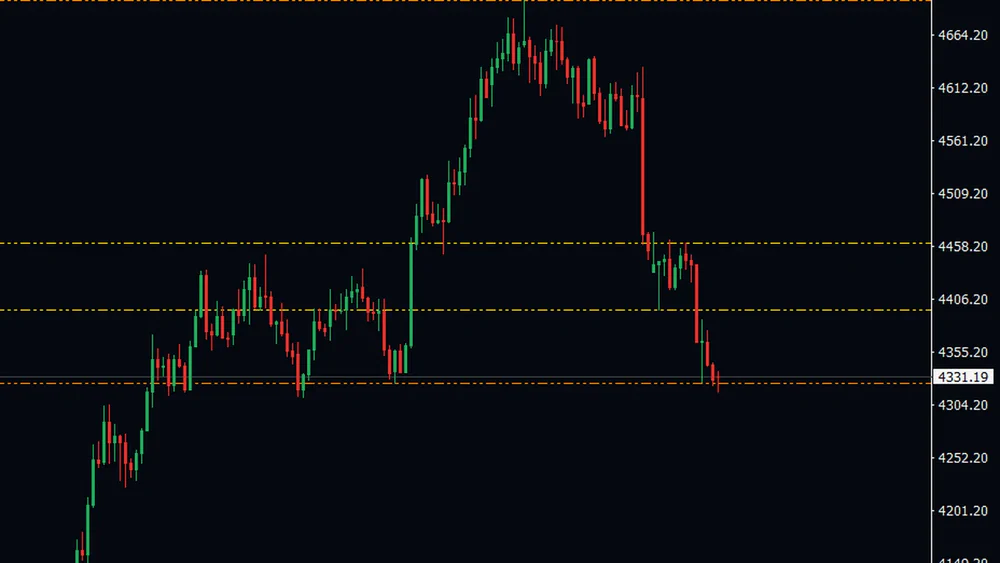
One Color Tells You The Timeframe
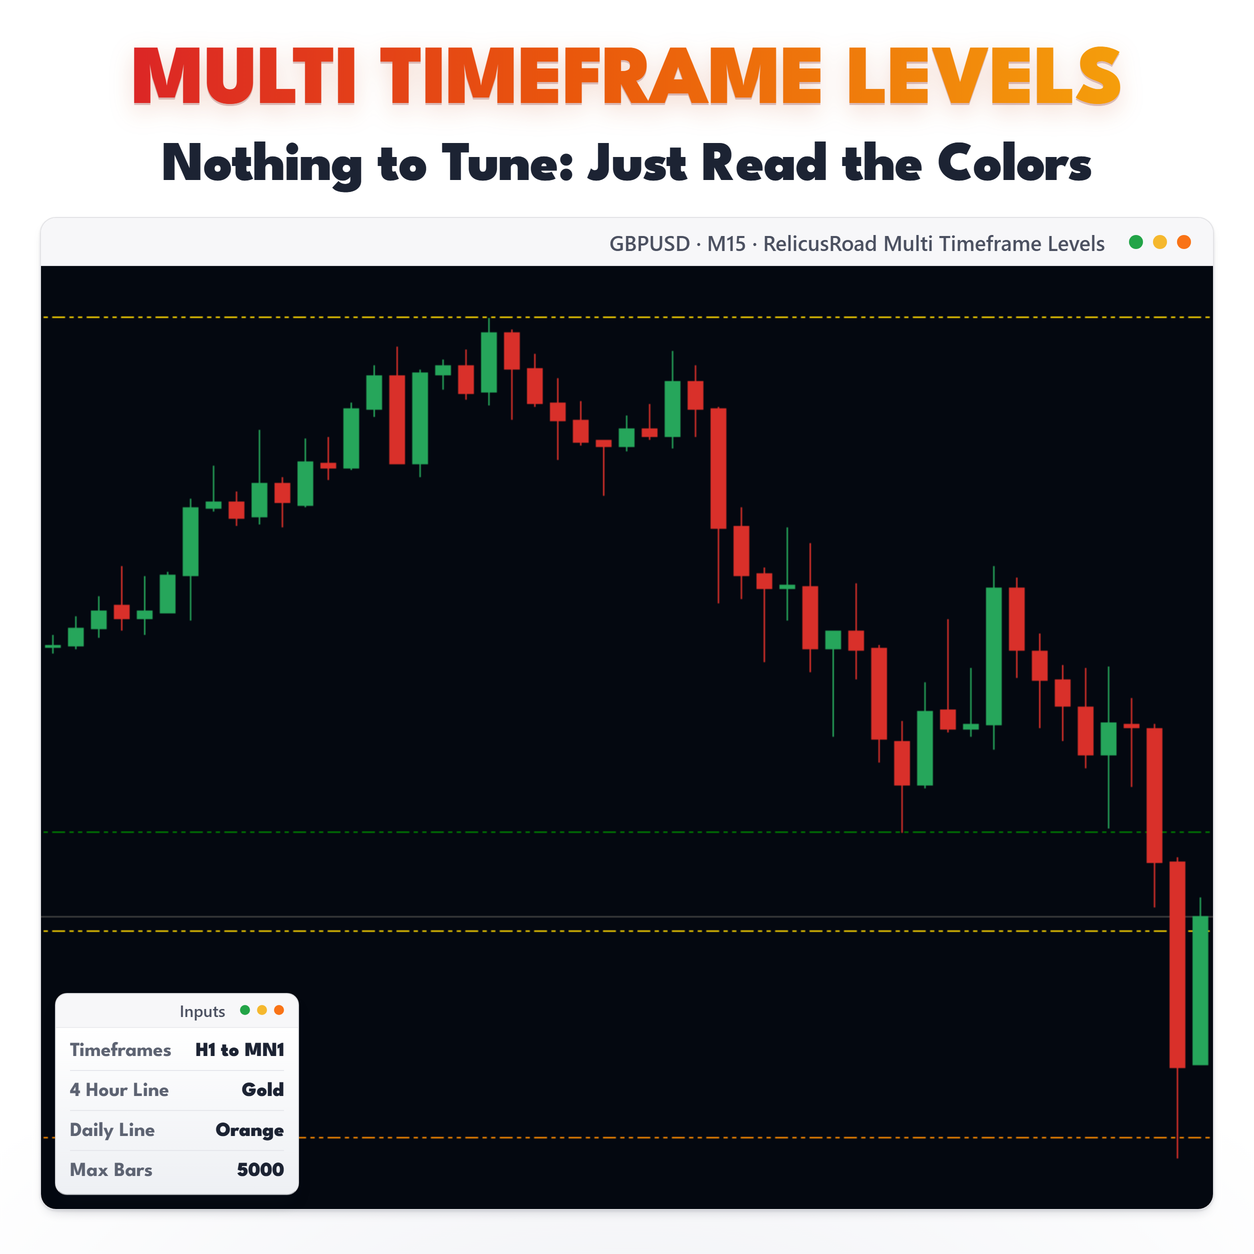
Each timeframe owns a color and shares it between its high and its low. Green is H1, gold is H4, dark orange is daily, red is weekly and firebrick is monthly, so a glance at the color tells you how much history stands behind the price.
You treat a monthly line differently from an hourly one. The chart makes that difference visible without a label, a panel or a legend taking up space.
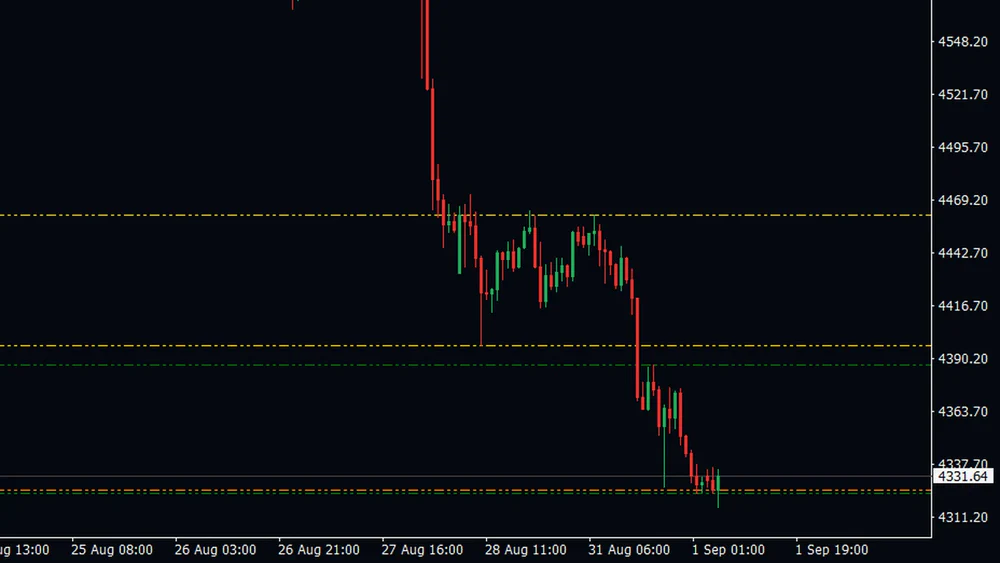
Shows When Timeframes Line Up
When two or three colors land within a few points of each other, separate groups of traders have a recent swing at the same price. The indicator does not score that overlap or highlight it. It draws the lines and leaves the reading to you.
That is a place to slow down, whether you are taking profit into it or waiting for it to break. You can see it in a second rather than flicking through four charts to find it.
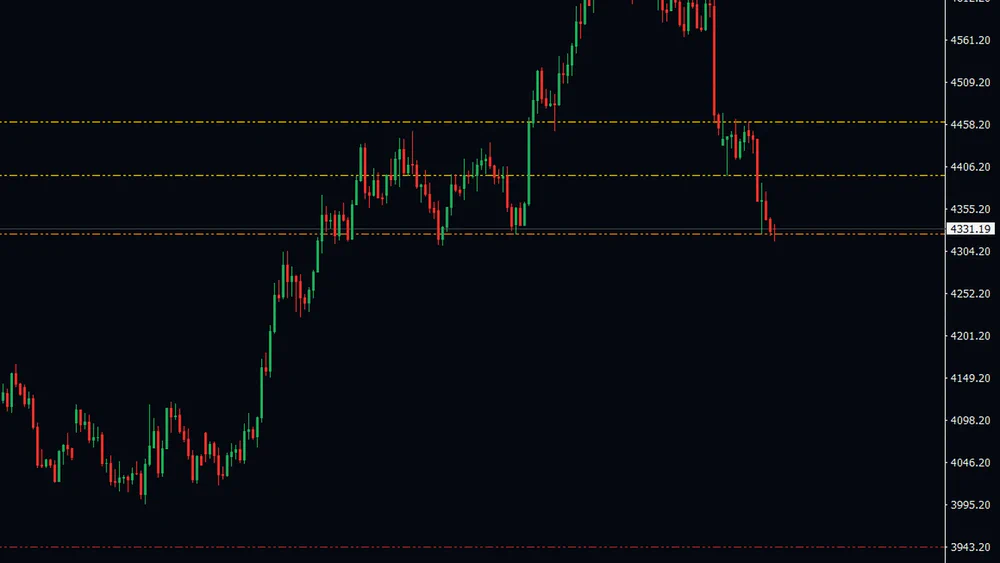
Always The Newest Swing, Never A Stale One
Each line tracks the latest fractal on its timeframe. When a newer swing forms, or the forming higher-timeframe bar takes out the old one, the line moves. A weekly line can sit still for days and then step once.
It means you are looking at current structure instead of a level you drew last month and forgot to delete. Take a screenshot if you want to keep a particular picture, because the chart keeps only the latest one.
Reading It On A Live Chart
Read the color first, then the distance. A firebrick line a few points above price on an M15 chart is a monthly swing high sitting in your way, and it deserves more respect than the green H1 line ten points above it.
When two colors land close together, two independent groups of traders have a recent swing near the same price. The indicator does not detect that or mark it. The lines are drawn, and the reading is yours.
Change the chart timeframe and the set rebuilds. Going from M15 to H4 drops the green pair and leaves
the slower four, which is a quick way to strip the picture back when the chart gets busy.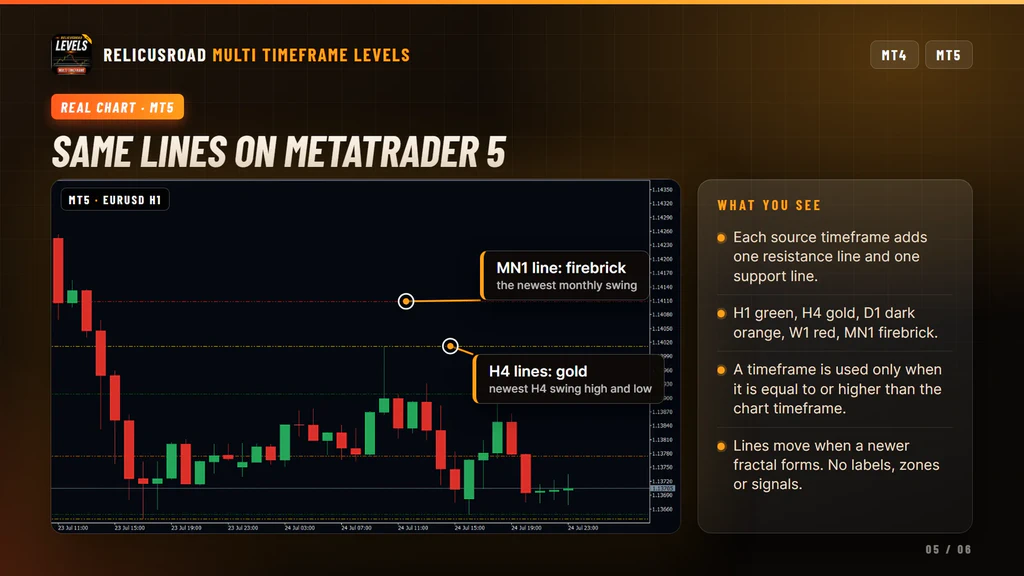
Settings You Can Change
Almost nothing, and that is deliberate. These parts are fixed in the code:
- Source timeframes. H1, H4, D1, W1 and MN1. M1 to M30 are never used as a source.
- Swing rule. A five-bar fractal, two bars on each side of the swing bar.
- Lines per timeframe. One support and one resistance, the most recent of each.
- Colors and style. Set per timeframe as listed above, dash-dot-dot, behind the bars.
The inputs window shows one entry, Maximum bars calculations, set to 5000. The fractal search does not read it, so changing it does not move the lines. We would rather tell you that than let you spend an evening tuning a number that does nothing.
What It Does Not Do
Worth knowing before you install:
- It does not detect confluence. Overlapping lines from two timeframes are drawn on top of each other, with no score and no highlight.
- It does not draw a ladder of levels. You get the most recent swing high and low per timeframe, not the ones before them.
- It does not keep a level fixed. A newer fractal, or a forming bar that cancels the old one, moves the line.
- It does not label the lines on the chart. The timeframe is shown by color, and by the object name.
- It does not let you pick timeframes, colors or the line style.
- It does not send alerts, and it does not place trades.
Setup In Three Steps
- Buy it on the MQL5 Market and install it from the Market tab of your terminal.
- Open H1, H4, D1, W1 and MN1 once on the symbol so the terminal downloads their history.
- Drag RelicusRoad Multi Timeframe Levels onto the chart you trade, usually M5 to M30.
It runs on forex, gold, indices and crypto. The lines are rebuilt when a new bar opens on your chart,
not on every tick, so a fresh line appears at the start of a bar rather than mid-bar.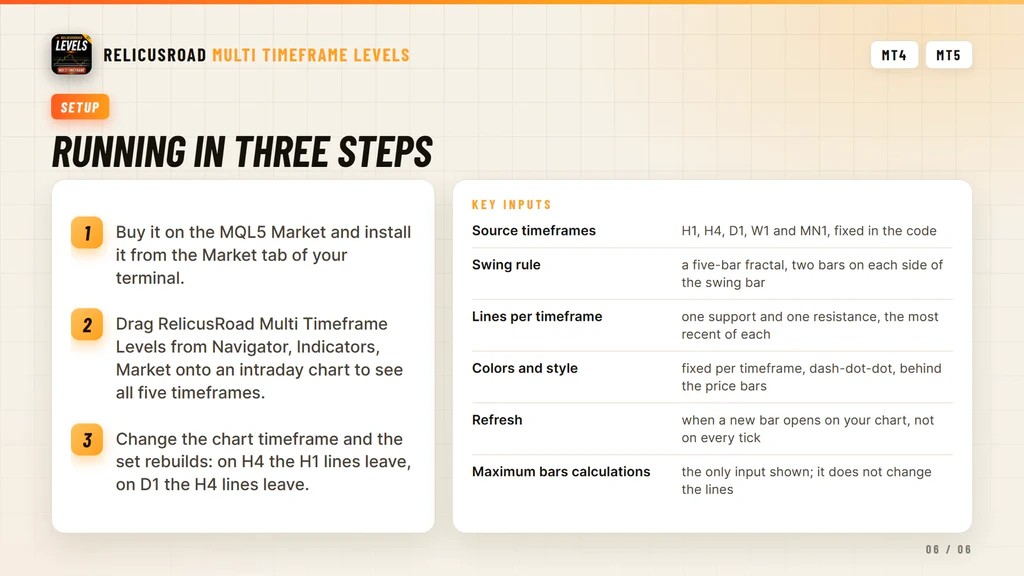
Where It Comes From
Higher-timeframe level detection is one of the multi-timeframe modules in RelicusRoad Pro, published on its own for traders who want those swing levels on a lower chart and nothing else attached. It runs standalone.
If you want graded zones with a record of how often price tested them, that is Support Resistance. For the sloping version of the same idea, drawn between confirmed pivots, see Trendlines.
Support runs through the product comments and the mql5.com messaging system.
Frequently Asked Questions
Everything you need to know about RelicusRoad Multi Timeframe Levels. Still curious? Reach out anytime.
Learn How to Trade It
Every indicator ships with reference documentation and a matching strategy guide. You can also read what other traders say or start with the setup guide.
Indicator Reference
- Road Levels Dynamic S/R levels around a moving center line
- Support & Resistance Advanced S/R zones with alerts
- Action Levels Critical price levels for major moves
- Signal Lines Trend bias filter with two independent lines
- Daily High/Low/Open Daily extremes for range trading
- Daily Pivots Pro pivot points S1-S3, R1-R3
Trading Strategies
- Strategy #1: Price Action (Road) + SR + Trendlines + 2 TFs
- Strategy #2: Local Trendline + Price Position on Road + 2 TFs
- Strategy #3: Arrows + Price Action (Road) + SR
- Strategy #4: MicroScalping + Multiple Pairs + Daily Target 2-10%
Trading Guides
- Non-Repaint Forex Indicators: What 'Non-Repaint' Actually Means (and How to Verify It)
- Prop Firm Challenges: The 'Slow Boring' Strategy to Getting Funded
- Market Sessions Trading: How to Time the 'London-NY Overlap'
- What Is Forex Trading and How Does It Work?
- The Real Cost of Trading Platforms in 2026: A Broker-Neutral Teardown
- Position Sizing: The Boring Math That Keeps Traders Alive
- Forex Trading Psychology: 7 Traps and Process Fixes
Related tools
Standalone MetaTrader indicators related to this one.



