
What It Does
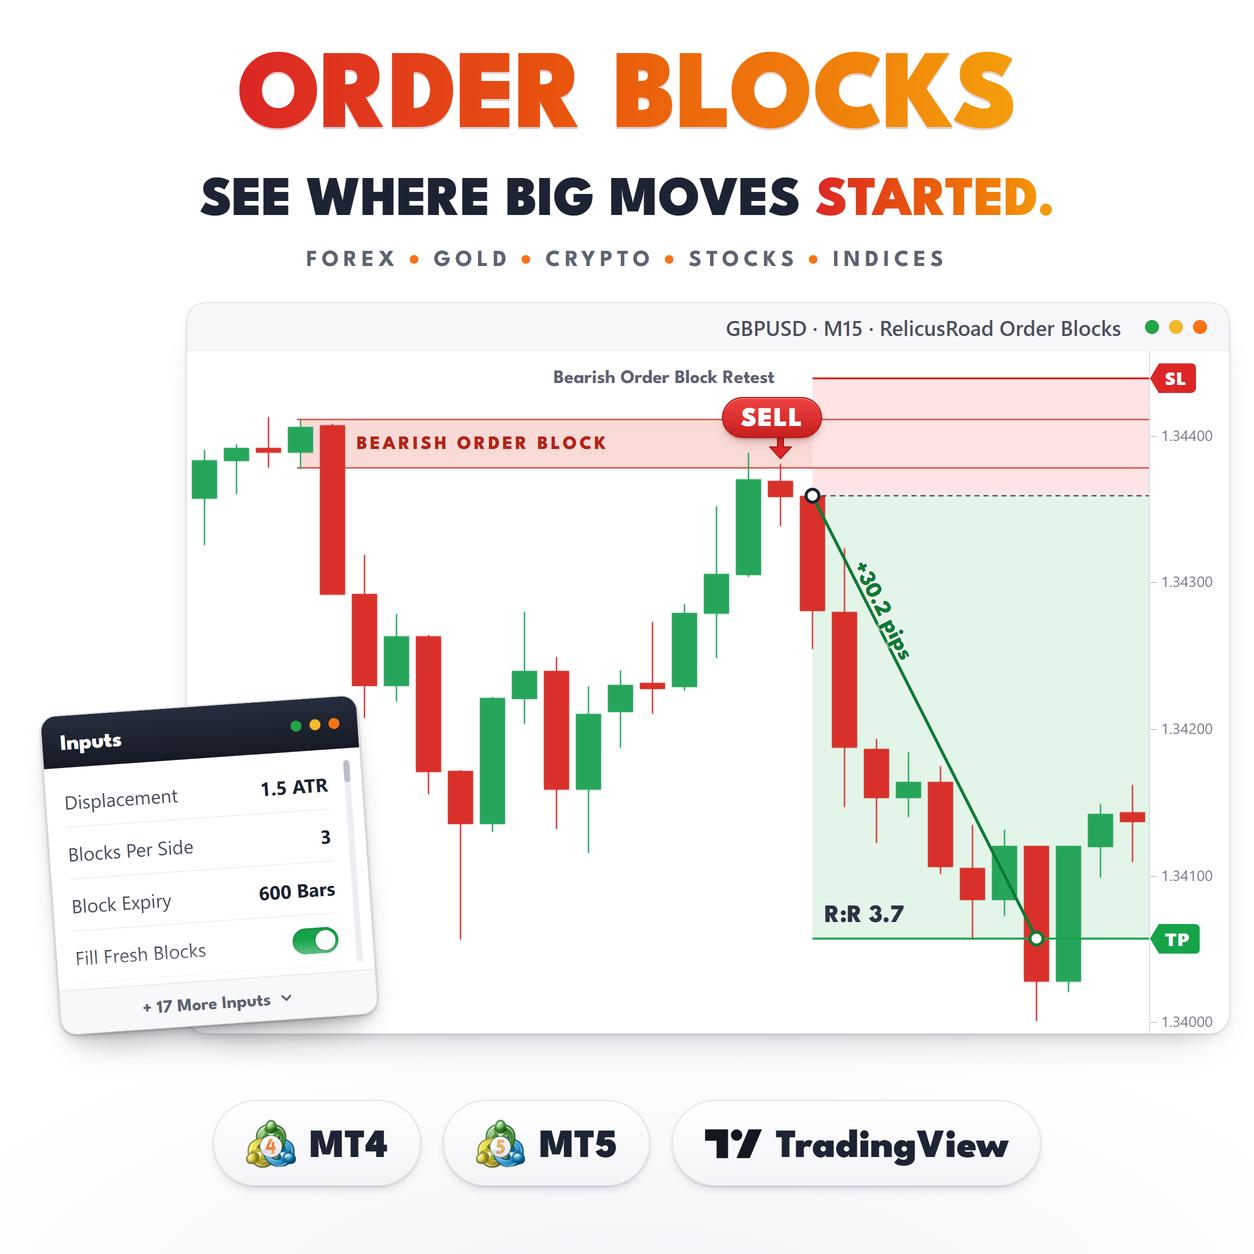
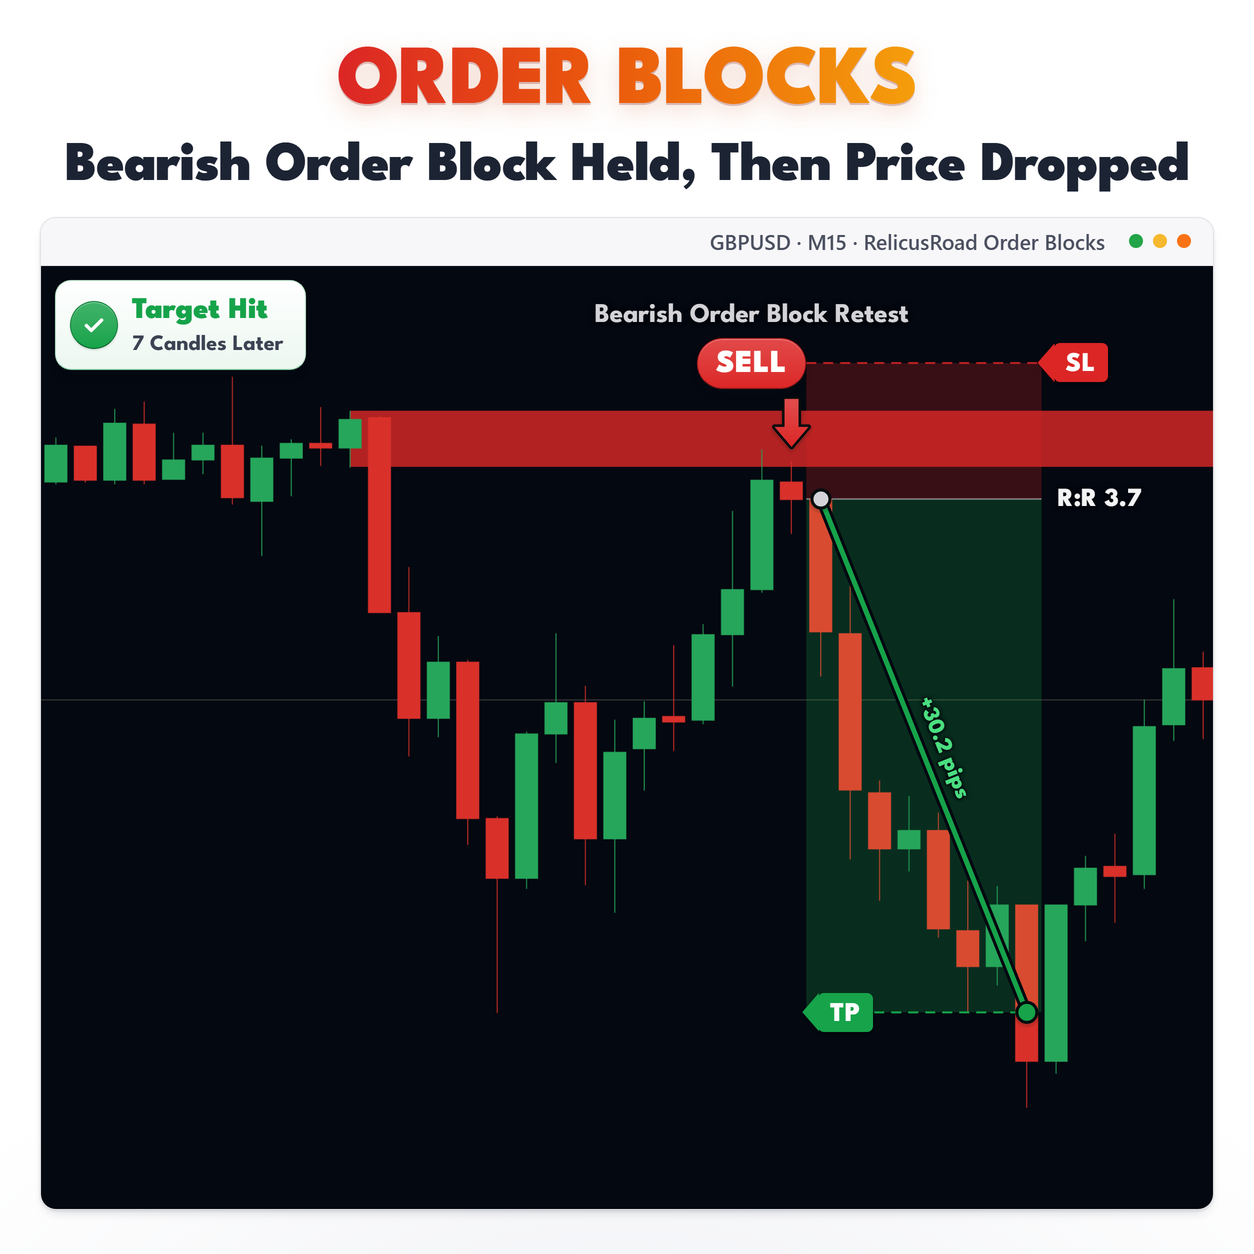
An order block is the candle a move started from. Price leaves an area in a hurry, and traders who work with smart money concepts watch that area for the return.
RelicusRoad Order Blocks finds those areas for you. It looks for displacement candles, steps back to the candle that started the move, and draws that candle’s range as a rectangle. From then on it tracks what price does with the block, how deep the return has gone, and whether the block has been used up or flipped.
Fresh blocks are filled and run ahead of price. Used blocks drop to an outline and stop where they
were used. You get up to three bullish and three bearish roles at a time, picked by score, so the
chart never fills with boxes.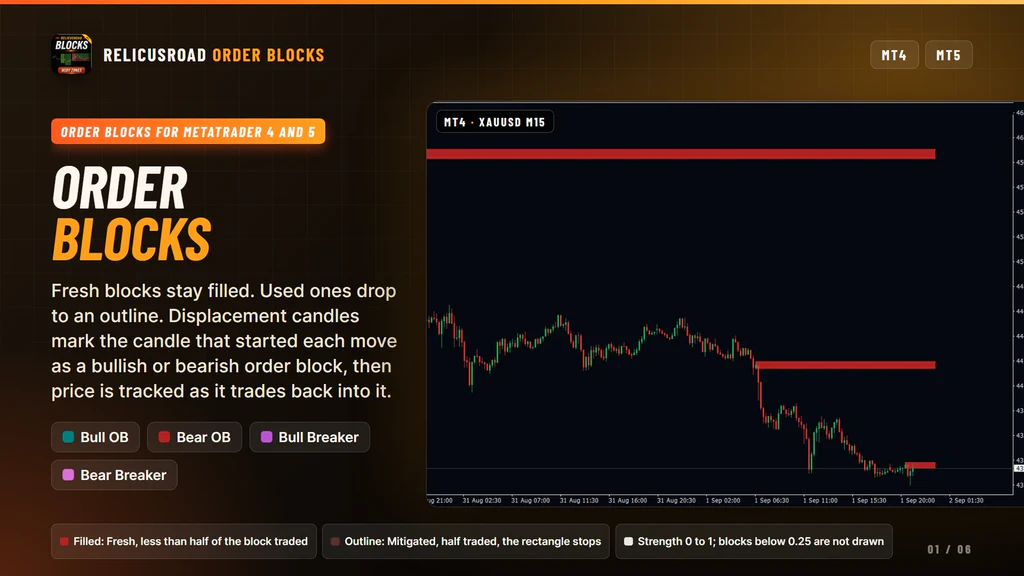
How It Works
The rules are stated in numbers so you can check them against your own chart.
Displacement. A completed candle whose body is at least 1.5 times the 14-bar Average True Range, and at least 55 percent of its own high to low range. That second test is what separates a decisive candle from a long-wicked one of the same size.
Origin. From there the indicator steps back up to three candles for the last candle of the opposite color. Its high and low become the block. If there is no opposite candle in that window, the most extreme candle in it is used.
Structure bonus. If the displacement also closed beyond the extreme of the previous 20 bars, the block scores higher. It is a bonus, not a requirement.
Score. Every block carries a strength between 0 and 1. It starts from the size of the displacement, halves about every 250 bars as the block ages, falls as price trades deeper into it, and is cut by a quarter when the block becomes a breaker. Blocks below 0.25 are not drawn.
Only completed bars are used, so the candle forming on your chart never creates or changes a block.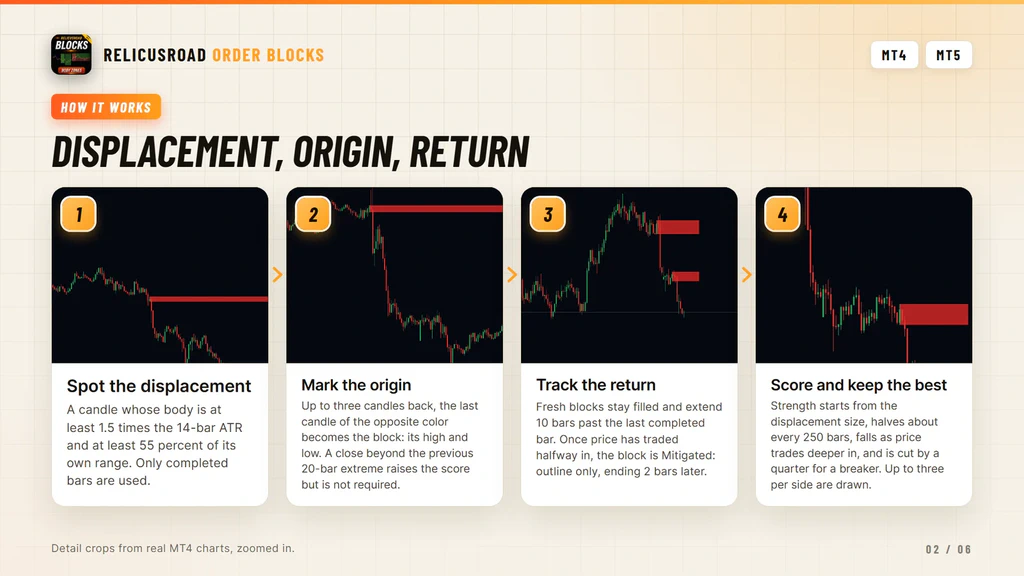
Fresh Does Not Mean Untouched
This is the one thing buyers misread, so it is worth being blunt about it.
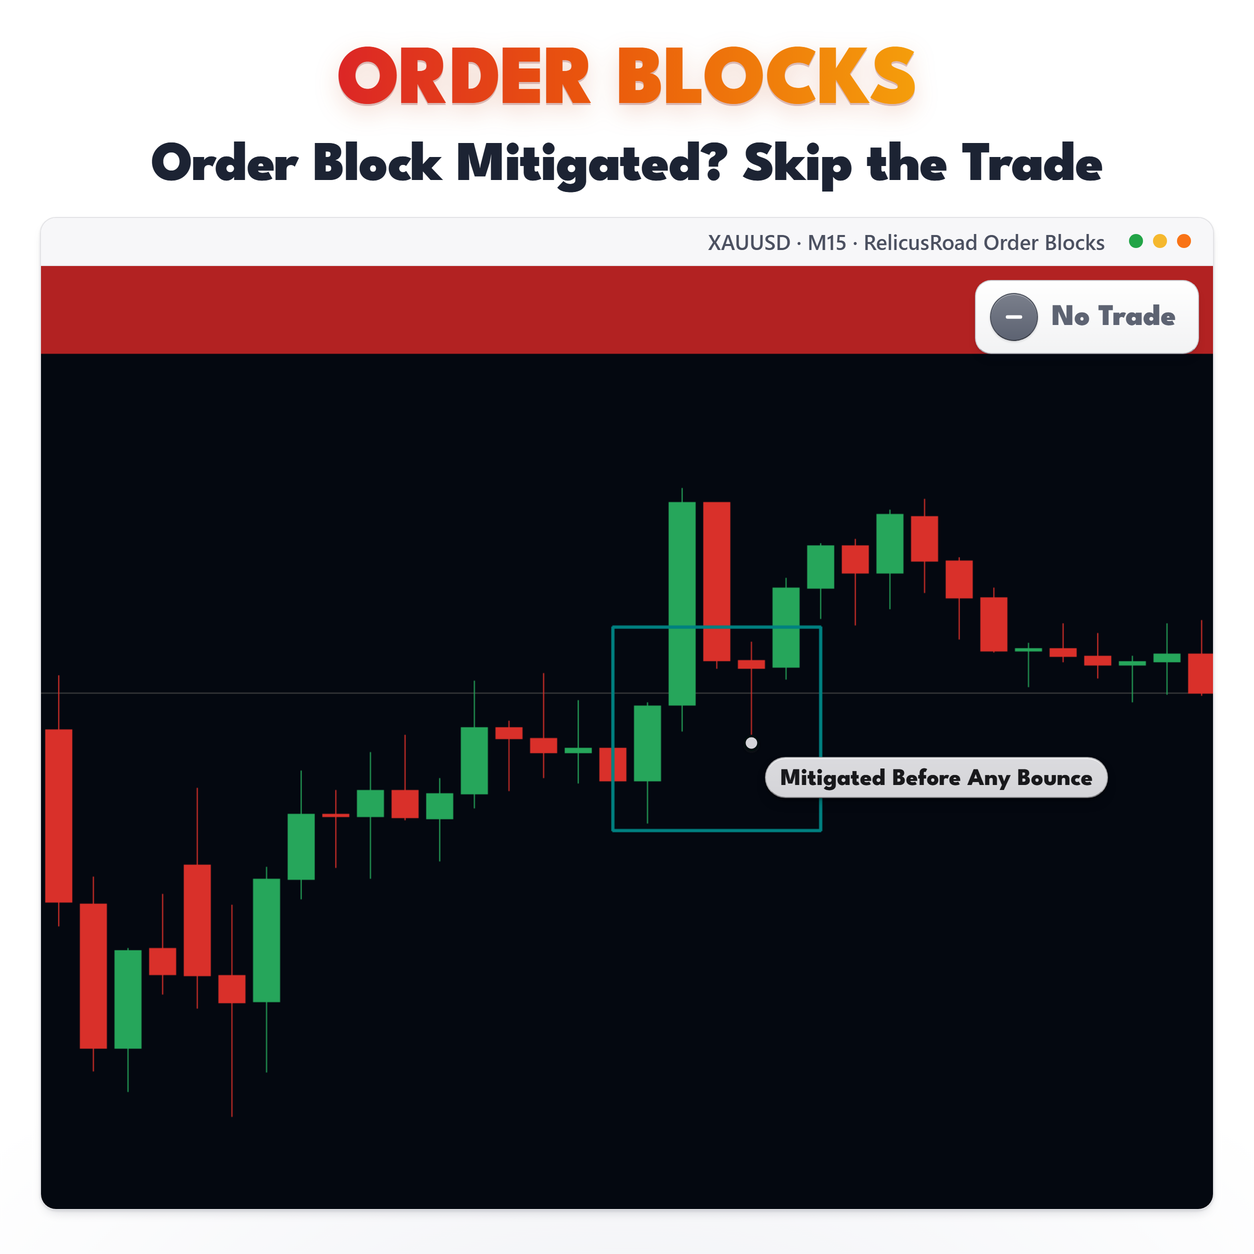
A filled rectangle means Fresh, and Fresh means price has traded less than half of the block’s height. Price may have visited it three times already. As long as those visits stayed in the top half of a bullish block, or the bottom half of a bearish one, the block is still Fresh and still filled.
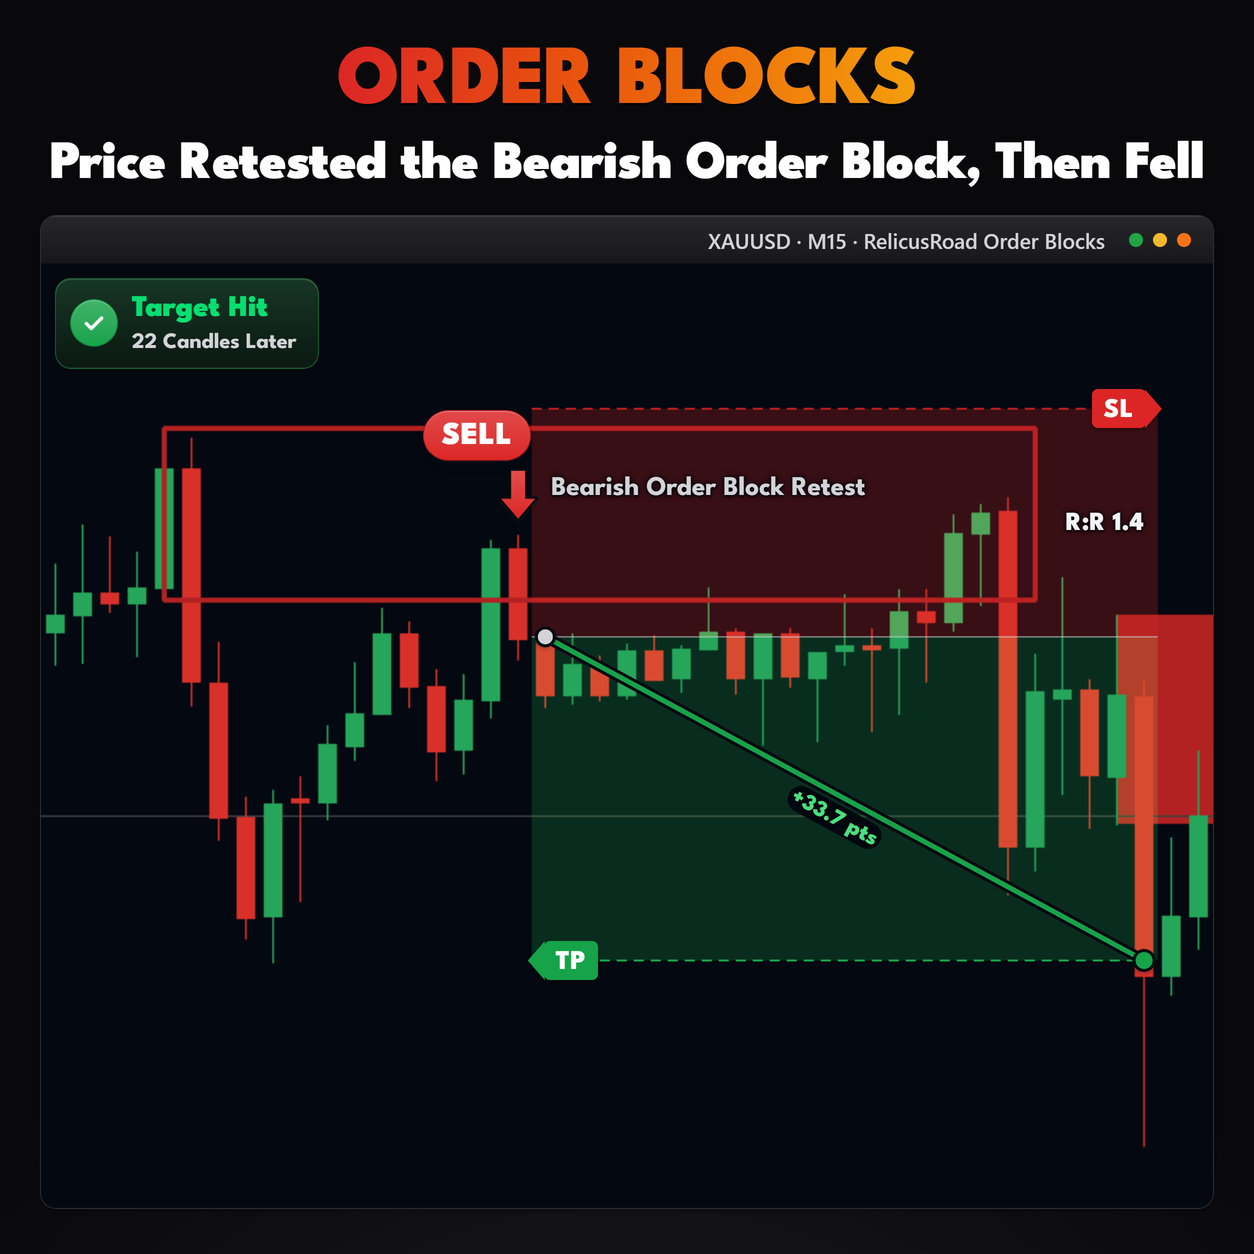
The moment price reaches the halfway point, the block becomes Mitigated. The fill drops to an outline and the rectangle stops two bars after the bar where that happened, which marks on the chart where the block was used rather than leaving it running.
Fresh blocks behave differently at the right edge. They extend ten bars past the last completed bar,
so they sit slightly ahead of price rather than stopping at it.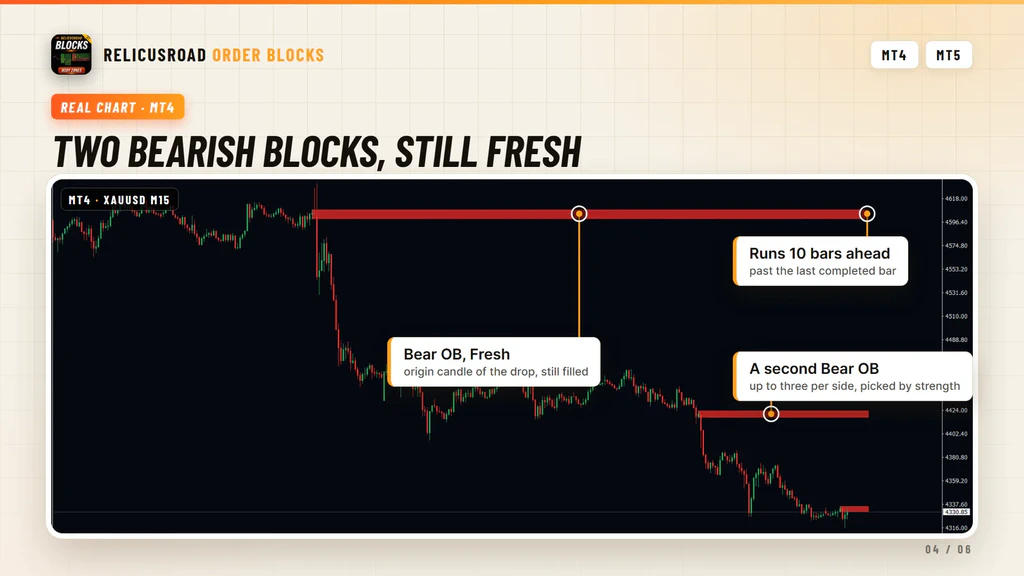
What You See On The Chart
| Element | What it tells you |
|---|---|
| Teal rectangle | Bull OB, the origin of a bullish displacement |
| Firebrick rectangle | Bear OB, the origin of a bearish displacement |
| Medium orchid rectangle | Bull Breaker, a bearish block price closed above and held |
| Orchid rectangle | Bear Breaker, a bullish block price closed below and held |
| Filled | Fresh, less than half the block traded through |
| Outline only | Mitigated, at least half traded, ending two bars after that bar |
| Object name | Role, state with its depth, strength and touch count, for example Bear OB Mitigated 63% S=0.41 T=2 |
- Teal rectangle
- Bull OB, the origin of a bullish displacement
- Firebrick rectangle
- Bear OB, the origin of a bearish displacement
- Medium orchid rectangle
- Bull Breaker, a bearish block price closed above and held
- Orchid rectangle
- Bear Breaker, a bullish block price closed below and held
- Filled
- Fresh, less than half the block traded through
- Outline only
- Mitigated, at least half traded, ending two bars after that bar
- Object name
- Role, state with its depth, strength and touch count, for example Bear OB Mitigated 63% S=0.41 T=2
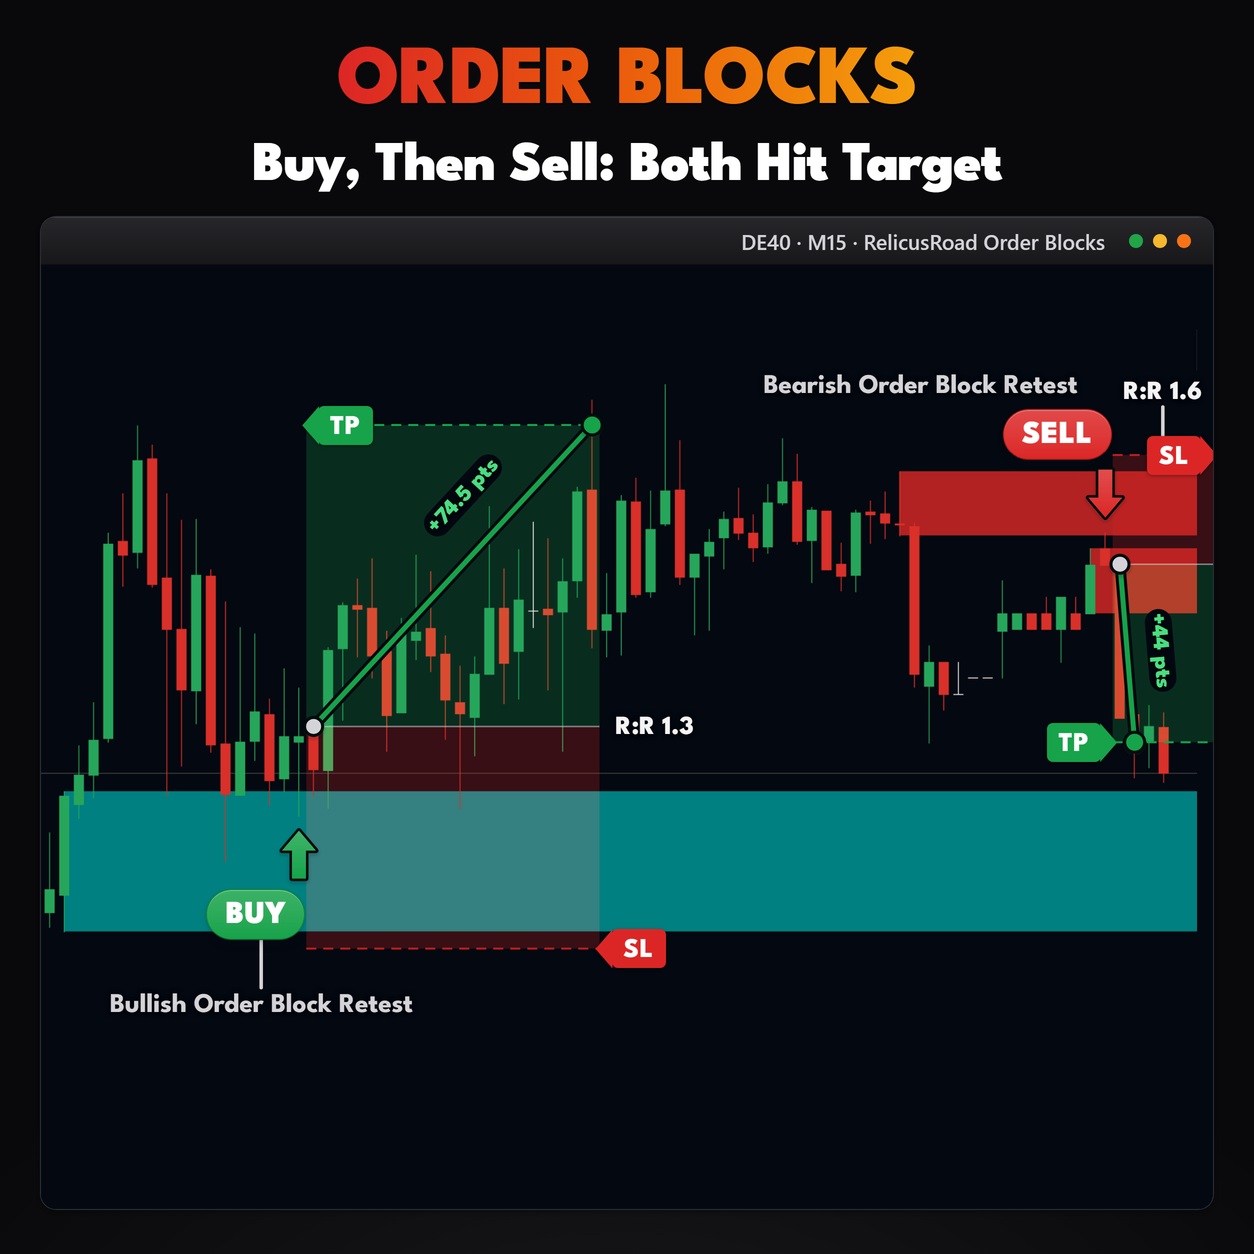
Up to three bullish roles and three bearish roles are kept, counted by role rather than by position
above or below price. Heavily overlapping blocks of the same role are merged into one.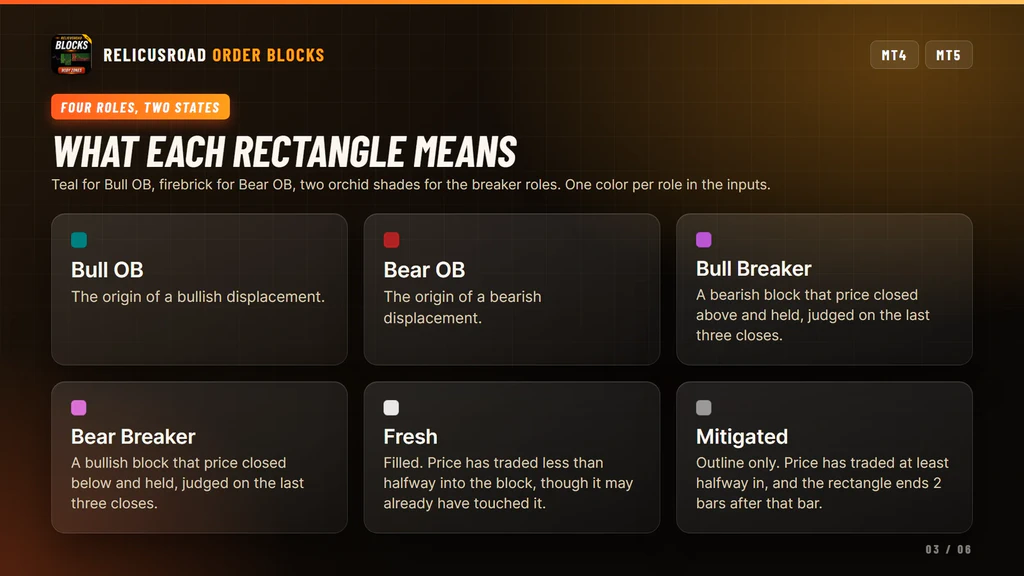
What It Does For Your Trading
Four things, each one you can check on a real chart before you trust it.
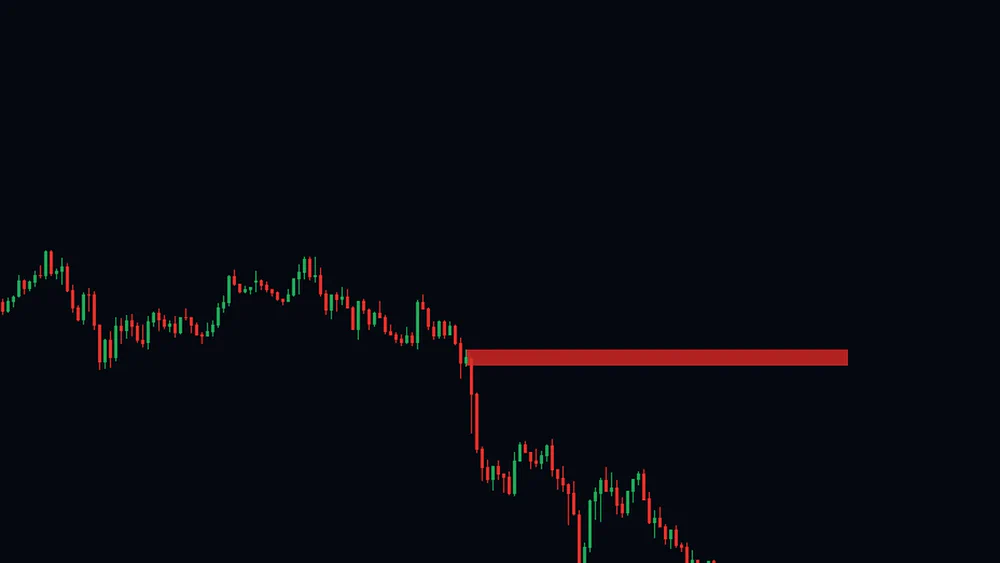
Spots The Candle That Broke Away
The test is a number, not an opinion. A completed candle qualifies when its body is at least 1.5 times the 14-bar ATR and takes up at least 55 percent of its own range, which is what separates a decisive candle from a big one with long wicks.
You can check it yourself on any chart, on any symbol, and get the same answer the indicator got. No guessing which candle counted as the move.
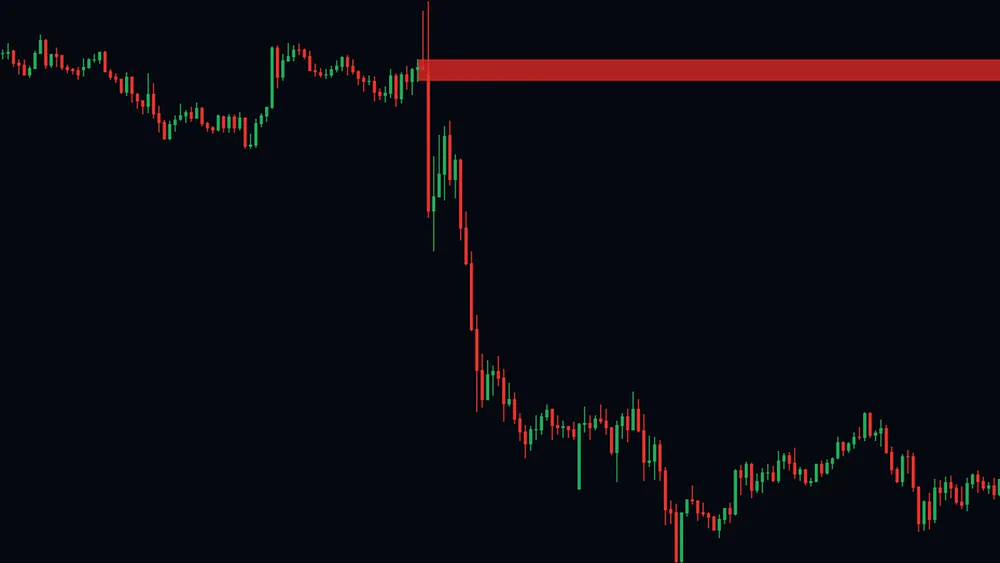
Draws The Area Price Left Behind
From the displacement candle it steps back up to three candles for the last one of the opposite color, and takes that candle’s high and low as the block. The rectangle then runs to the right, so the area stays in view as price moves away from it.
That is the price band you would mark by hand before going to make coffee, drawn the moment the move finishes and still there when you come back.
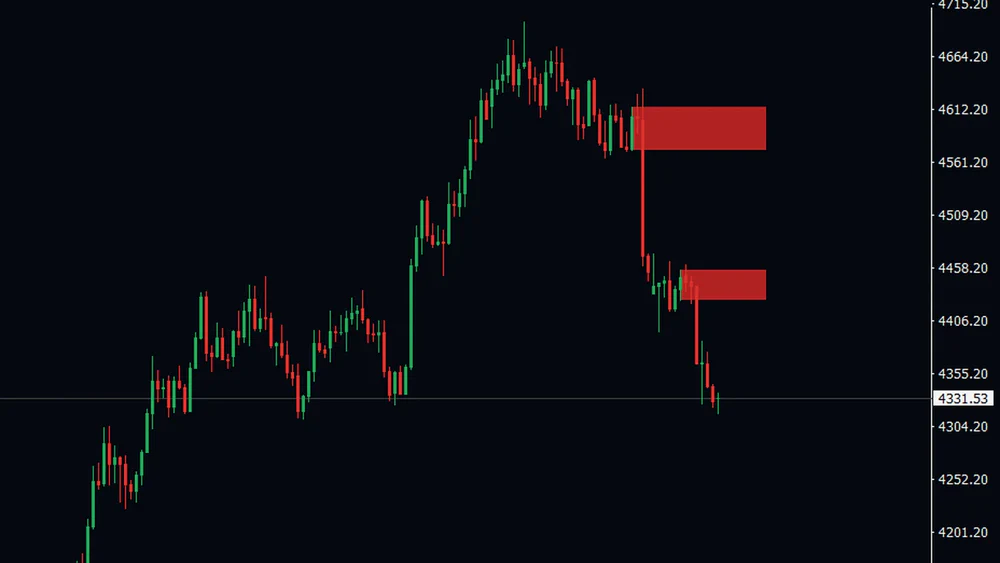
Keeps Only The Blocks Worth Watching
Every block carries a strength score that starts from the size of the displacement, fades with age and falls as price trades into it. Up to three bullish and three bearish roles survive that scoring, and fresh ones stay filled and run ten bars past the last completed bar.
Two blocks above price is a chart you can act on. Twenty is wallpaper, and the scoring is there so you never get the second one.
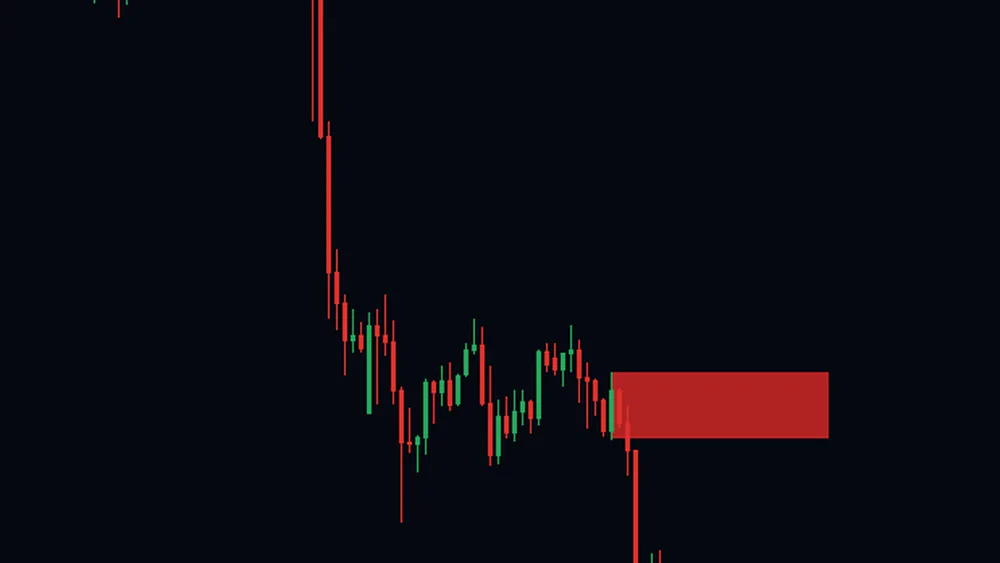
Waits For The Candle To Close
Only completed bars are used. A block appears once the displacement candle has closed, never while it is still forming, so a rectangle you see at the open of a bar is still there at the close.
You can take a screenshot, walk away and come back to the same chart. A block that appeared mid-candle and vanished when the candle closed would be worse than no block at all.
Reading It On A Live Chart
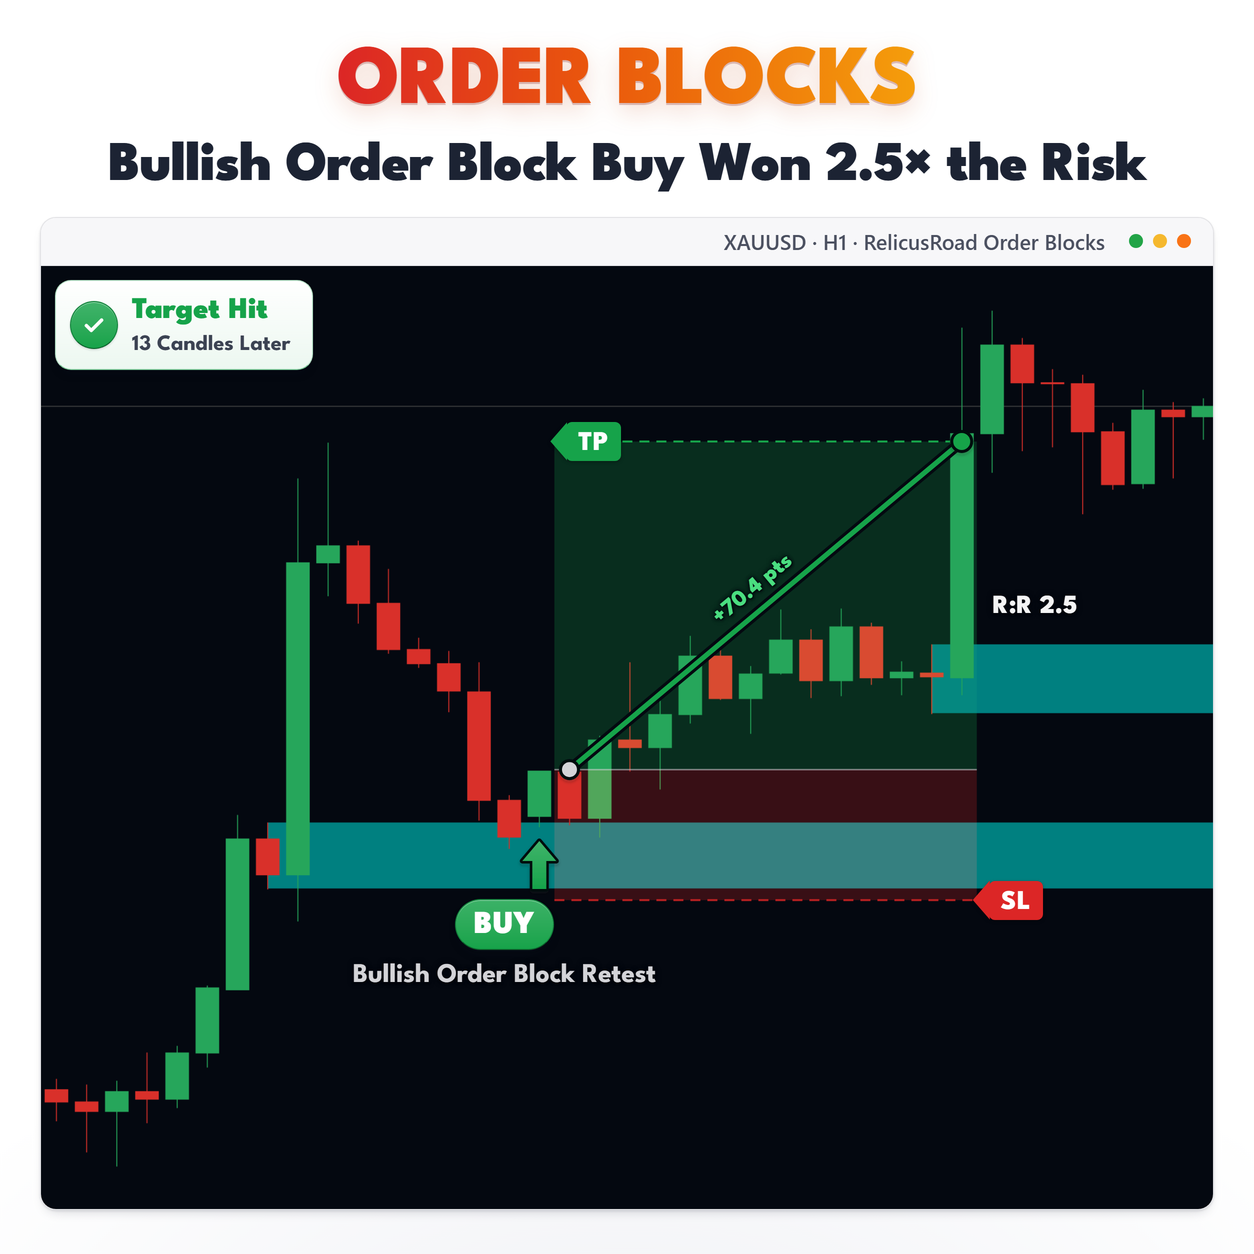
A fresh block below price on a rising chart is an area the market left quickly and has not come back to. That is the setup most block traders wait for, and the indicator’s job is to keep it in front of you without you marking candles by hand.
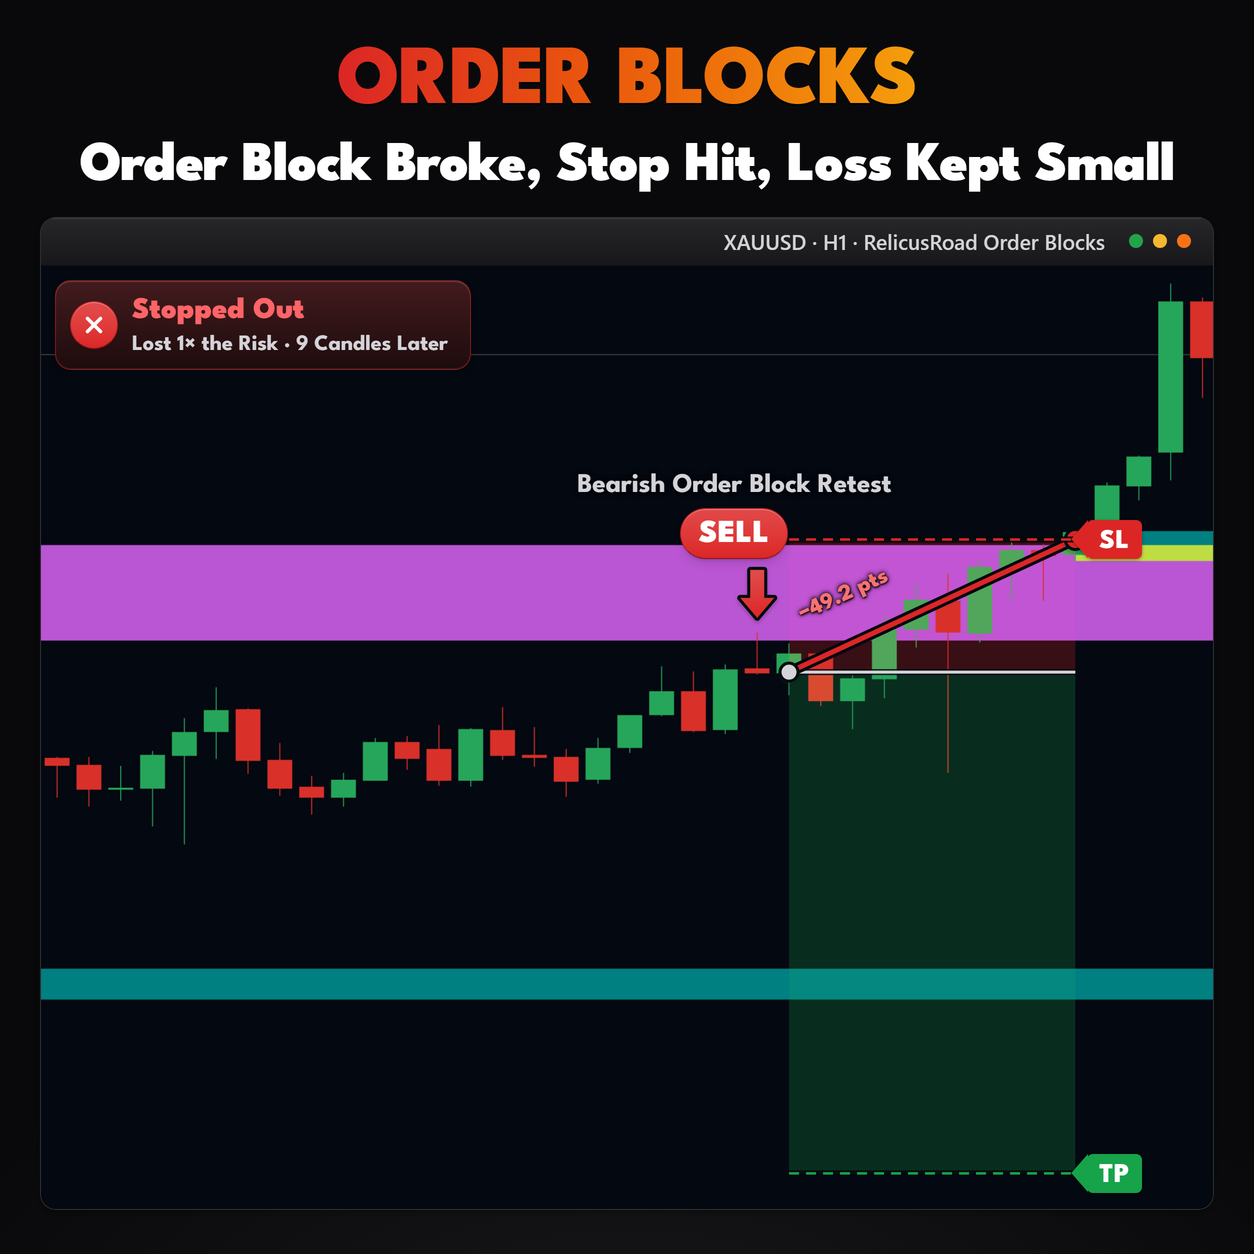
A breaker is the same area read from the other side. Price closed through the block and held there, so a former bullish block is now shown as Bear Breaker in orchid, and traders who use breakers watch it from above instead of below.
To see the detail, open the terminal object list or hover a rectangle. The name carries the role, the
state with its depth as a percentage, the strength score and how many separate visits the block has
had.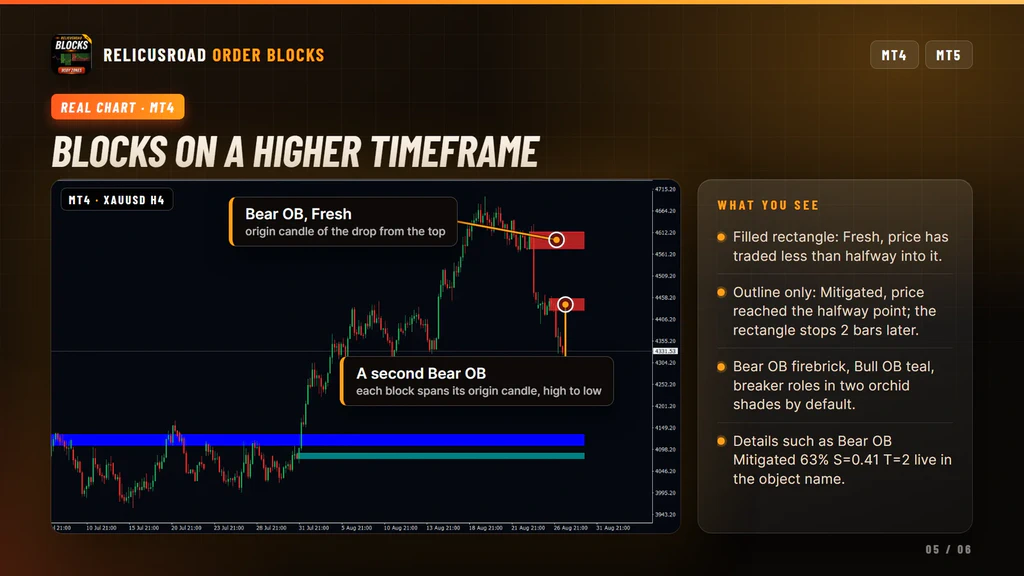
Settings You Can Change
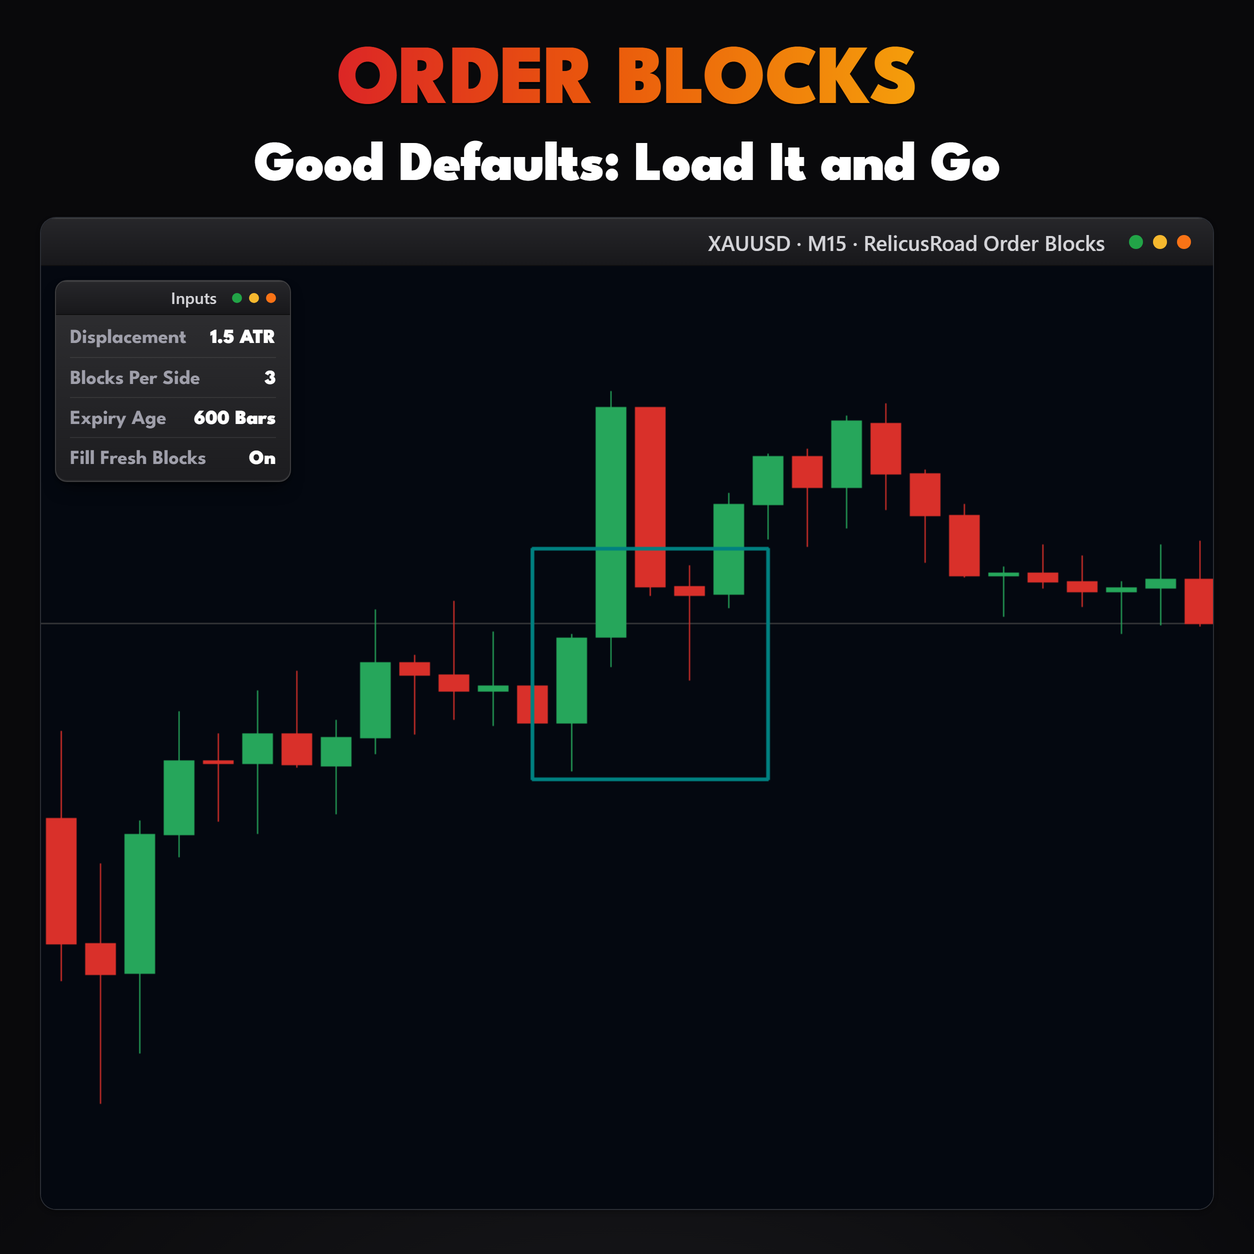
Detection and scoring. Timeframe, to build blocks from the chart or another timeframe. Displacement Body In ATR, 1.5 by default. Minimum Displacement Body Ratio, 0.55. Structure Break Lookback, 20 bars, for the optional bonus. Origin Candle Lookback, 3 candles. Block Half-Life In Bars and Mitigation Depth Decay, which set how quickly strength fades with age and with depth.
Lifecycle and display. Minimum Block Strength, 0.25 by default. Maximum Blocks Per Side, 3. Block Expiry Age, 600 bars. Breaker Acceptance Bars and Breaker Acceptance Close Ratio, the window and the share of closes that flip a block. Fill Fresh Blocks, Border Width and Border Style. One color for each of the four roles.
What It Does Not Do
Worth knowing before you buy:
- It does not send alerts. There are no alert inputs and no alert is produced.
- It does not write text on the chart. The role, state, strength and touch count live in the object name, which you read in the object list or on hover.
- It does not require a break of structure. That only raises the score.
- It does not keep blocks forever. They are dropped below the strength floor, when stronger blocks take their slot, or after 600 bars.
- It does not read more than 1,200 completed bars of the chosen timeframe, and because that window slides forward, blocks near its oldest end can differ from what was drawn earlier.
- It does not place trades or tell you where to enter.
One more thing to know. If RelicusRoad Pro runs in the same terminal, the order block settings saved by its panel replace the inputs of this indicator.
Setup In Three Steps
- Buy it on the MQL5 Market and install it from the Market tab of your terminal.
- Drag RelicusRoad Order Blocks from Navigator, Indicators, Market onto an intraday chart. M5 and above is the usual choice.
- Raise Displacement Body In ATR if you want fewer, larger blocks, or lower it for more.
It runs on forex, gold, indices and crypto. Nothing is drawn until the model has enough history, so
give the chart a moment after you attach it.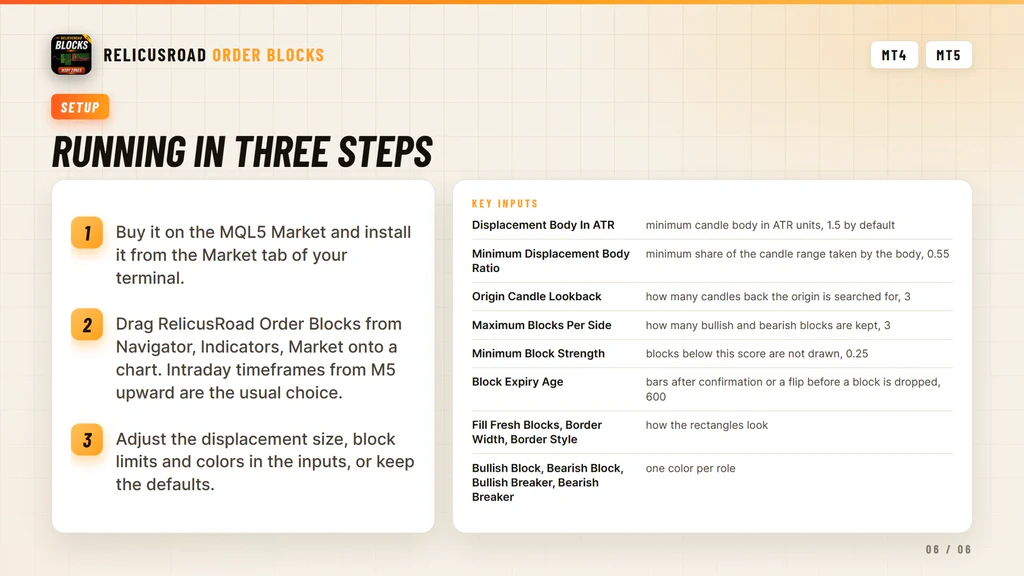
Where It Comes From
Order block detection is the smart money layer of RelicusRoad Pro, published on its own because block traders rarely want a full system attached. It runs standalone.
If you prefer areas built from tested swing levels rather than from the candle behind a move, look at Support Resistance. For the higher-timeframe swing levels that often sit near a block, see Multi Timeframe Levels.
Support runs through the product comments and the mql5.com messaging system.
Frequently Asked Questions
Everything you need to know about RelicusRoad Order Blocks. Still curious? Reach out anytime.
Learn How to Trade It
Every indicator ships with reference documentation and a matching strategy guide. You can also read what other traders say or start with the setup guide.
Indicator Reference
- Road Levels Dynamic S/R levels around a moving center line
- Support & Resistance Advanced S/R zones with alerts
- Action Levels Critical price levels for major moves
- Signal Lines Trend bias filter with two independent lines
- Daily High/Low/Open Daily extremes for range trading
- Daily Pivots Pro pivot points S1-S3, R1-R3
Trading Strategies
- Strategy #1: Price Action (Road) + SR + Trendlines + 2 TFs
- Strategy #2: Local Trendline + Price Position on Road + 2 TFs
- Strategy #3: Arrows + Price Action (Road) + SR
- Strategy #4: MicroScalping + Multiple Pairs + Daily Target 2-10%
Trading Guides
- Non-Repaint Forex Indicators: What 'Non-Repaint' Actually Means (and How to Verify It)
- Prop Firm Challenges: The 'Slow Boring' Strategy to Getting Funded
- Market Sessions Trading: How to Time the 'London-NY Overlap'
- What Is Forex Trading and How Does It Work?
- The Real Cost of Trading Platforms in 2026: A Broker-Neutral Teardown
- Position Sizing: The Boring Math That Keeps Traders Alive
- Forex Trading Psychology: 7 Traps and Process Fixes
Related tools
Single RelicusRoad indicators for MT4 and MT5, each one standalone.



