


CLEAR ENTRIES. CLEAR EXITS.
See where price may turn before it gets there. Then wait for the signal.
Why You Still Enter Late
You already learned strategies, watched videos, and tried indicators or signal groups. Yet you still enter after the move is gone, or lose money when the market goes flat. Five random indicators give five different answers, and chat rooms text you too late.
The Missing Piece: Zones Drawn Before Price Gets There
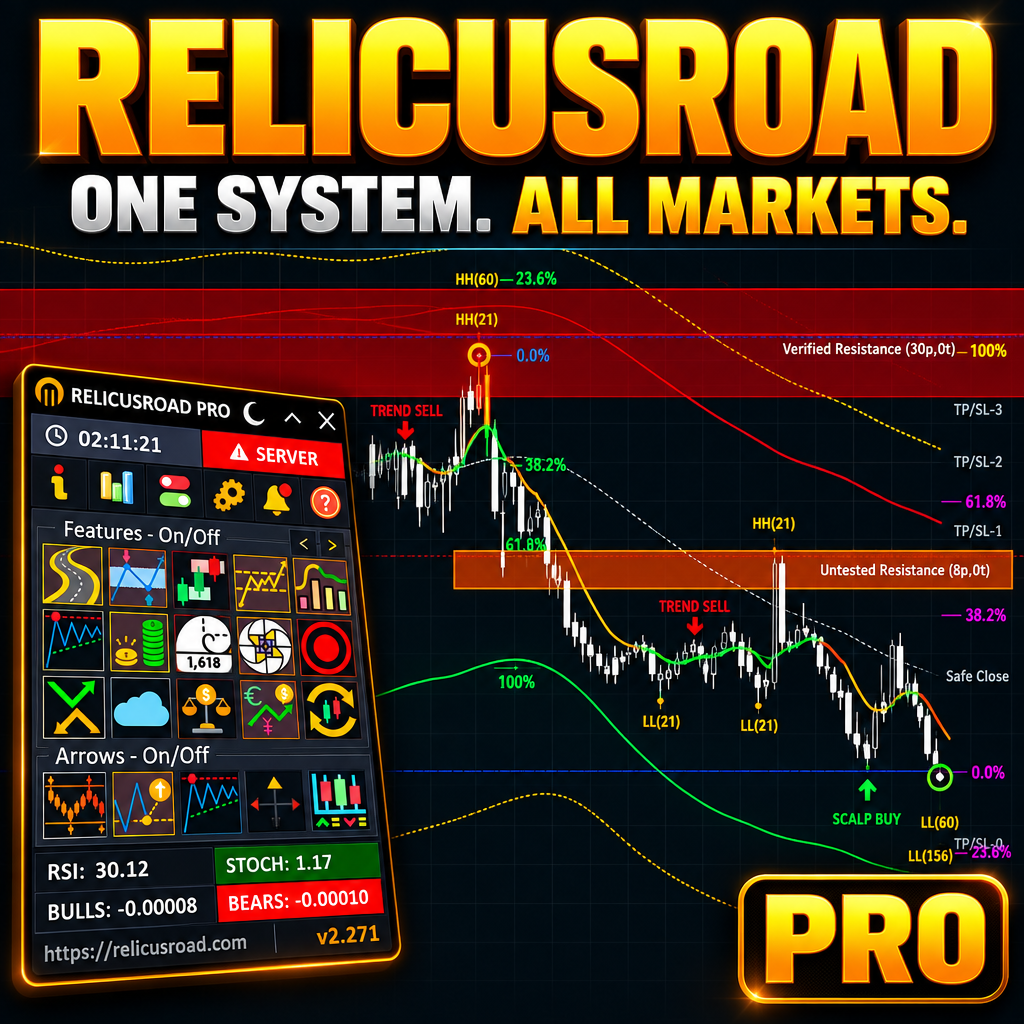
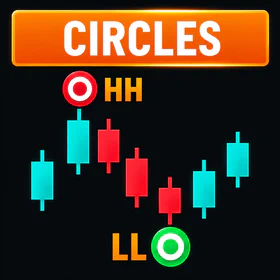
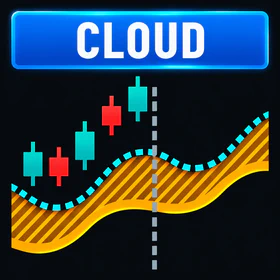
You need to see the zones on your own chart before price gets there. We built RelicusRoad in 2014 so we could stop drawing zones by hand every morning. It marks swing highs and lows, support and resistance, and order blocks ahead of time using clear, rule-based math.
Plan Your Entry, Stop, and Target First
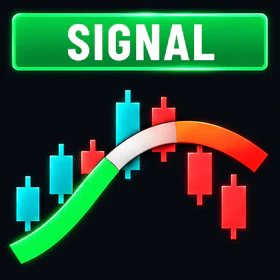
When you see the zone early, you stop chasing candles. RelicusRoad Pro runs on your own MT4, MT5, and TradingView charts to show entry and exit signals right next to the zones and trend lines on your chart. In flat stretches, Signal Line often turns gray, so you can skip flat markets.
One Simple Check Before Every Trade
Check the zone, check the trend, and wait for the candle to close. Used by traders who manage $100M+ portfolios. Rated 4.9 stars.
SEE WHY. BEFORE YOU ENTER.
Never follow a blind call again. See the zone and trend behind every signal on your own chart.
A Clean Chart You Can Read in Seconds
Messy charts make you freeze, and blind arrows hide the risk. RelicusRoad Pro puts the zone and the signal together so you can plan your stop and target before you enter.
Turn on only the two or three tools you use from the chart panel, and hide the rest so your screen stays clean.
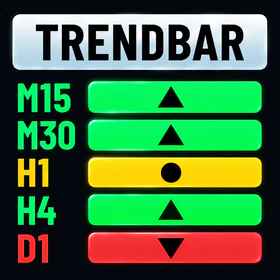
See the Trend and the Key Zones
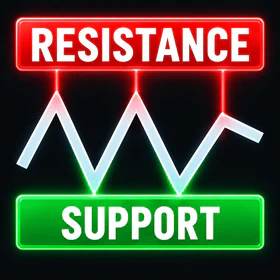
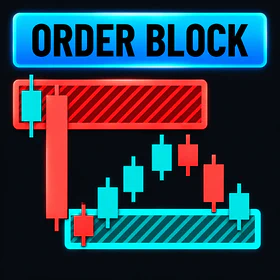
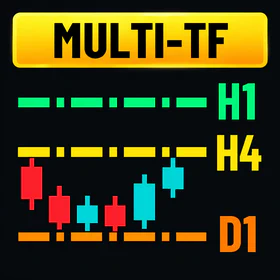
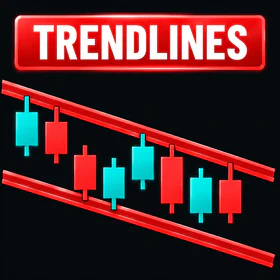
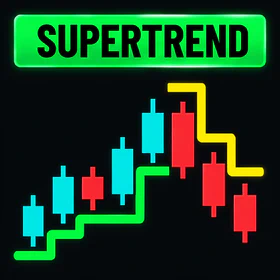
All 16 individual indicators, plus Candle Patterns and History Arrows, are included in Pro. You can also buy single indicators on their own.


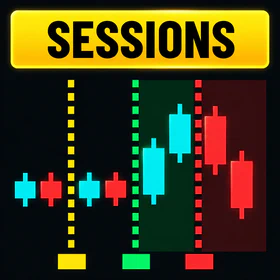

What RelicusRoad Pro Does Not Do
It is not an auto-trading bot. It never opens or closes trades for you. You stay in control of every order.
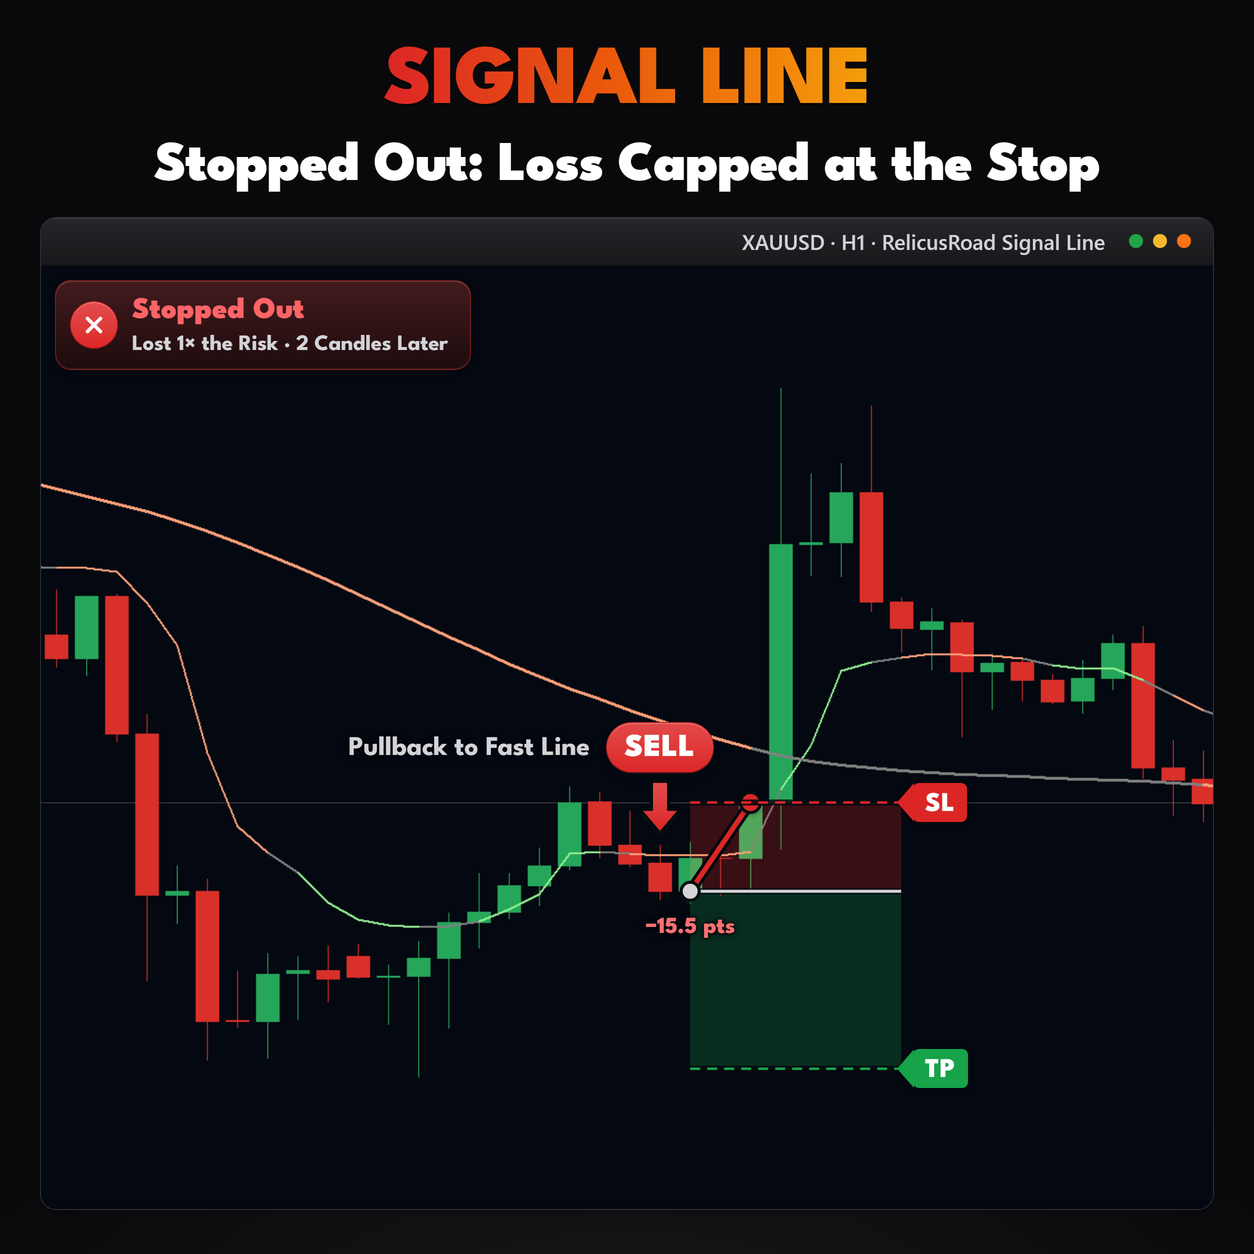
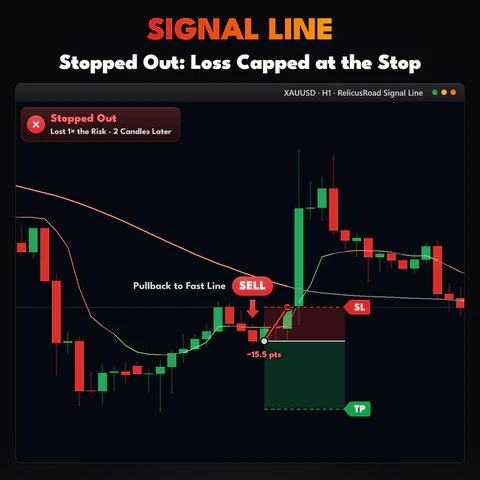
It does not win every trade. No indicator can predict news spikes or stop every loss. When a level breaks, your stop caps the loss.
Some drawing tools move. Support & Resistance, Trendlines, and Scalping Pivots update as new bars form. See the repaint answer in the FAQ below.
4.9-Star Rating
How Traders Use It to Stop Guessing
See how traders use these zones and signals every day in our Discord community and on the MQL5 Market. Read more reviews.
Open your chart and the zones and trend lines are already drawn. Instead of drawing lines by hand every morning, turn on the two or three tools you use and wait for price to reach a zone.
No indicator wins every trade. Below you can check both winning setups and a stopped-out trade where the stop capped the loss.
See Winning Setups and How a Stop Caps a Loss


Daily Setups From Traders Using the Same Plan
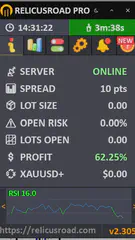
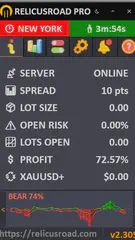
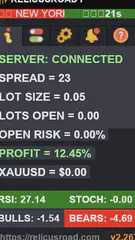
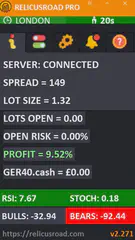
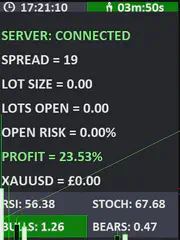
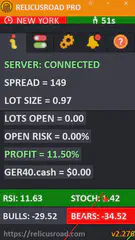
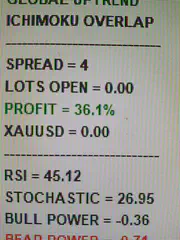
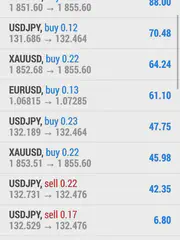
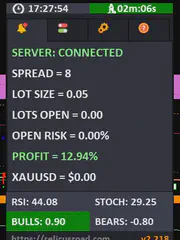
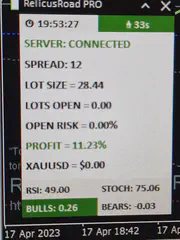
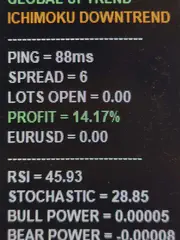
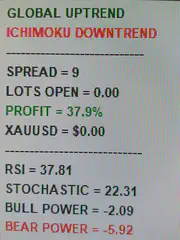
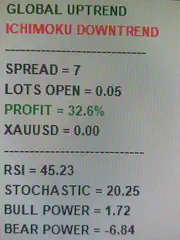
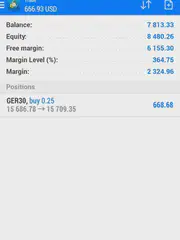
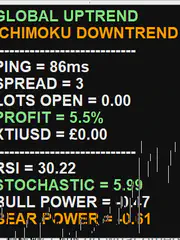
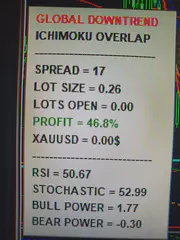
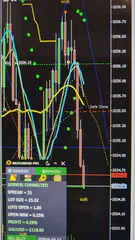
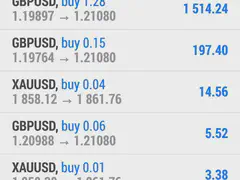
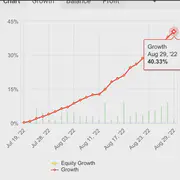
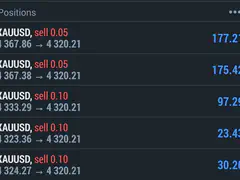
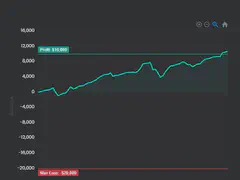
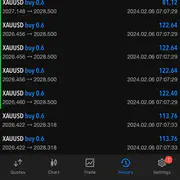
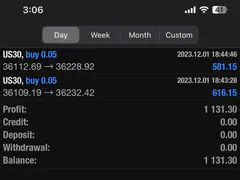
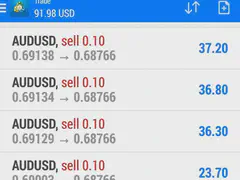
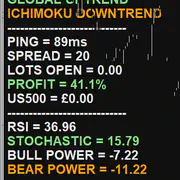
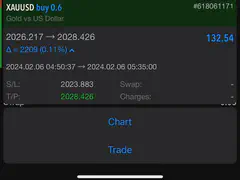
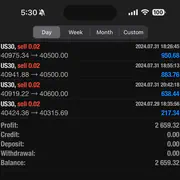
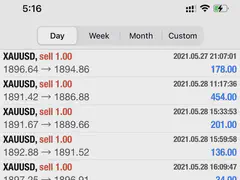
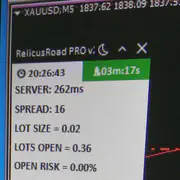
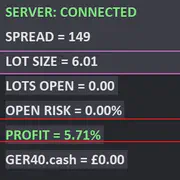
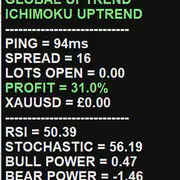
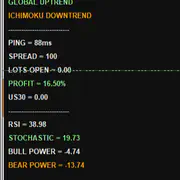
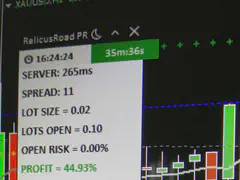
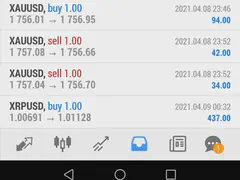
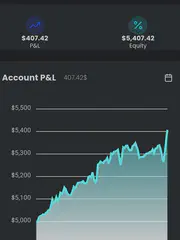
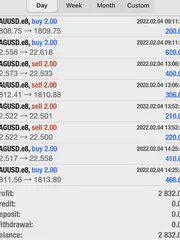
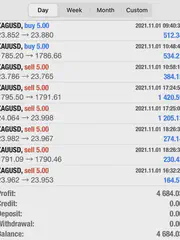
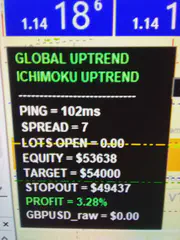
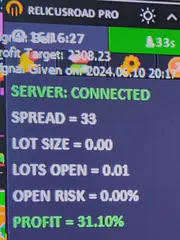
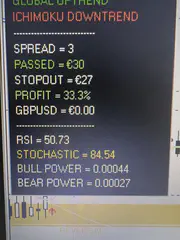
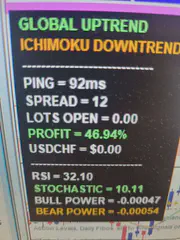
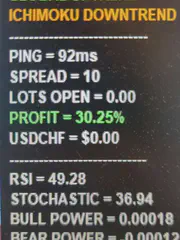
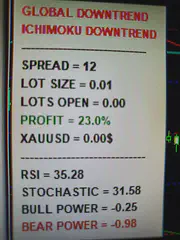
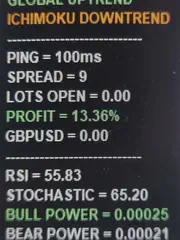
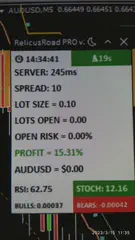
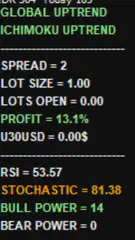
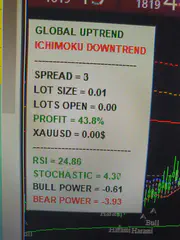
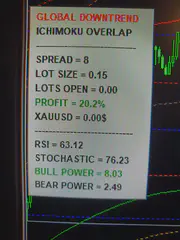
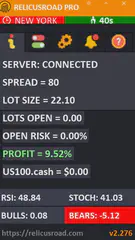
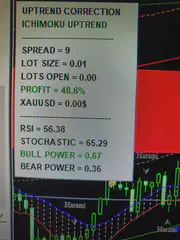
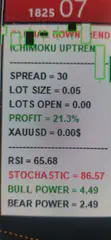
Shared by members in our Discord. Past results don't promise future results.
Trade Alongside 2,000+ Members on Discord
Get setup help within 24 hours, compare daily charts, and learn the routine faster.
There is a great community who are supportive of each other, the support is top notch, I've never had that before.

v2.321 · Smoother and steadier on long sessions
Frequently Asked Questions
Straight answers before you try it on your own charts. Still have a question? Reach out anytime.
Reviews & Testimonials
Super Clean and Accurate
Enjoy the Community
Excellent Manual & Instructions
Everything in One Place
Wonderful Indicator - Great Support
Helping Massively
Truly AMAZING!
Way Easier Install
Timely Support
One Singular Indicator
Great Indicator with Learning Curve
The support team has been helpful in addressing my questions through the Discord community. There's definitely a learning curve with this indicator, but once you get the hang of it, the results speak for themselves. The comprehensive training materials and community support make it worthwhile for serious traders.
From Zero Knowledge
Community Makes a Difference
Scalping Signals
Flexible for My Style
Top-Notch Service
A Stunning Piece of Art
Vision and Integrity
Great Indicator, Always Improving
Immense Help
Love the Visual Controls
Short Sharp Moves
Steady Profits
Great Addition
Members' own words. Results differ for everyone, and trading carries risk.
Learn How to Trade It
Every indicator ships with reference documentation and a matching strategy guide. You can also read what other traders say or start with the setup guide.
Indicator Reference
- Road Levels Dynamic S/R levels around a moving center line
- Support & Resistance Advanced S/R zones with alerts
- Action Levels Critical price levels for major moves
- Signal Lines Trend bias filter with two independent lines
- Daily High/Low/Open Daily extremes for range trading
- Daily Pivots Pro pivot points S1-S3, R1-R3
Trading Strategies
- Strategy #1: Price Action (Road) + SR + Trendlines + 2 TFs
- Strategy #2: Local Trendline + Price Position on Road + 2 TFs
- Strategy #3: Arrows + Price Action (Road) + SR
- Strategy #4: MicroScalping + Multiple Pairs + Daily Target 2-10%
Trading Guides
- Non-Repaint Forex Indicators: What 'Non-Repaint' Actually Means (and How to Verify It)
- Prop Firm Challenges: The 'Slow Boring' Strategy to Getting Funded
- Market Sessions Trading: How to Time the 'London-NY Overlap'
- What Is Forex Trading and How Does It Work?
- The Real Cost of Trading Platforms in 2026: A Broker-Neutral Teardown
- Position Sizing: The Boring Math That Keeps Traders Alive
- Forex Trading Psychology: 7 Traps and Process Fixes
Related tools
Single RelicusRoad indicators for MT4 and MT5, each one standalone.