
What It Does
Draw a Fibonacci tool by hand and you make two decisions: which swing to measure, and where its two ends are. RelicusRoad Scalping Pivots makes both for you and keeps them current.
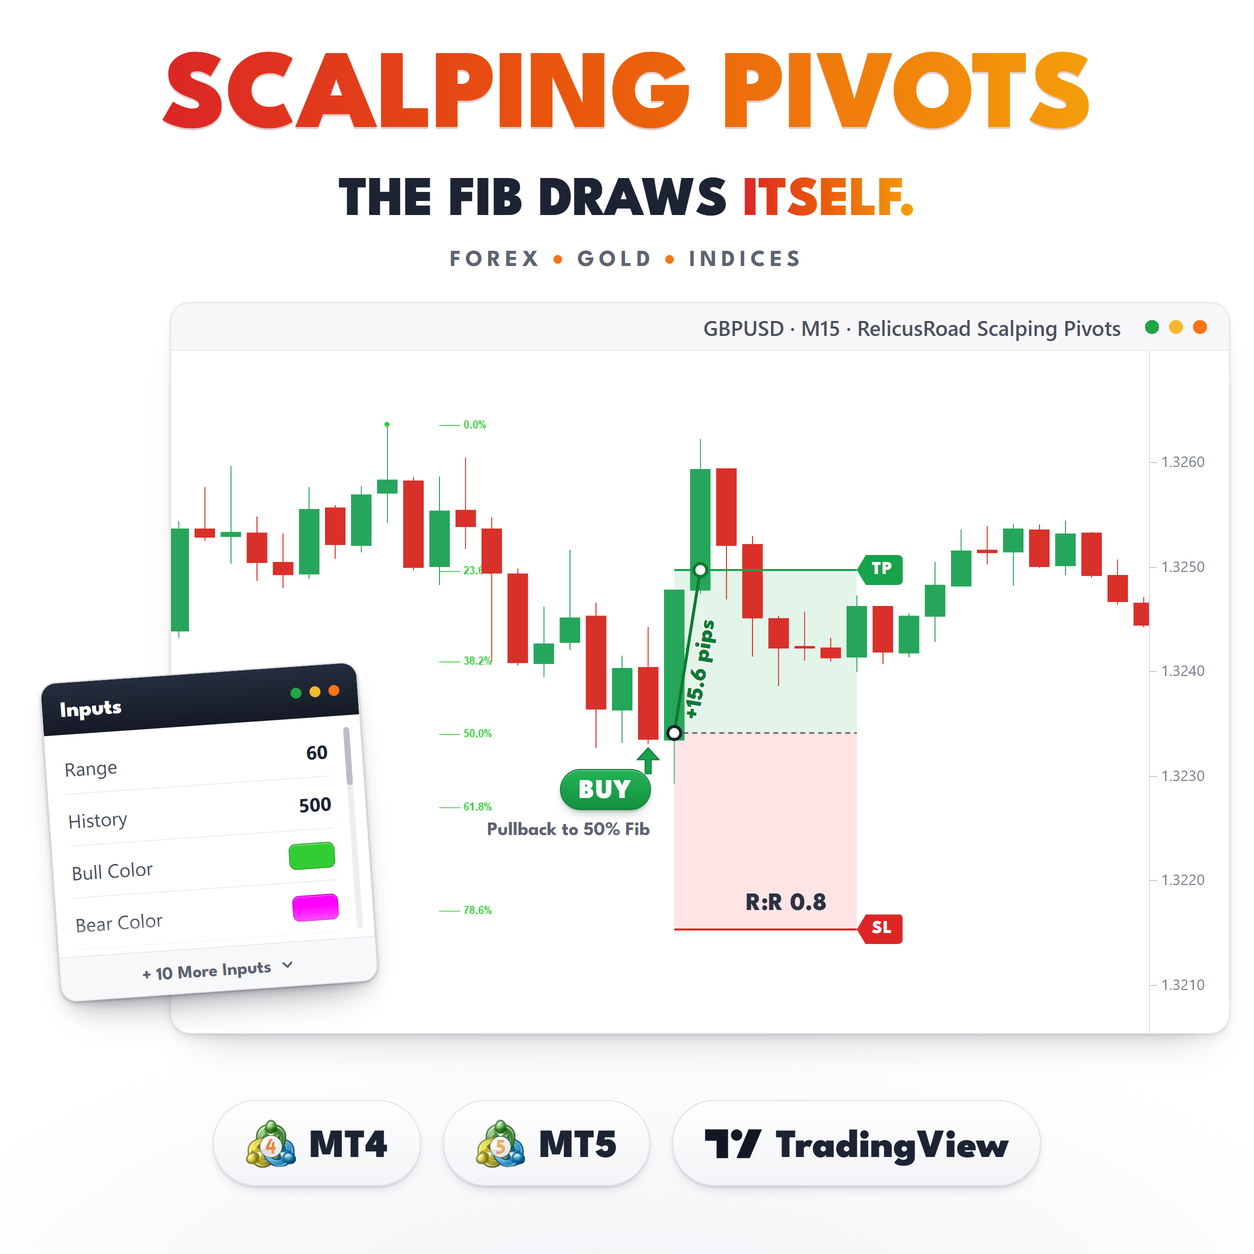
It marks alternating swing highs and swing lows over a rolling 60 bar lookback, one dot each, and prints a ladder of Fibonacci percentages beside the most recent swing on each side. The ladder is text only. No lines stretch across your chart, so the levels stay next to the leg they belong to.
The name says pivots, and it is worth being clear: these are swing points, not the PP, R1 and S1 of
classic floor pivots.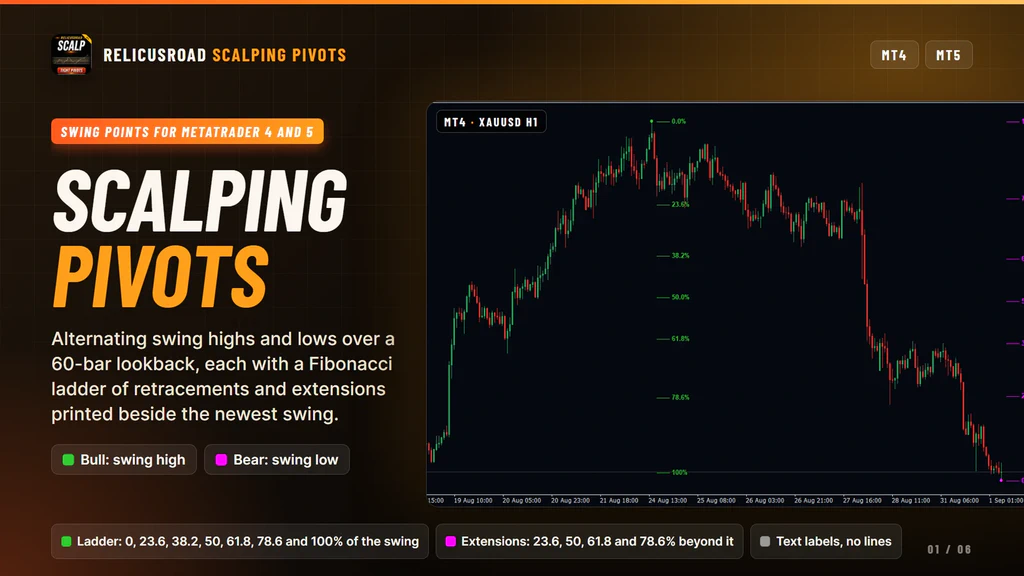
How It Works
A bar is a swing high when no bar in the last 60 has a higher high, counting the bar itself. Swing lows are the mirror. The test only looks backwards, so a bar qualifies as soon as it is the extreme so far, with no waiting for later bars.
A second pass then thins the marks out. Inside one up-leg only the most extreme high survives, and inside one down-leg only the deepest low. What is left alternates, high, low, high, low, which is exactly the sequence a Fibonacci measurement needs.
From the newest swing on each side, the indicator builds a ladder:
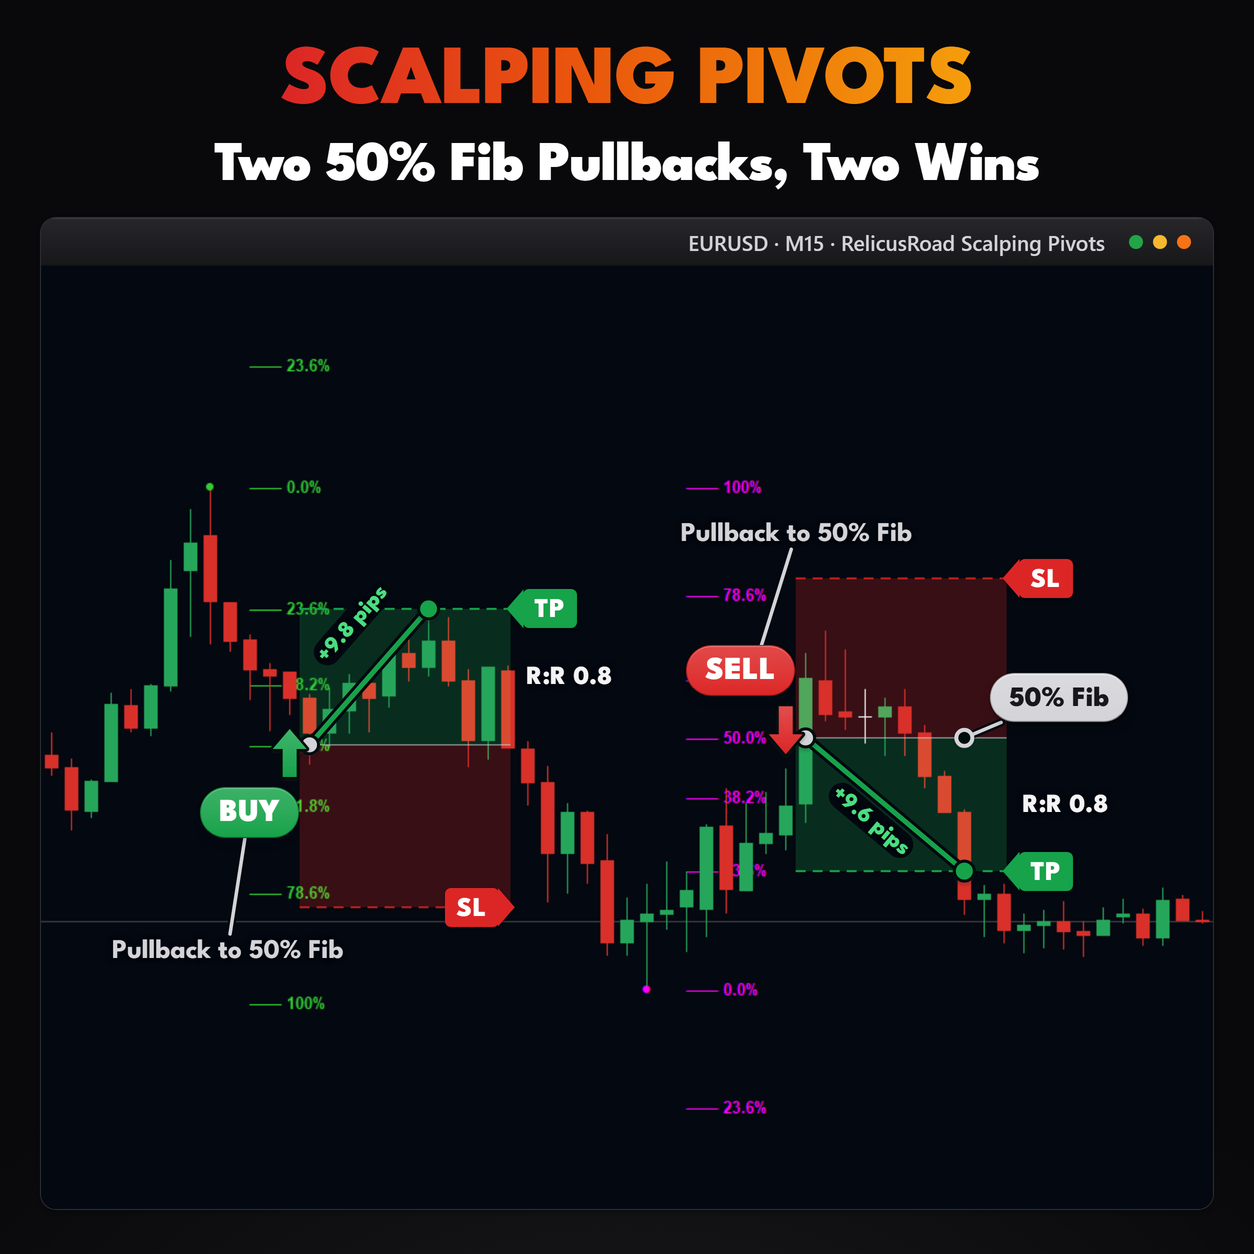
- Bull ladder. 0.0 percent sits at the swing high, retracements of 23.6, 38.2, 50.0, 61.8 and 78.6 percent step down towards the paired swing low, and 100 percent sits on it. Extensions of 23.6, 50.0, 61.8 and 78.6 percent are placed above the high.
- Bear ladder. The same layout anchored at the swing low, with its extensions below.
Each level is a short dash followed by its percentage, starting two bars to the right of the swing it
measures.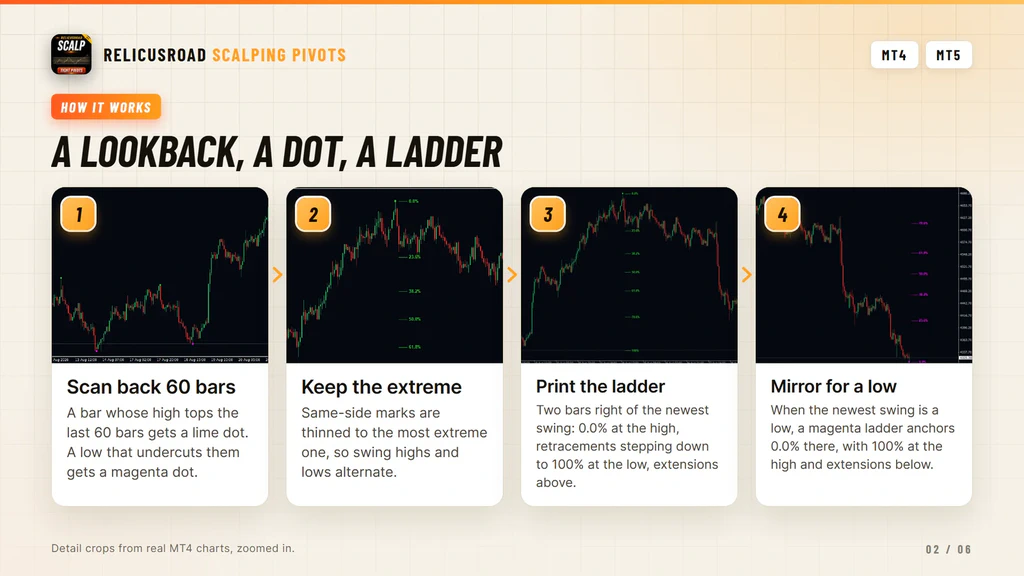
The Dots Repaint, And Bull Means High
Two honest notes, both of which matter more than any setting in the dialog.
The dots are not confirmed swings. Because the test looks only backwards, a dot appears immediately on whichever bar is currently the extreme, and it is removed and redrawn further along if price extends in the same direction before the opposite swing forms. The ladder moves with it. That is the trade you make for having a live measurement on the newest leg instead of one that arrives late. If you want swings that never move once printed, RelicusRoad Fractals waits for closed bars on both sides and does exactly that.
The second note is the naming. In this tool Bull marks the swing high and Bear marks the swing low,
which is the opposite of how many traders use the words. A Bull ladder measures an up-leg from its low
to its high. A Bear ladder measures a down-leg from its high to its low. Once you read it as the name
of the leg rather than the name of the point, it stops being confusing.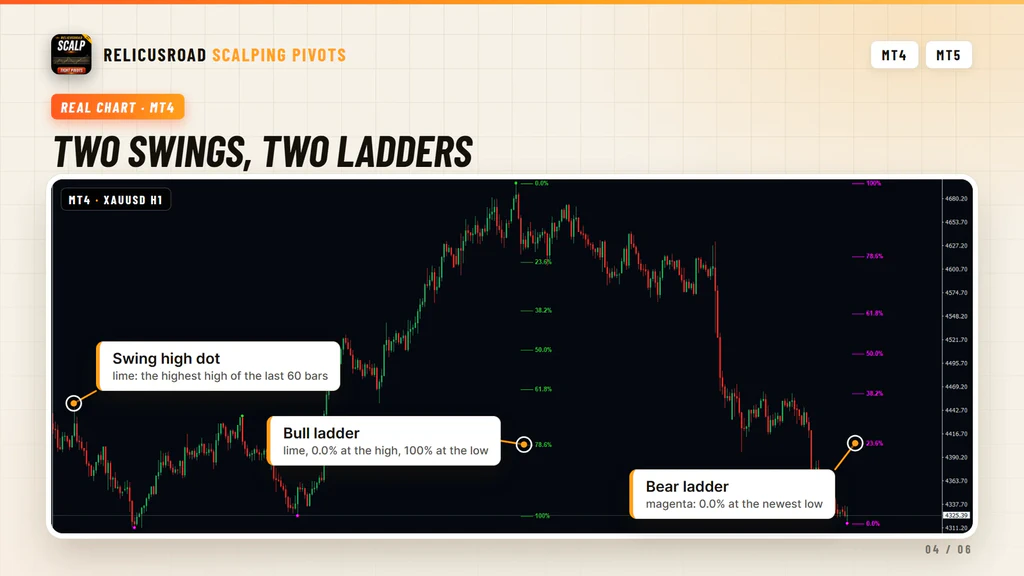
What You See On The Chart
| Element | Meaning |
|---|---|
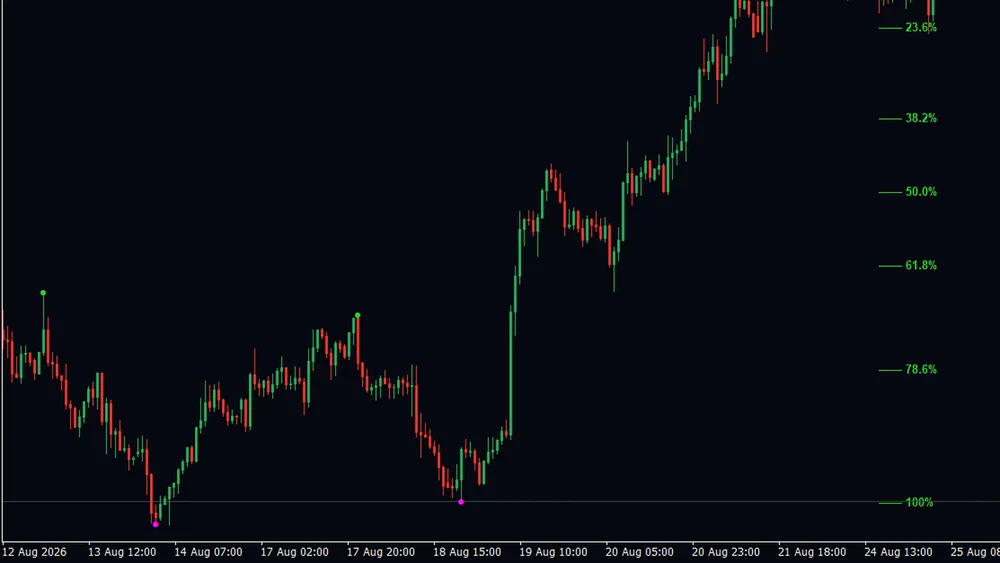
| Lime dot | A swing high, drawn at the exact high of the bar |
| Magenta dot | A swing low, at the exact low |
| Lime percentage labels | The bull ladder: 0.0 percent at the high down to 100 percent at the paired low |
| Magenta percentage labels | The bear ladder, anchored at the low |
| Extension labels | 23.6, 50.0, 61.8 and 78.6 percent beyond the swing, past the end of the leg |
| Tooltip | The same percentage, for when labels sit close together |
- Lime dot
- A swing high, drawn at the exact high of the bar
- Magenta dot
- A swing low, at the exact low
- Lime percentage labels
- The bull ladder: 0.0 percent at the high down to 100 percent at the paired low
- Magenta percentage labels
- The bear ladder, anchored at the low
- Extension labels
- 23.6, 50.0, 61.8 and 78.6 percent beyond the swing, past the end of the leg
- Tooltip
- The same percentage, for when labels sit close together
The ratios 23.6, 50.0, 61.8 and 78.6 appear twice, once as a retracement inside the leg and once as an
extension beyond it. Read each label by where it sits: inside the leg or past its end.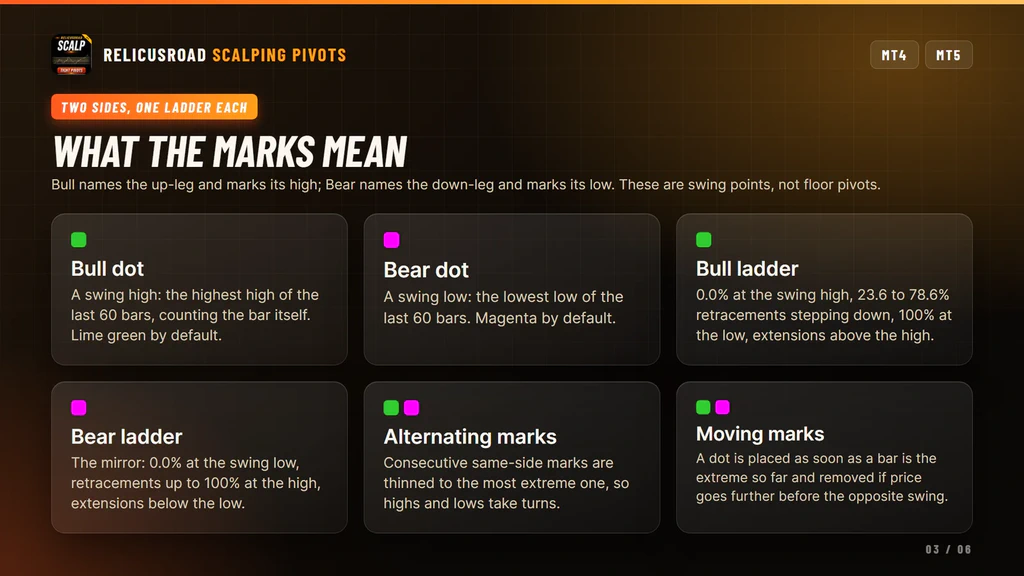
What It Does For Your Trading
Four things, each one on a real chart so you can judge it before you buy.
Finds The Swing You Would Measure
A bar whose high tops the last 60 bars gets a lime dot, and a low that undercuts them gets a magenta one. The marks are thinned so highs and lows alternate down the chart.
That alternating sequence is the one thing a Fibonacci measurement needs, and it is picked the same way every time instead of by eye at the end of a long session.
Retracement Levels Without The Tool
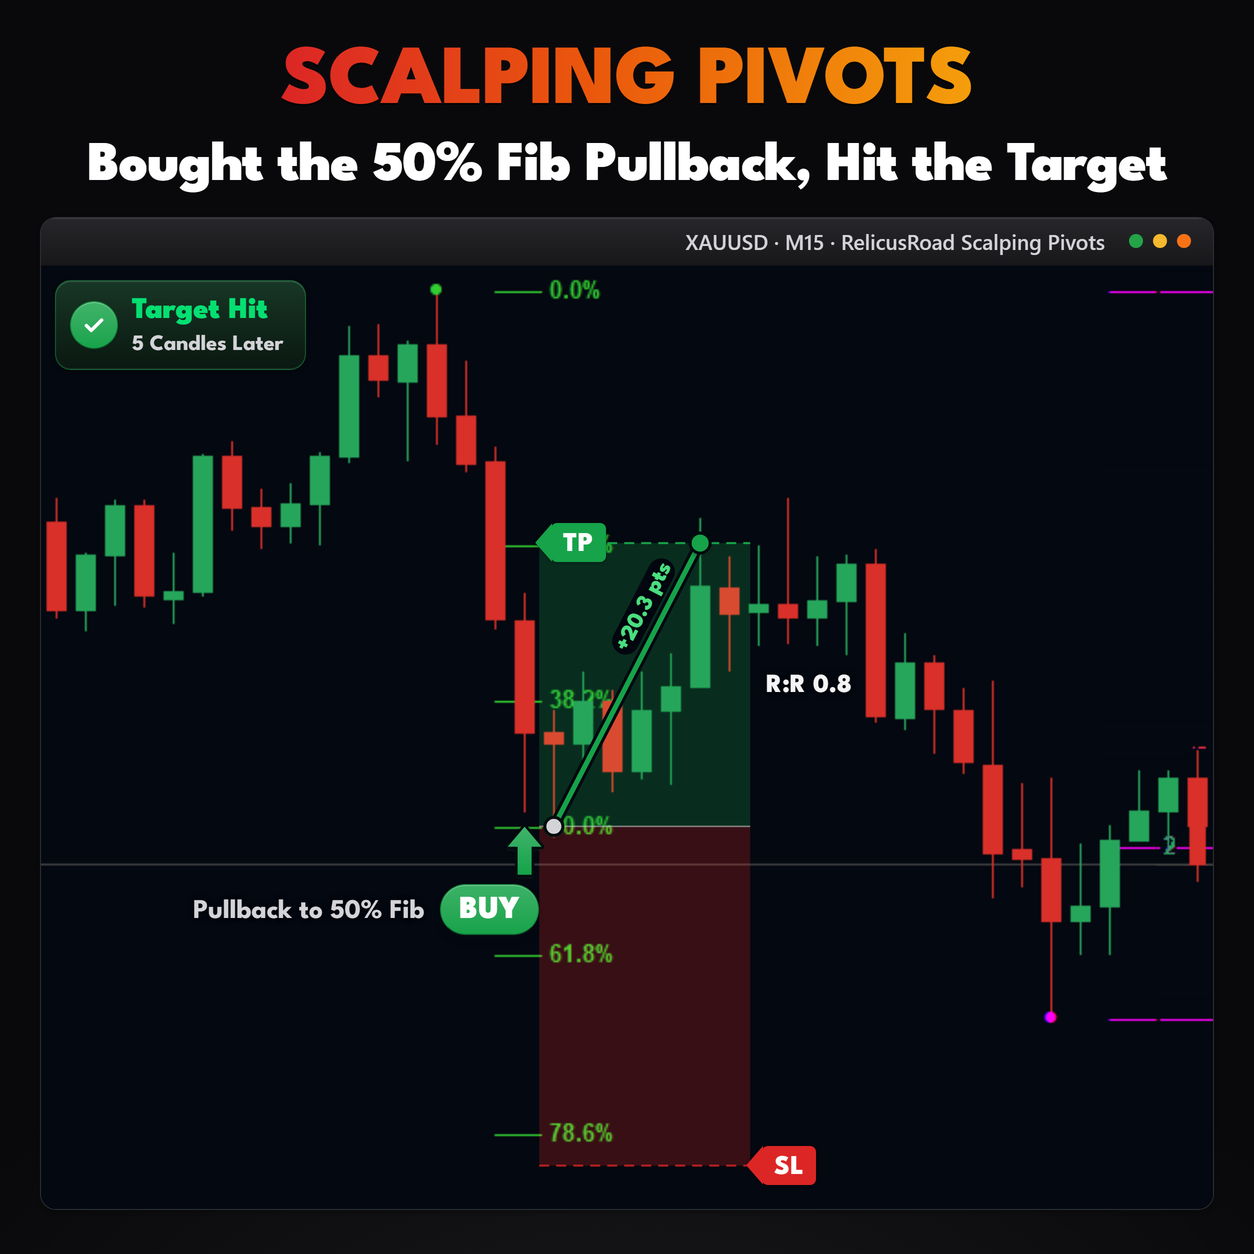
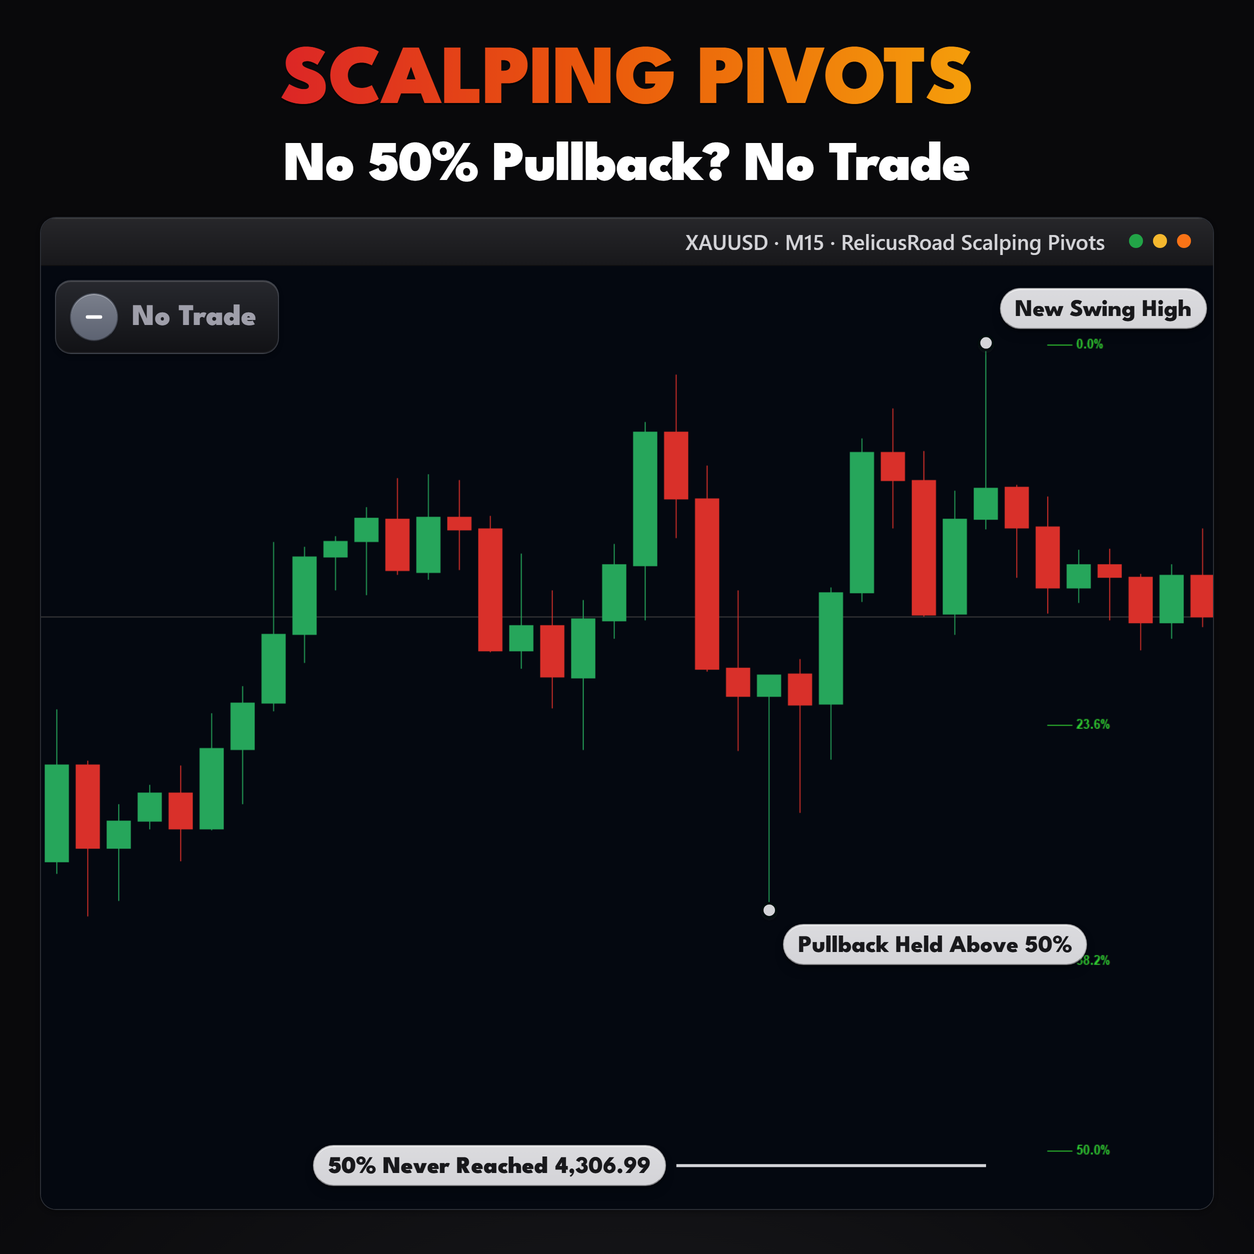
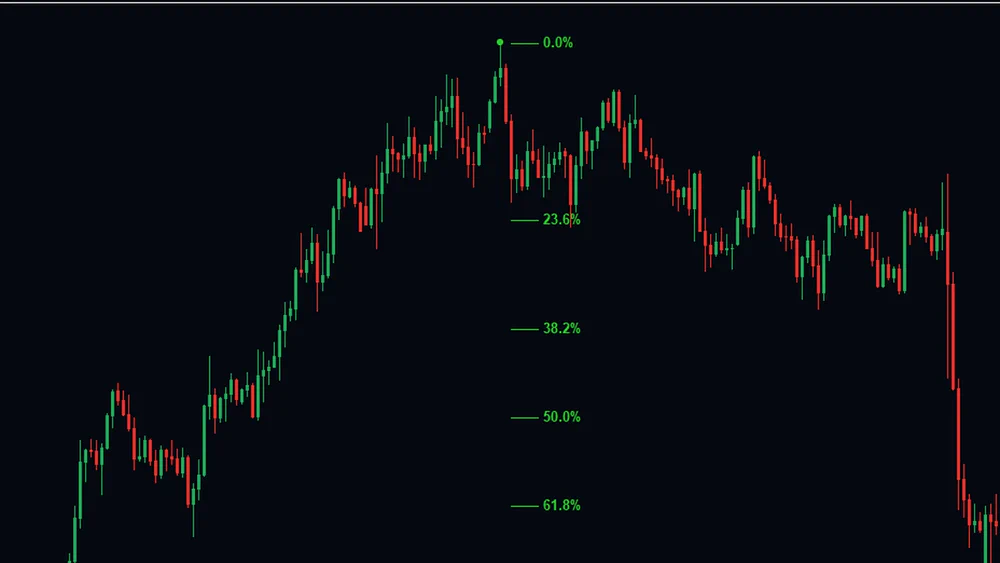
Two bars to the right of the newest swing, the ladder prints: 0.0 percent at the swing itself, then 23.6, 38.2, 50.0, 61.8 and 78.6 percent stepping into the leg, with 100 percent at its other end.
The pullback levels are on the chart before the pullback starts, so you are reading a level rather than dragging a tool while price moves.
Measures The Whole Leg
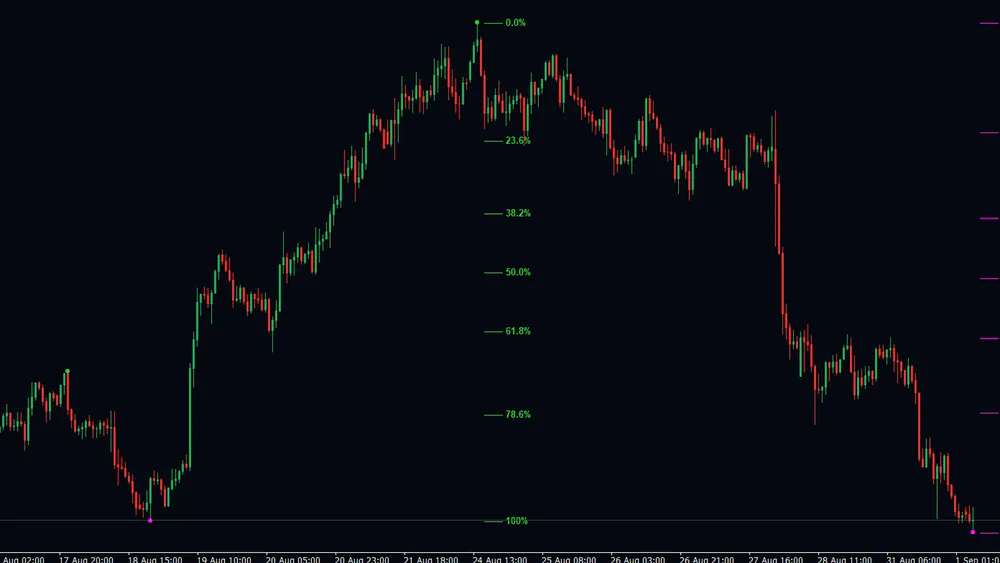
The ladder spans the leg it belongs to, from the swing high at 0.0 percent to the paired swing low at 100 percent, and the labels stay beside that leg rather than stretching across the chart.
Nothing else on the chart gets covered up. You can still see the candles that made the move, which is where the decision comes from.
Both Legs, Side By Side
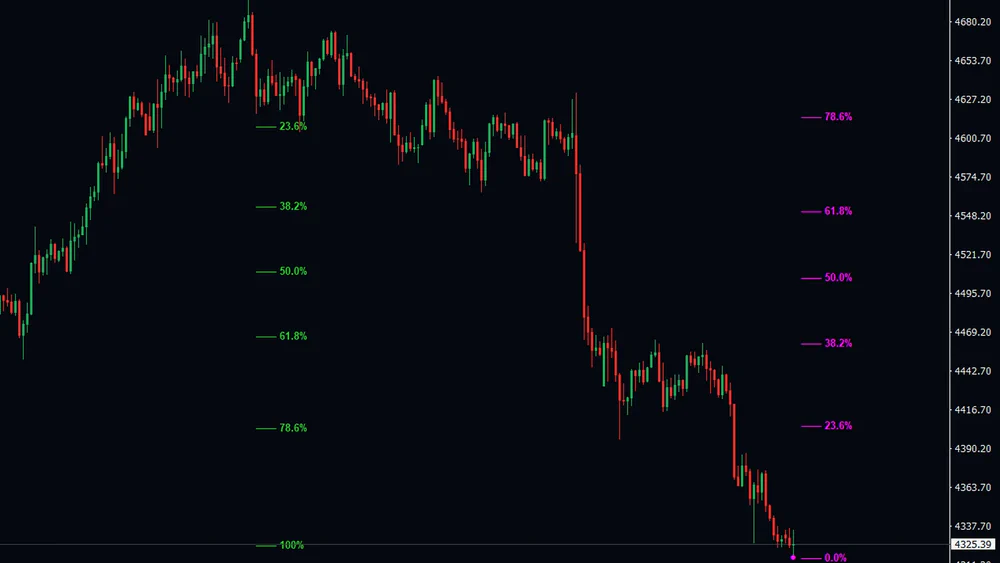
The magenta ladder mirrors the lime one from the newest swing low, so the last up-leg and the last down-leg are measured at the same time. When their labels line up at a similar price, two legs agree about that level.
The honest part is the newest dot. It is placed as soon as its bar is the extreme, so it can move if price pushes further before the opposite swing forms. That is the price of a measurement that is live instead of one that arrives when the leg is already over.
Reading It On A Live Chart
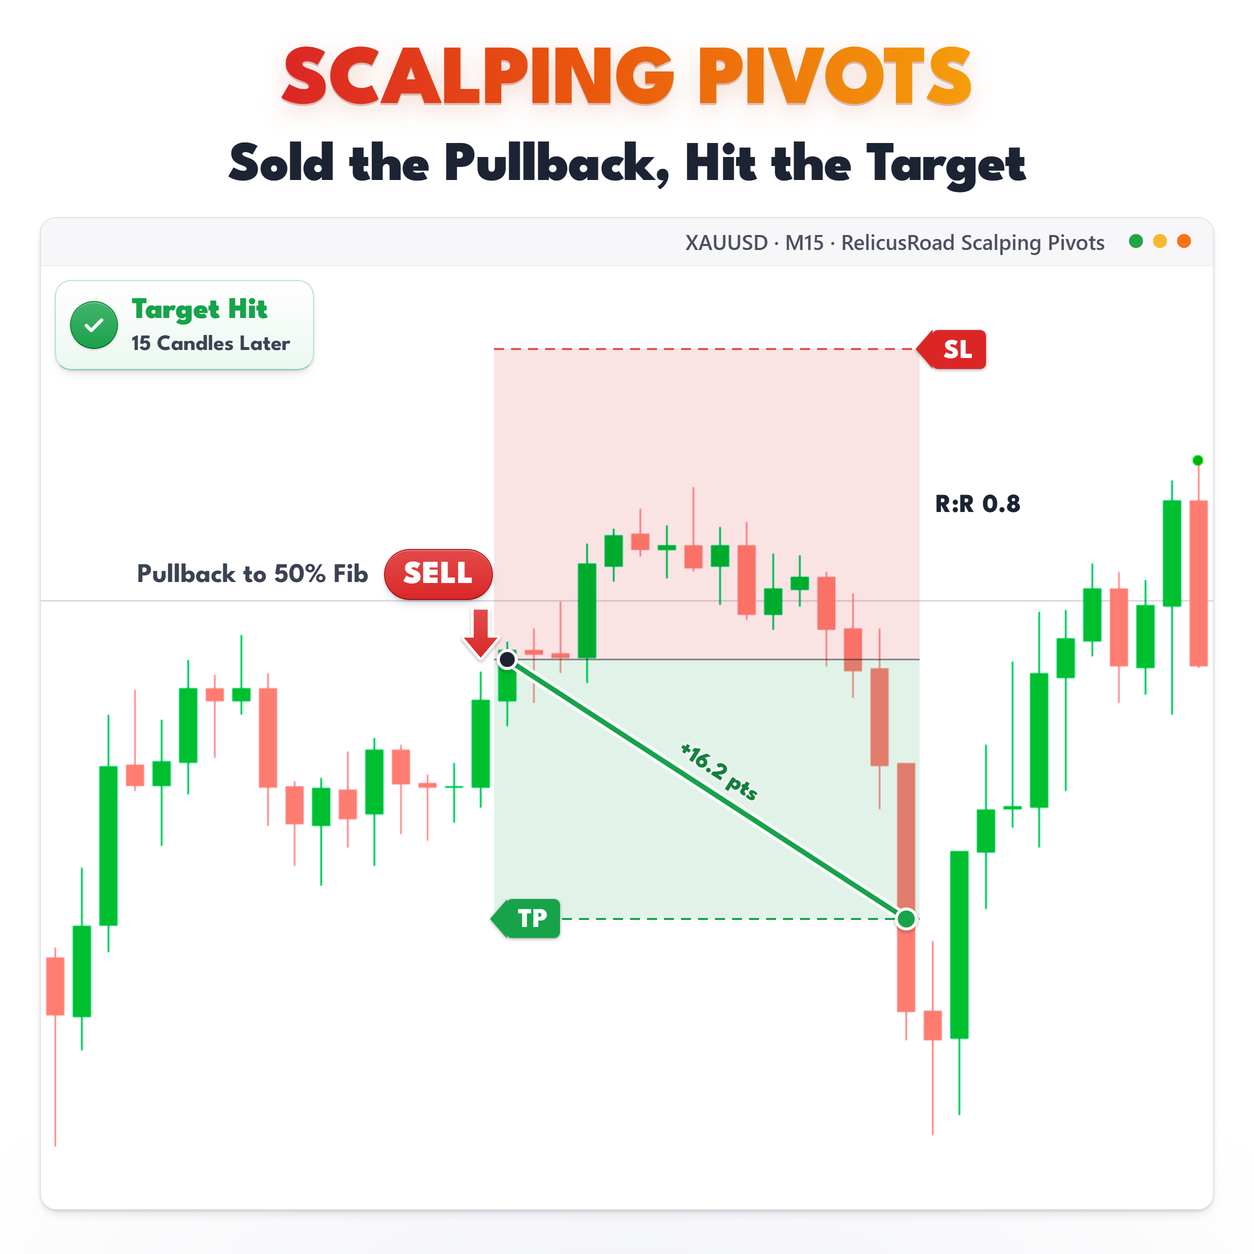
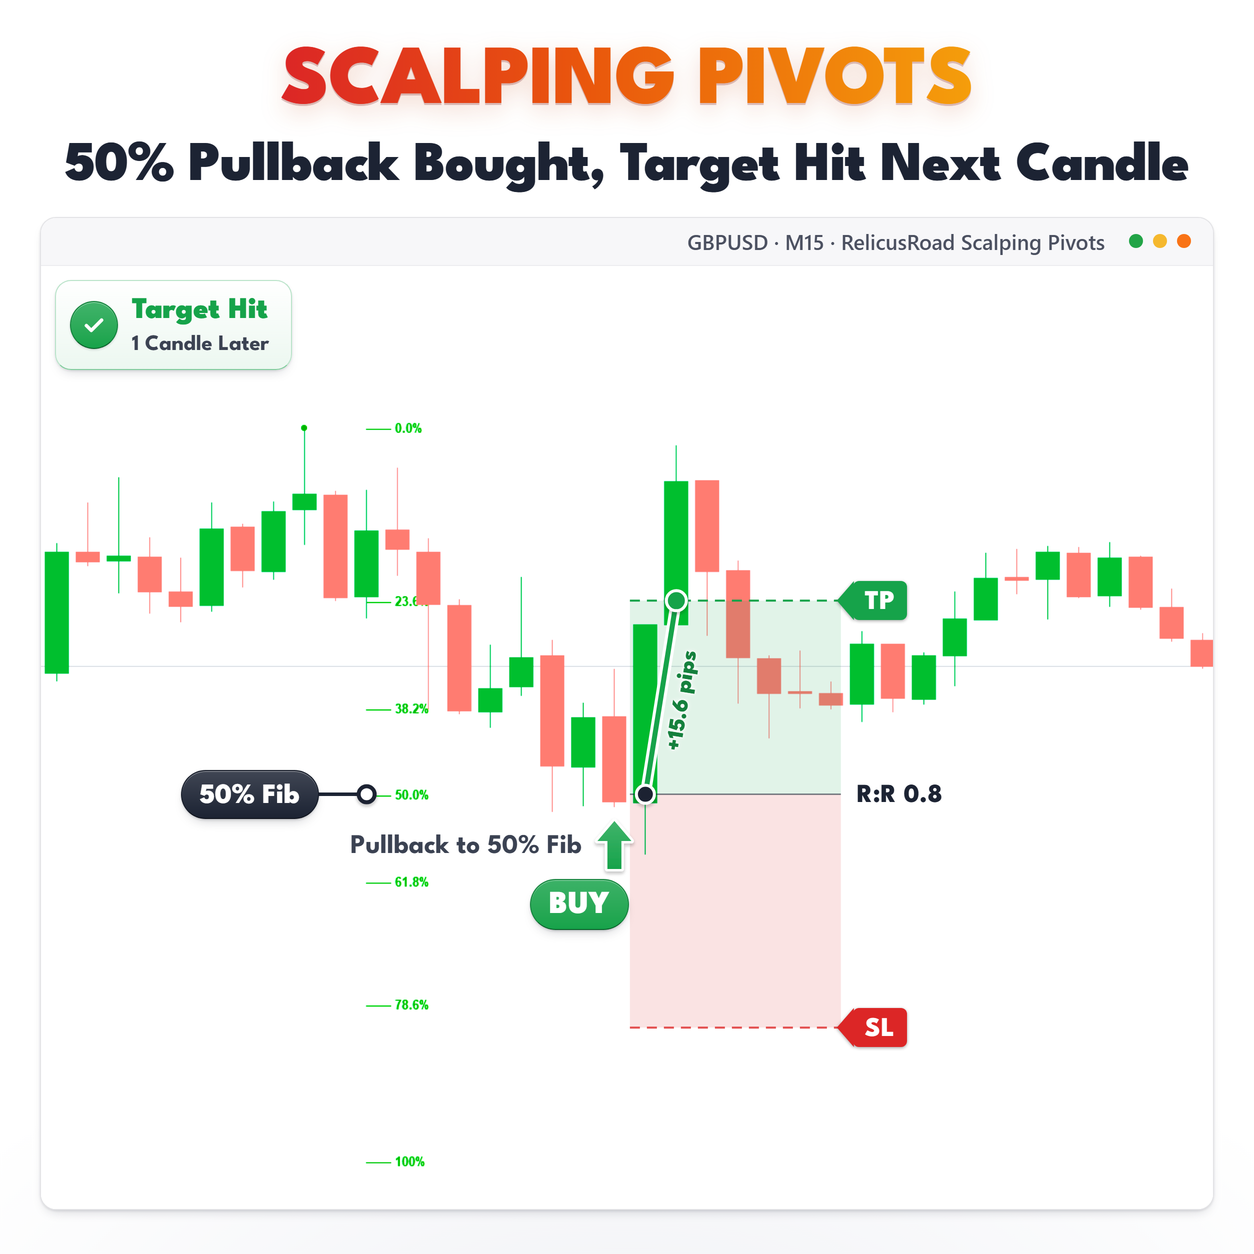
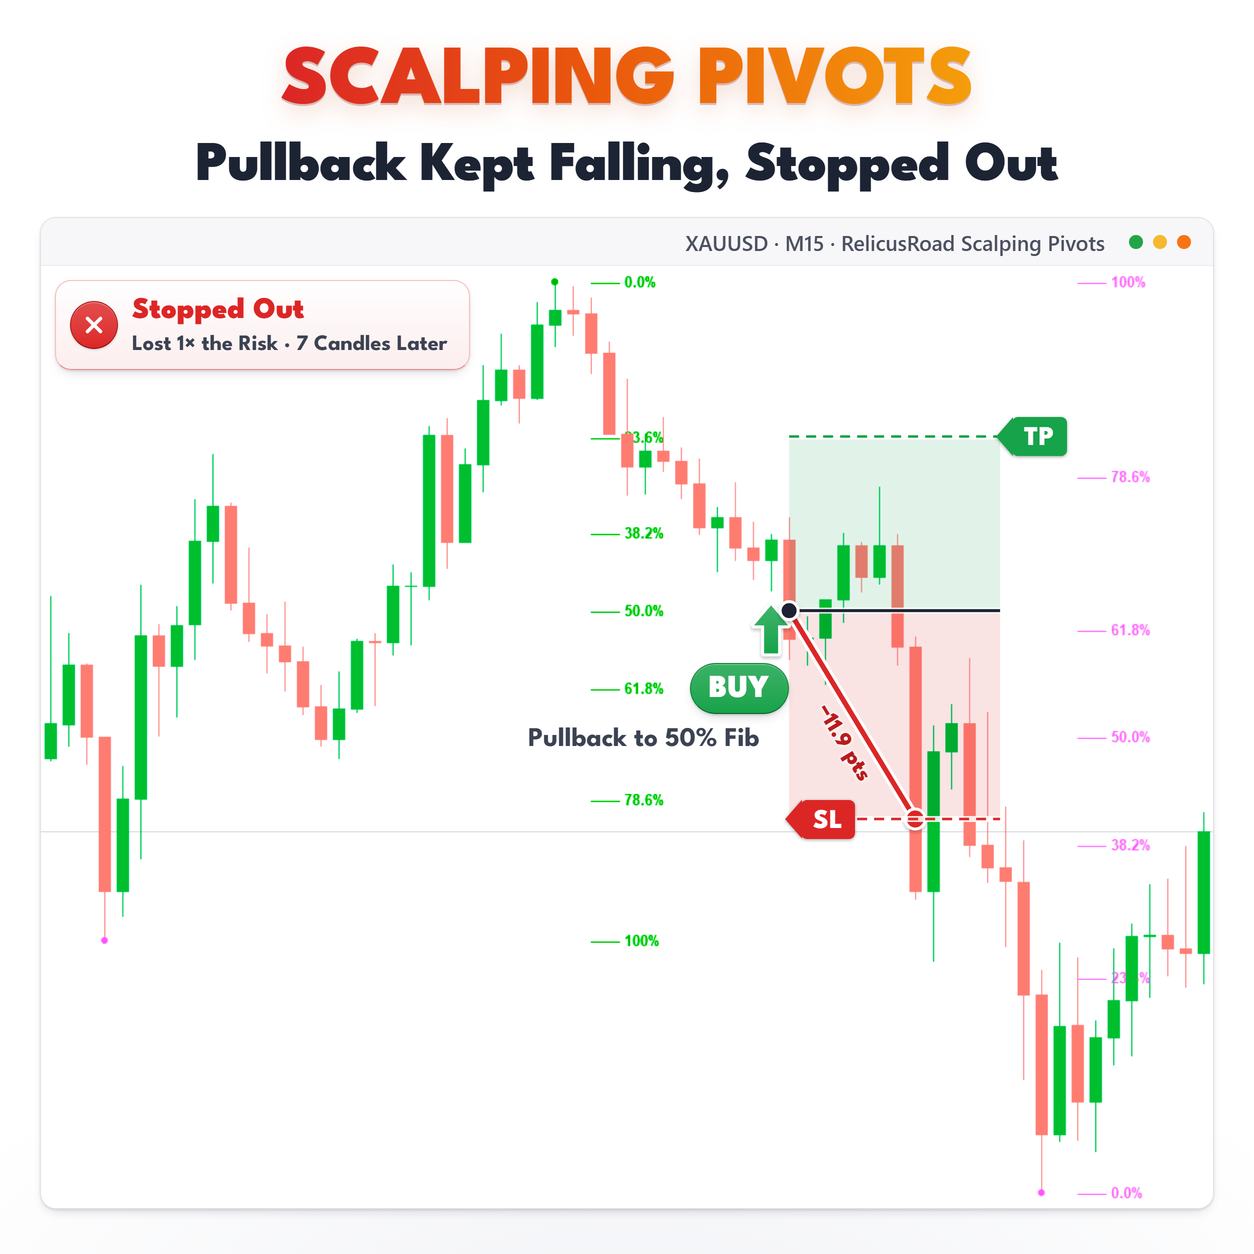
On an M5 or M15 chart the usual sequence is simple. A magenta dot appears at the bottom of a drop, the bear ladder prints beside it, and as price bounces you can read how far the bounce has gone as a percentage of that leg. The 50.0 and 61.8 percent labels are the ones most traders watch for a pullback to stall.
Both ladders can be on the chart at once, one for the last up-leg and one for the last down-leg. When their labels sit at similar prices, the two legs agree about a level, which is worth more than either on its own.
The labels measure the leg. They do not say the leg is finished, and a percentage being reached is not
a signal to trade it.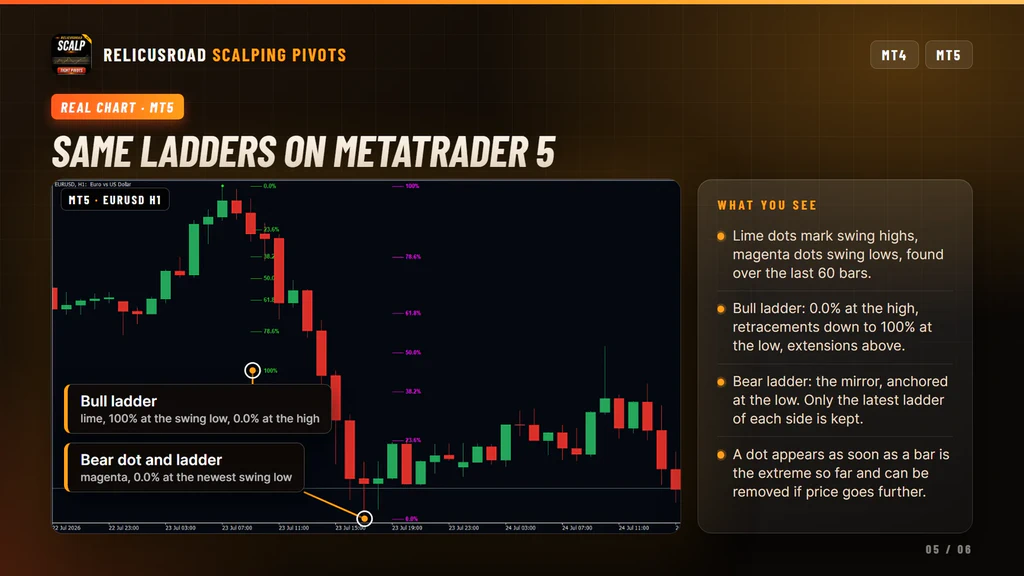
Settings You Can Change
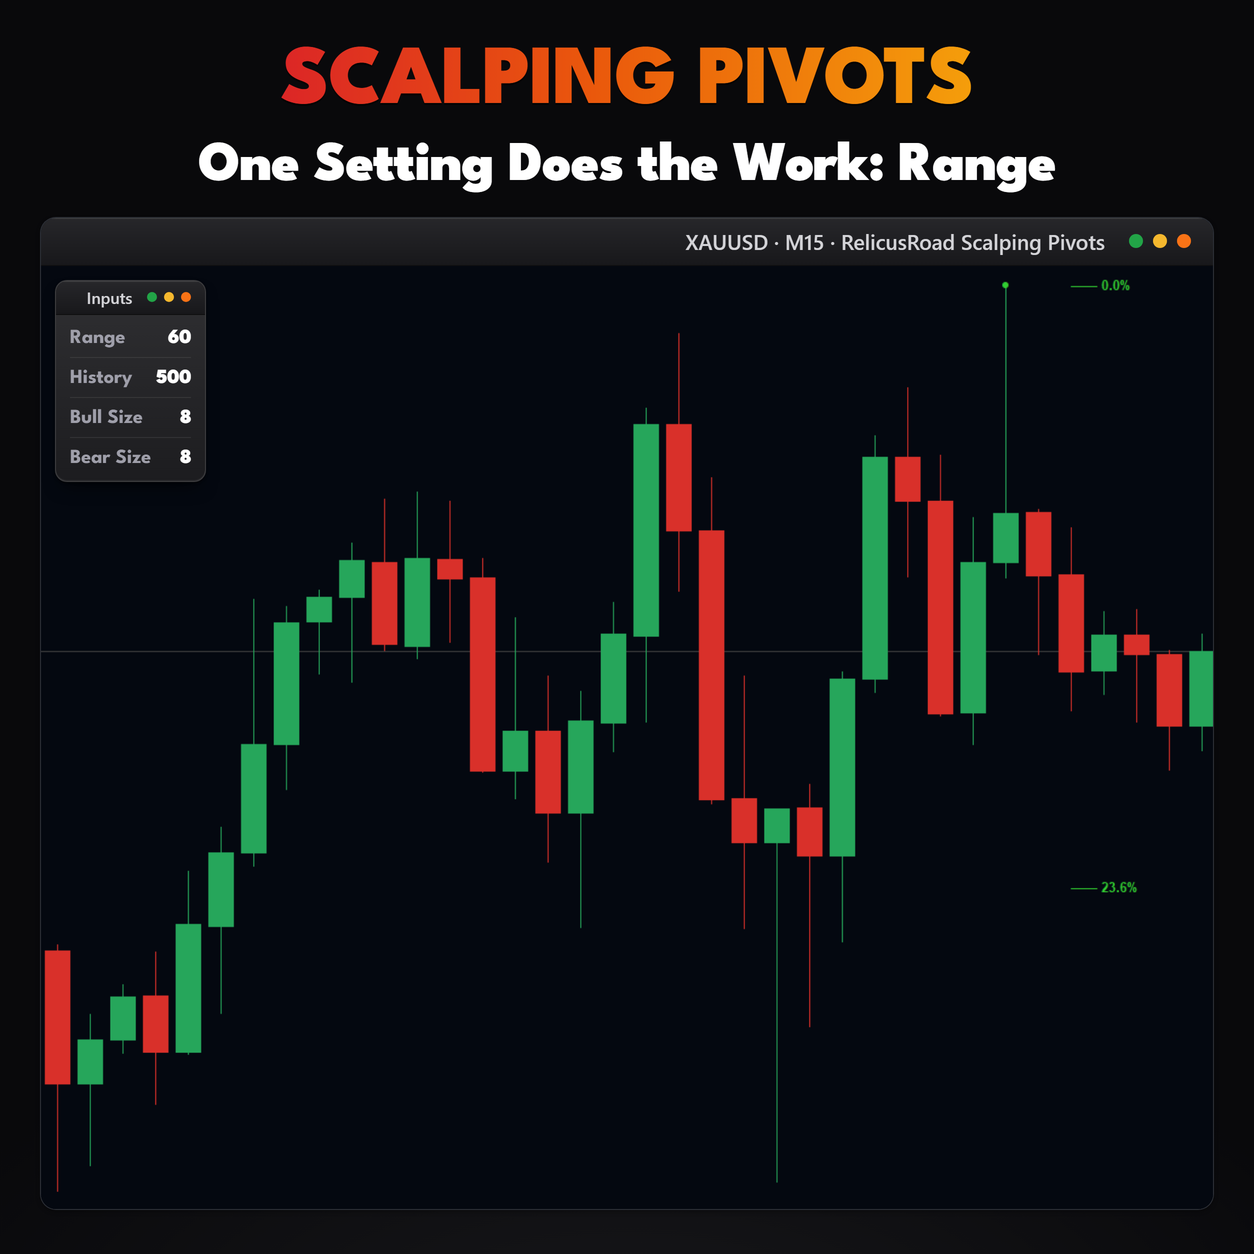
Swing detection. Range is the lookback length, 60 bars by default, and it is the one setting that changes what counts as a swing. Lower it for faster, smaller swings on M1 and M5, raise it for fewer and larger ones. History is how many recent bars are calculated, 500 by default. Keep Range well below History. When Range is too large for the bars available, the indicator shortens it in steps of 20.
What is shown. Show Bull covers the swing high dots and the lime ladder, Show Bear the swing low dots and the magenta ladder. Turn one off to work on a single side.
Appearance. Bull Color is lime green and Bear Color is magenta by default, each used for its dots and its ladder. Bull Size and Bear Size set the label text size, 8 by default, and Font Name sets one font for both ladders, Arial Bold by default. The dots have a fixed size, so the Size inputs change only the text.
What It Does Not Do
Worth knowing before you buy:
- It does not confirm swings. Dots appear immediately and can move while a leg extends.
- It does not draw classic daily pivots. For session based levels see RelicusRoad Daily Pivots.
- It does not send alerts. The Show Alerts input exists, but nothing is delivered in this build.
- It does not keep older ladders. One per side, each on its newest swing.
- It does not draw horizontal lines. The ladder is text beside the swing.
- It does not let you edit the Fibonacci ratios, which are fixed.
- It does not run on monthly charts.
Setup In Three Steps
- Buy it on the MQL5 Market and install it from the Market tab of your terminal.
- Drag RelicusRoad Scalping Pivots from Navigator, Indicators, Market onto the chart you scalp, M1 to M15 for short legs.
- Set Range for the swing size you care about, and leave History comfortably above it.
It runs on forex, gold and indices, and on higher timeframes when you want slower legs. Give the chart
a few hundred bars of history so the lookback has room to work.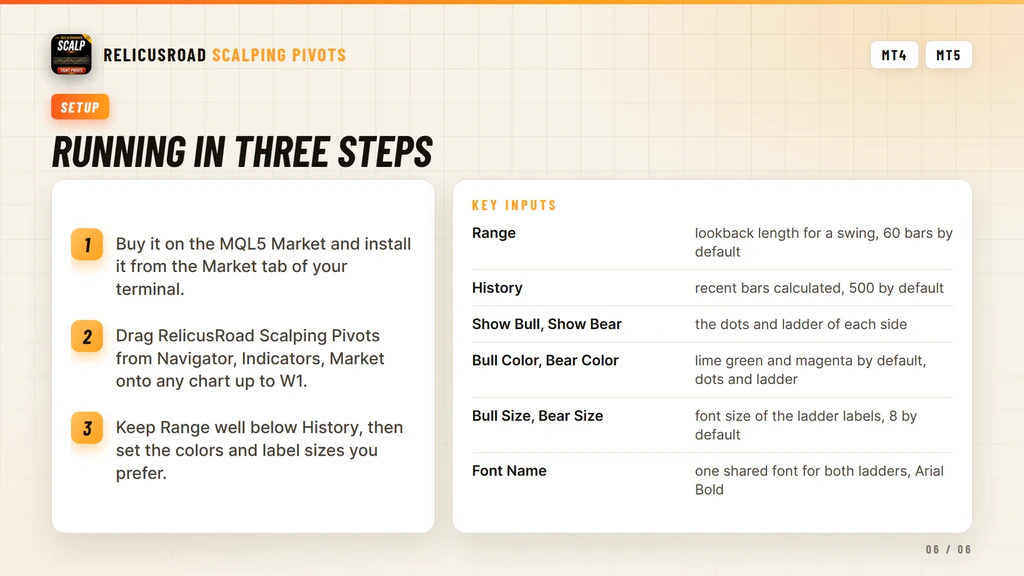
Where It Comes From
Scalp pivot detection is the short-term swing and Fibonacci tool inside RelicusRoad Pro, released on its own for traders who work one timeframe at a time. It runs standalone and needs no other RelicusRoad product.
Support runs through the product comments and the mql5.com messaging system.
Frequently Asked Questions
Everything you need to know about RelicusRoad Scalping Pivots. Still curious? Reach out anytime.
Learn How to Trade It
Every indicator ships with reference documentation and a matching strategy guide. You can also read what other traders say or start with the setup guide.
Indicator Reference
- Road Levels Dynamic S/R levels around a moving center line
- Support & Resistance Advanced S/R zones with alerts
- Action Levels Critical price levels for major moves
- Signal Lines Trend bias filter with two independent lines
- Daily High/Low/Open Daily extremes for range trading
- Daily Pivots Pro pivot points S1-S3, R1-R3
Trading Strategies
- Strategy #1: Price Action (Road) + SR + Trendlines + 2 TFs
- Strategy #2: Local Trendline + Price Position on Road + 2 TFs
- Strategy #3: Arrows + Price Action (Road) + SR
- Strategy #4: MicroScalping + Multiple Pairs + Daily Target 2-10%
Trading Guides
- Non-Repaint Forex Indicators: What 'Non-Repaint' Actually Means (and How to Verify It)
- Prop Firm Challenges: The 'Slow Boring' Strategy to Getting Funded
- Market Sessions Trading: How to Time the 'London-NY Overlap'
- What Is Forex Trading and How Does It Work?
- The Real Cost of Trading Platforms in 2026: A Broker-Neutral Teardown
- Position Sizing: The Boring Math That Keeps Traders Alive
- Forex Trading Psychology: 7 Traps and Process Fixes
Related tools
Standalone MetaTrader indicators related to this one.



