
What It Does
Signal Line draws two moving averages in the price window and recolors them bar by bar. The line tells you where the average is. The color tells you what a filter you chose thinks about that bar.
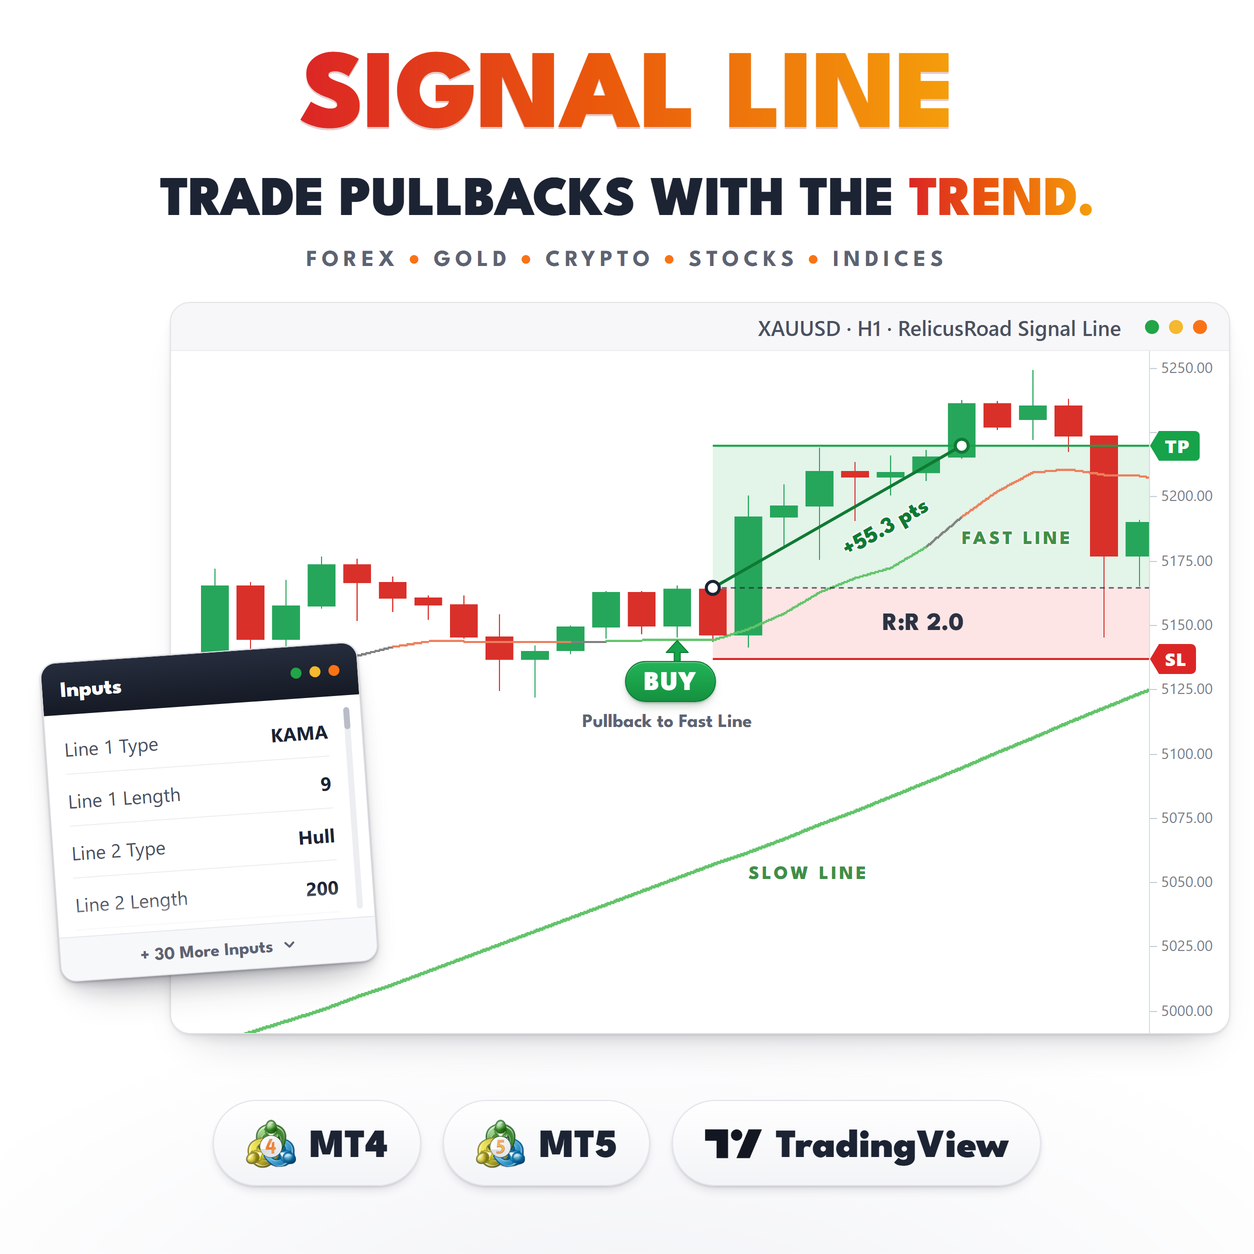
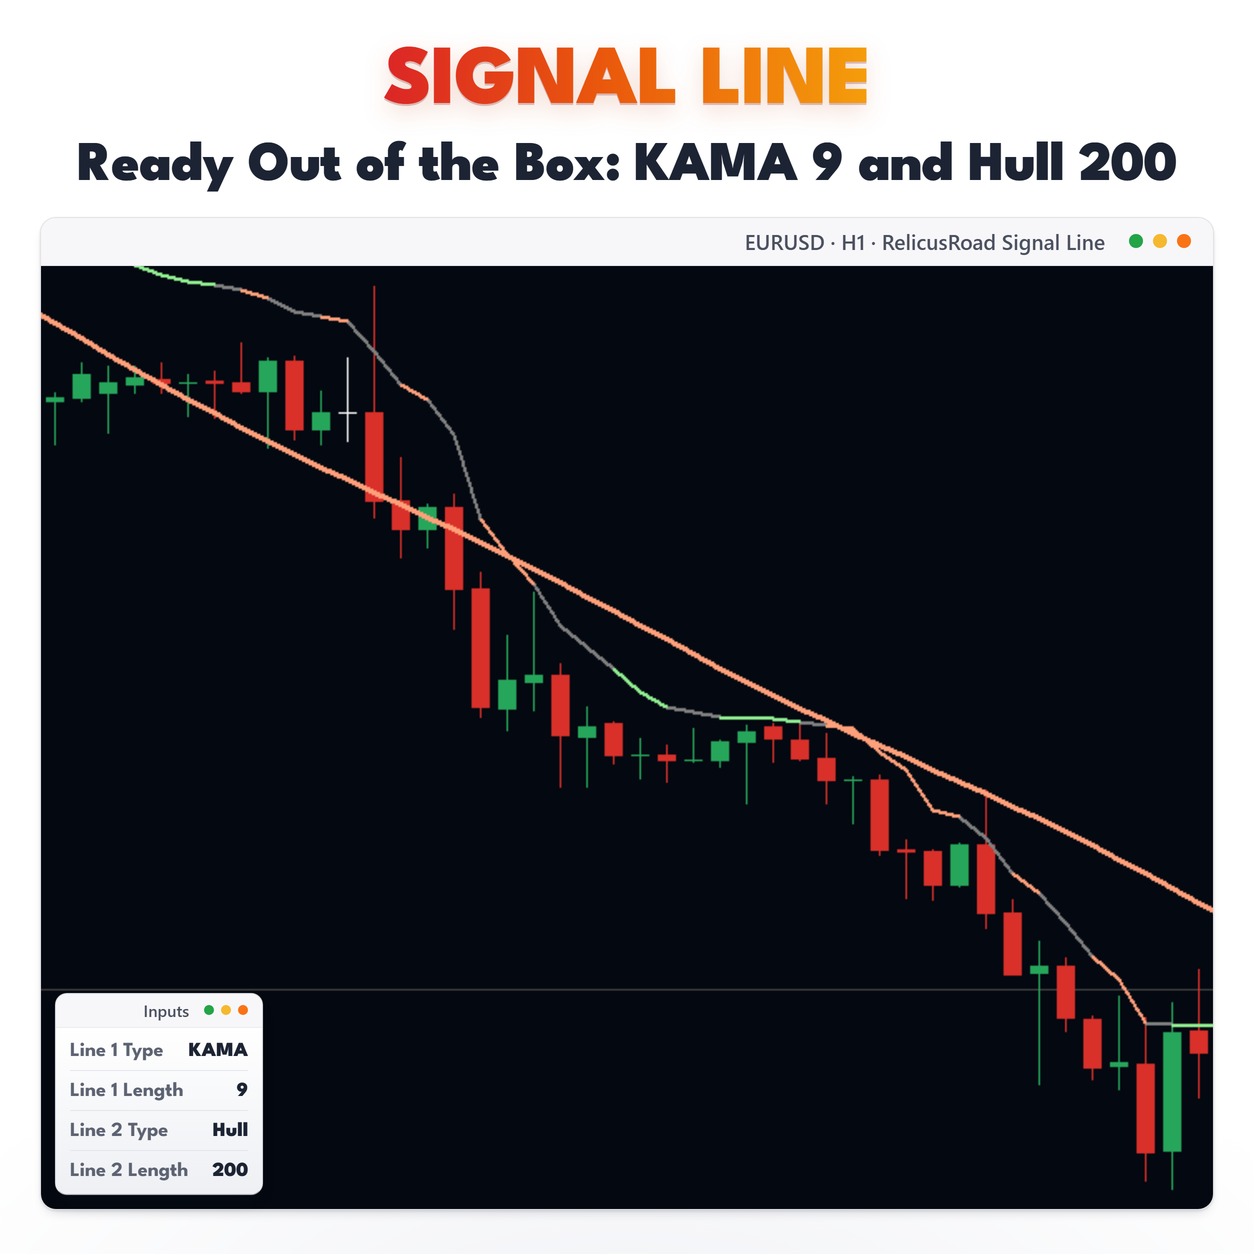
Out of the box, Line 1 is a fast adaptive average, KAMA over 9 bars, colored by a 5-period momentum reading. Line 2 is a slow Hull moving average over 200 bars, colored by an Ichimoku reading. One line tracks the short swing, the other describes the wider regime, and each carries its own opinion in its color.
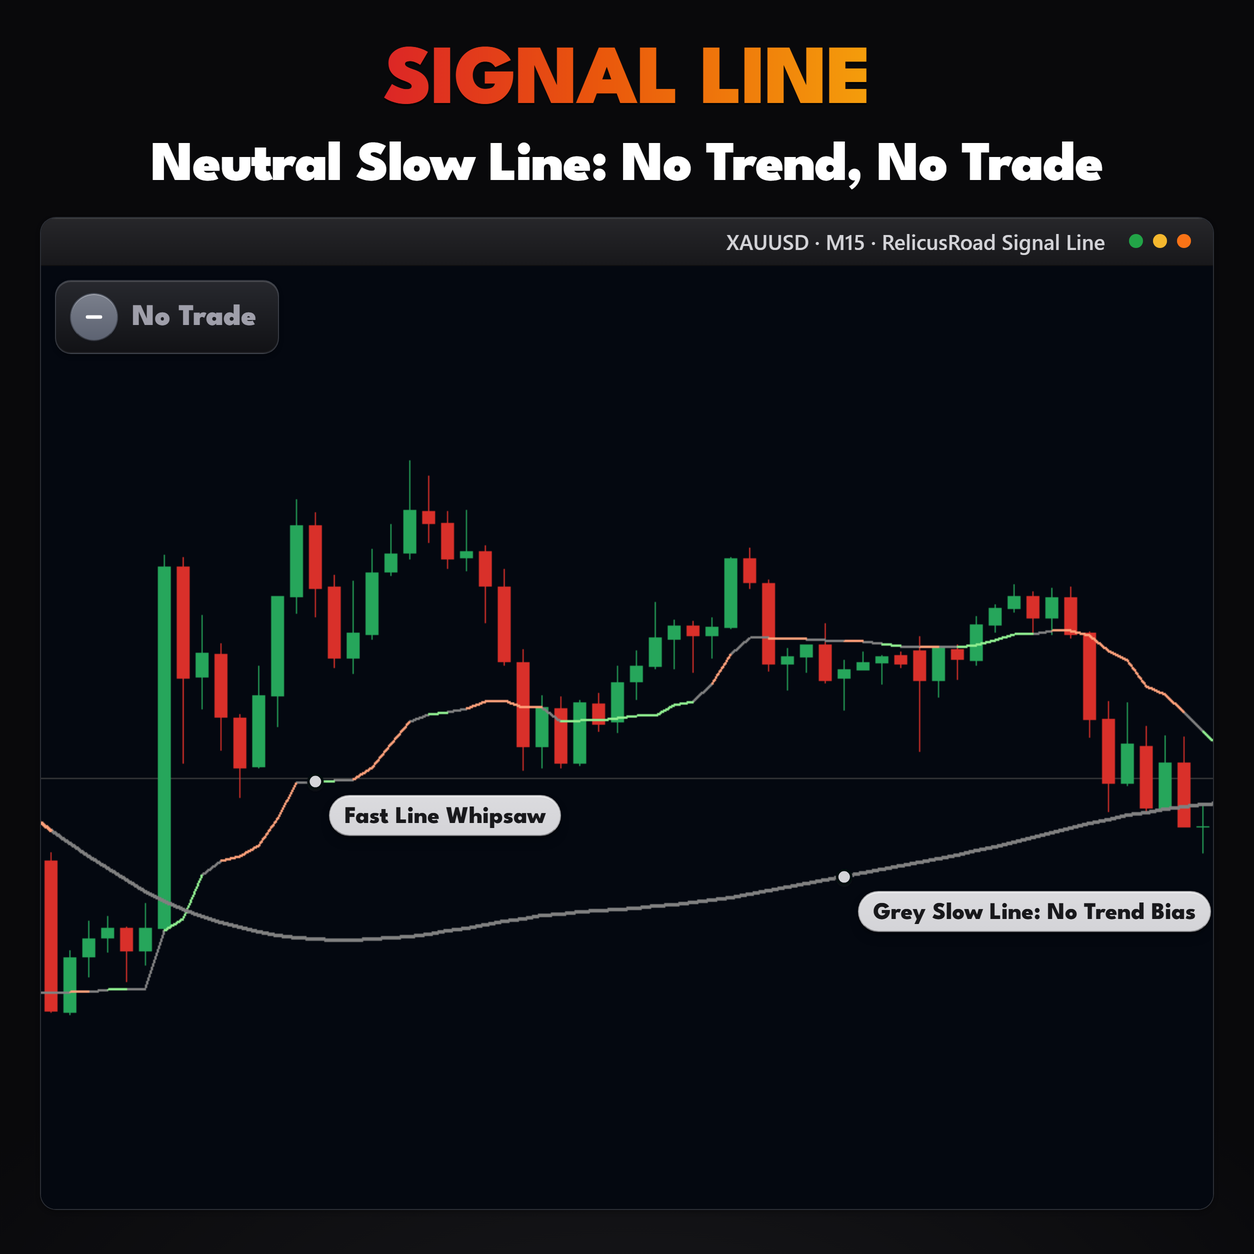
Green means the filter reads up. Salmon means down. Grey means the filter had nothing to say on that
bar, and grey is a real answer, not a gap.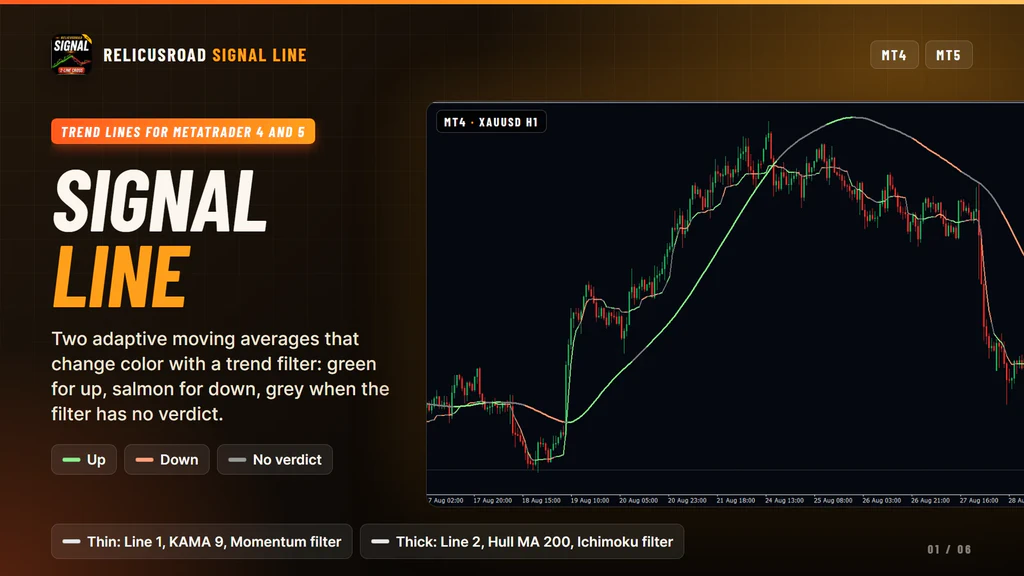
How It Works
Each line is built in two passes.
First the average. Closing prices go into the type and length you set, and the result is drawn as a grey line across every calculated bar. Eight types are available: SMA, EMA, smoothed, linear weighted, KAMA, VIDYA, FRAMA and Hull.
Then the color. For each bar the filter you picked returns up, down or nothing. On up bars a green segment is drawn over the grey line, on down bars a salmon one. Where the filter is undecided the grey underneath stays visible.
The two lines are independent. Different average, different length, different filter, different
colors if you want them.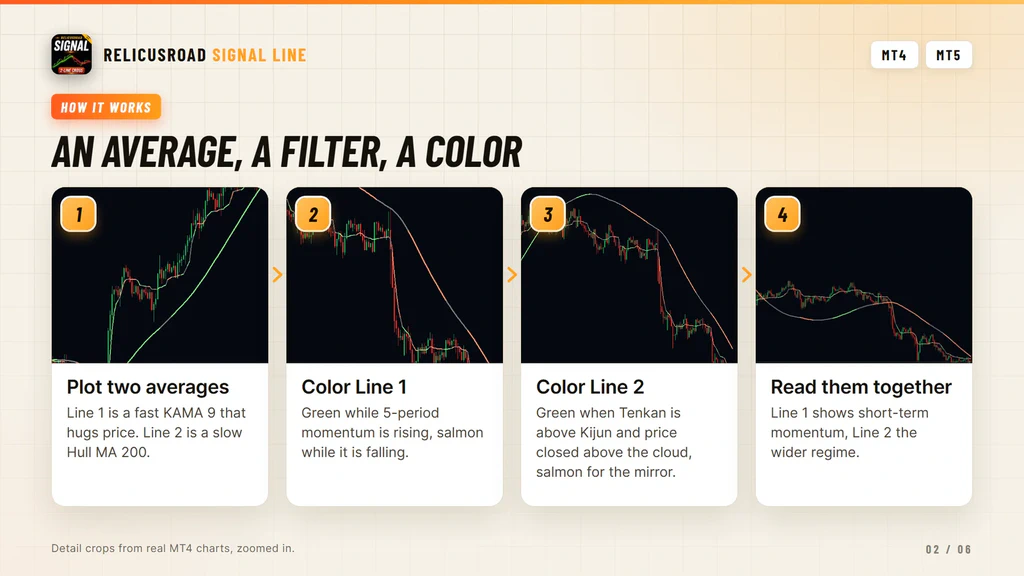
Color Is The Filter, Not The Price Side
This is the part most traders get wrong on day one. A colored moving average usually means “price is above the line, so the line is green”. That is one option here, and it is not the default.
Momentum, Ichimoku, MACD and Parabolic SAR judge the bar on their own terms. A green segment with price trading below it is normal. Momentum can still be rising while this bar dips under the average. If you want the familiar behaviour, set the filter to Moving Average and the color follows which side of the line the bar opened on.
The second thing worth knowing is the timing. Both lines recalculate when a new bar opens, not on
every tick, so a segment does not flicker while a bar is forming. Reloading the chart or switching
timeframe rebuilds the history from final closes, so a segment or two near the right edge can settle
into a different color after a refresh.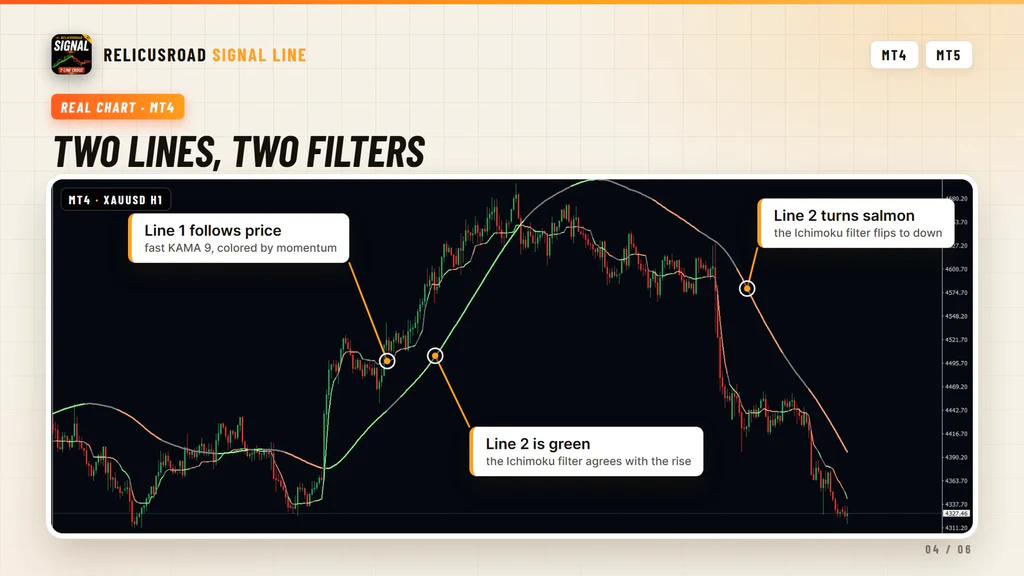
What You See On The Chart
| Element | Meaning |
|---|---|
| Thin line | Line 1, the fast average, width 2 by default |
| Thick line | Line 2, the slow average, always solid at width 3 |
| Green segment | The filter for that line read the bar as up |
| Salmon segment | The filter read the bar as down |
| Grey segment | No verdict, so the base line shows through |
- Thin line
- Line 1, the fast average, width 2 by default
- Thick line
- Line 2, the slow average, always solid at width 3
- Green segment
- The filter for that line read the bar as up
- Salmon segment
- The filter read the bar as down
- Grey segment
- No verdict, so the base line shows through
Nothing else is drawn. No arrows, no boxes, no labels, no panel, and no crossing markers.
You have six filters to choose from for each line: Momentum, Ichimoku, MACD, Parabolic SAR, Moving
Average and Reversal. Their internals are fixed, MACD at 12, 26 and 9, SAR at 0.02 and 0.2, Ichimoku
at 9, 26 and 52, momentum at 5 bars, so the choice you make is the filter itself rather than a page
of parameters.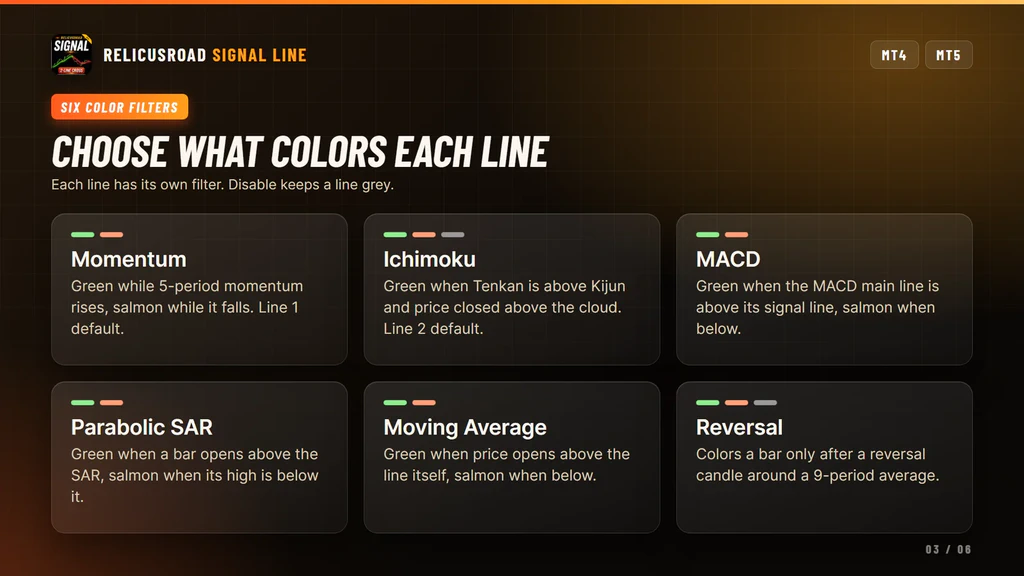
What It Does For Your Trading
Four things, each one you can check on the chart before you trust it.
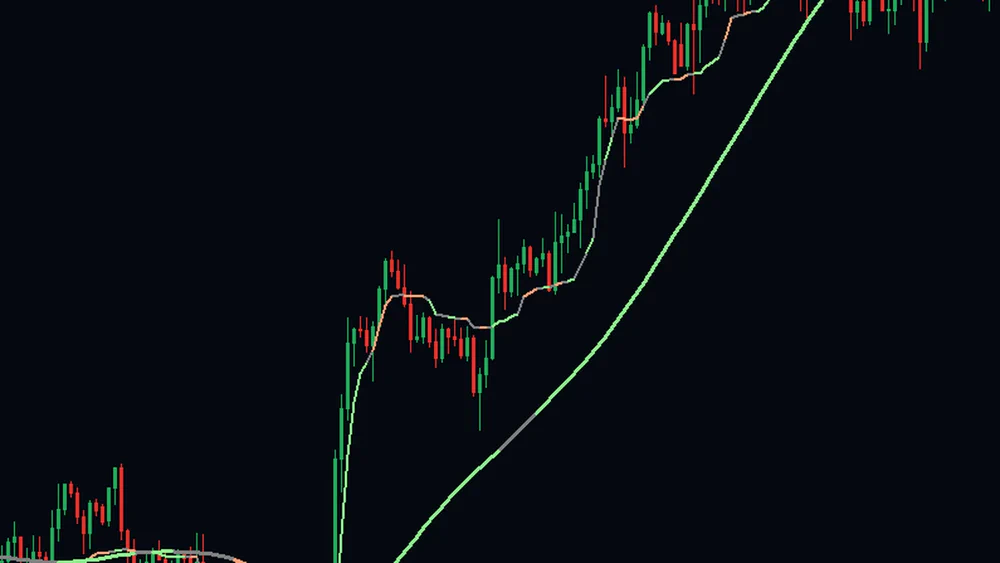
Two Speeds Of Trend, One Chart
The thin line is the fast average, close enough to price to follow every leg. The thick line is the slow one, far enough away to ignore them. Both are drawn in the price window, so you are reading one chart instead of two.
That pairing answers the question you ask on every entry. Is this push part of something bigger, or is it the whole move.
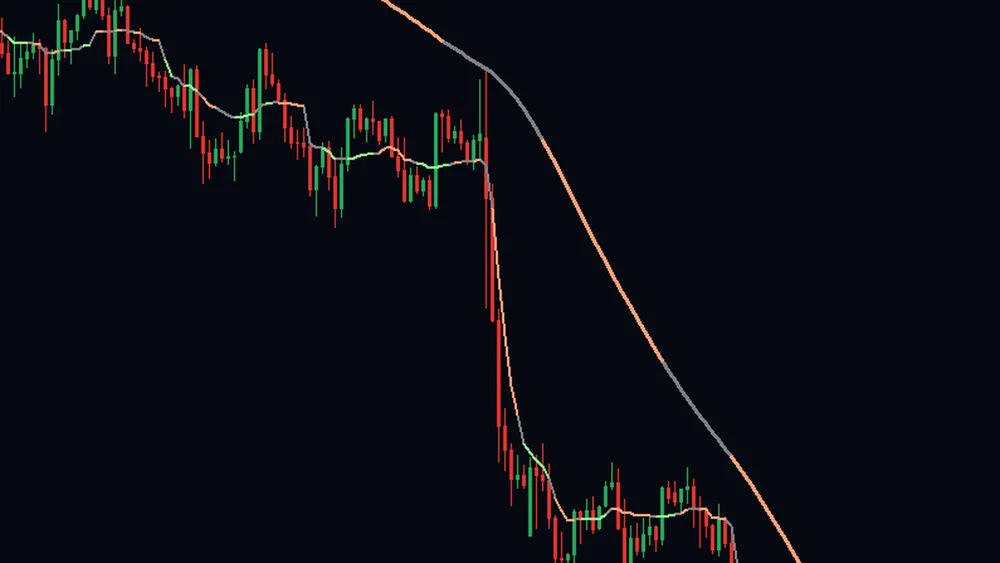
Shows When Momentum Turns First
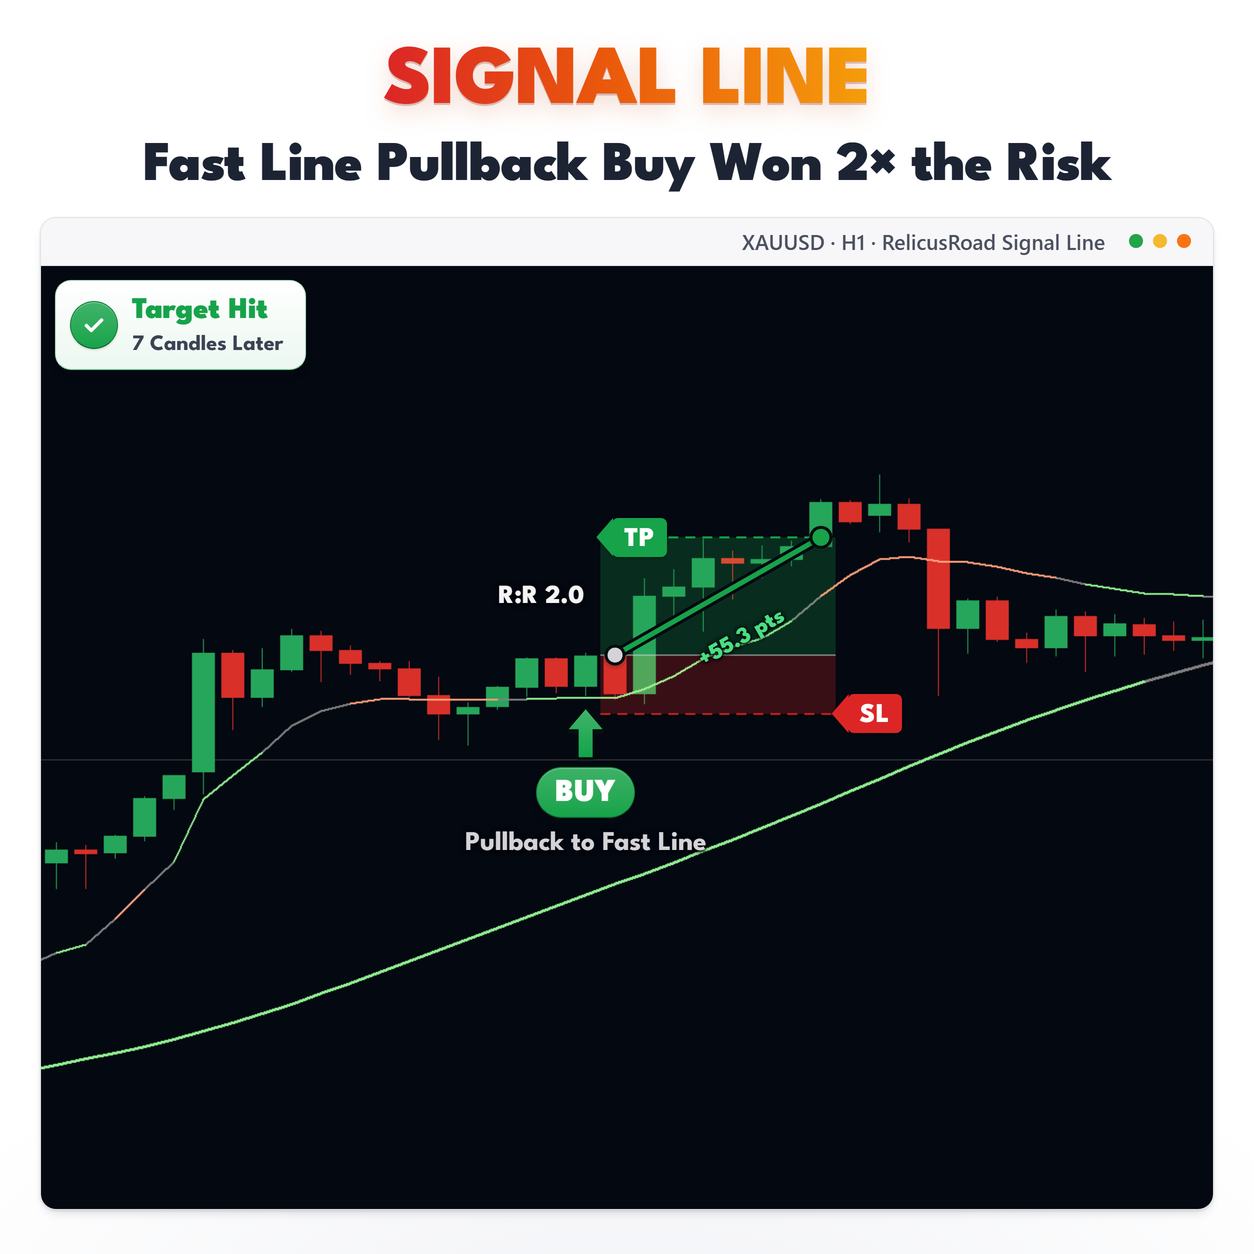
The fast line recolors bar by bar from its filter. With the default momentum setting it runs green while momentum is rising and salmon while it is falling, so a bounce inside a fall shows up as a run of green on a line that is still under a salmon slow line.
That is the moment to decide whether you are taking the bounce or waiting for it to fail, and the chart has already separated the two for you.
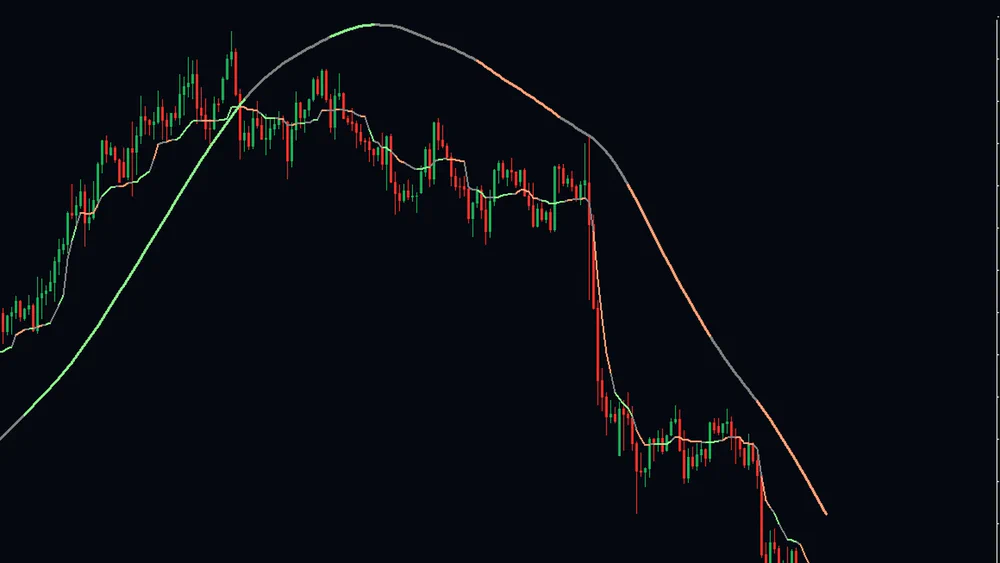
Marks Where The Regime Changes
The slow line carries its own filter, Ichimoku by default. Through the top in this crop it runs green into the high, greys out across it and turns salmon down the far side, all without you switching timeframe or adding a second window.
When that color changes, the context your trade was built on has changed. It is a cue to tighten, stand aside or turn the book around, rather than a signal to reverse on the spot.
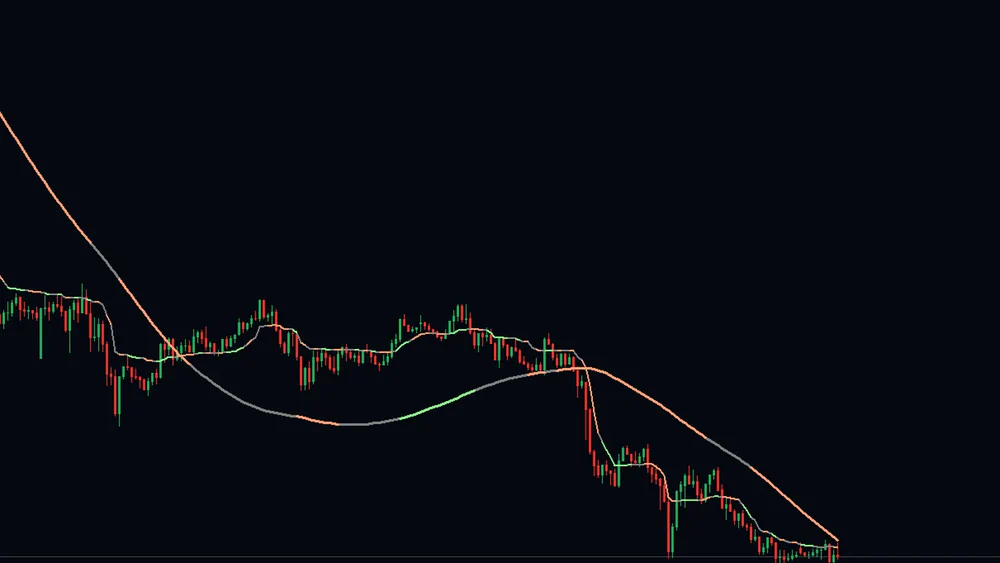
Says So When It Has No Verdict
Grey is not a gap in the drawing. It means the filter found neither an up nor a down reading on that bar, and the base line shows through. Ichimoku and Reversal both spend real time there, because they need several conditions to line up.
Most colored averages have to pick a side on every bar, which is how traders end up acting on a color that was never more than a coin flip. This one leaves the grey in, and the lines only move when a bar closes, so what you saw at the close is what stays.
Reading It On A Live Chart
Read the slow line first. While Line 2 holds one color, the wider regime has not changed, and pullbacks inside it are pullbacks. When Line 2 turns grey, the Ichimoku conditions have stopped agreeing, which is often the first sign that a move is losing its context.
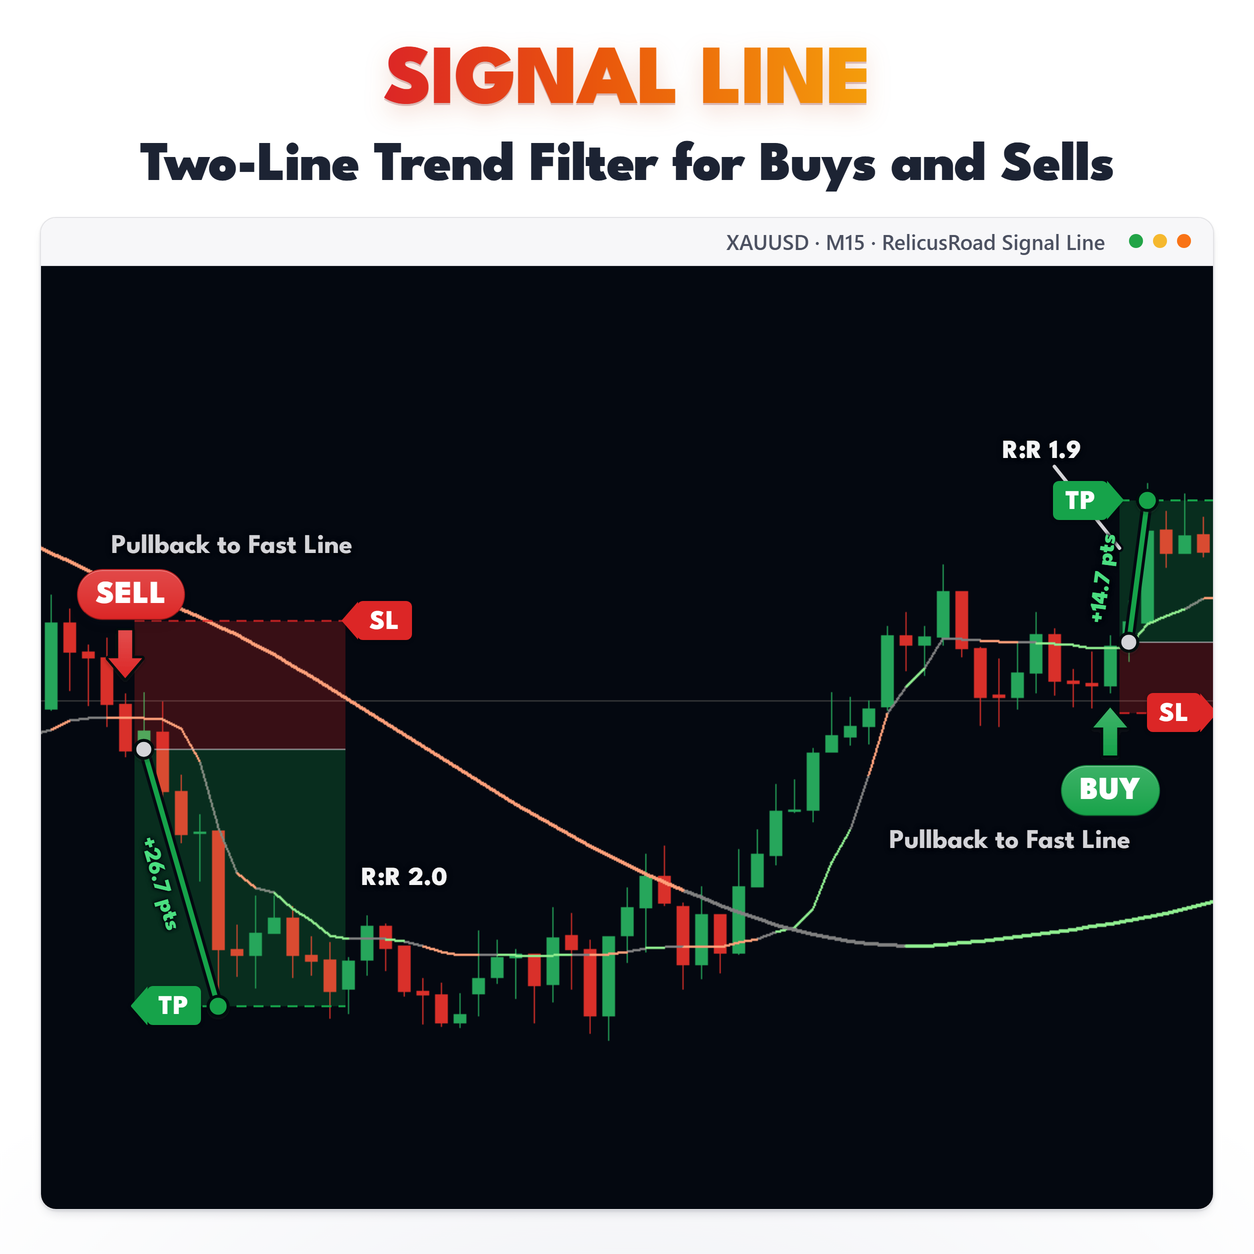
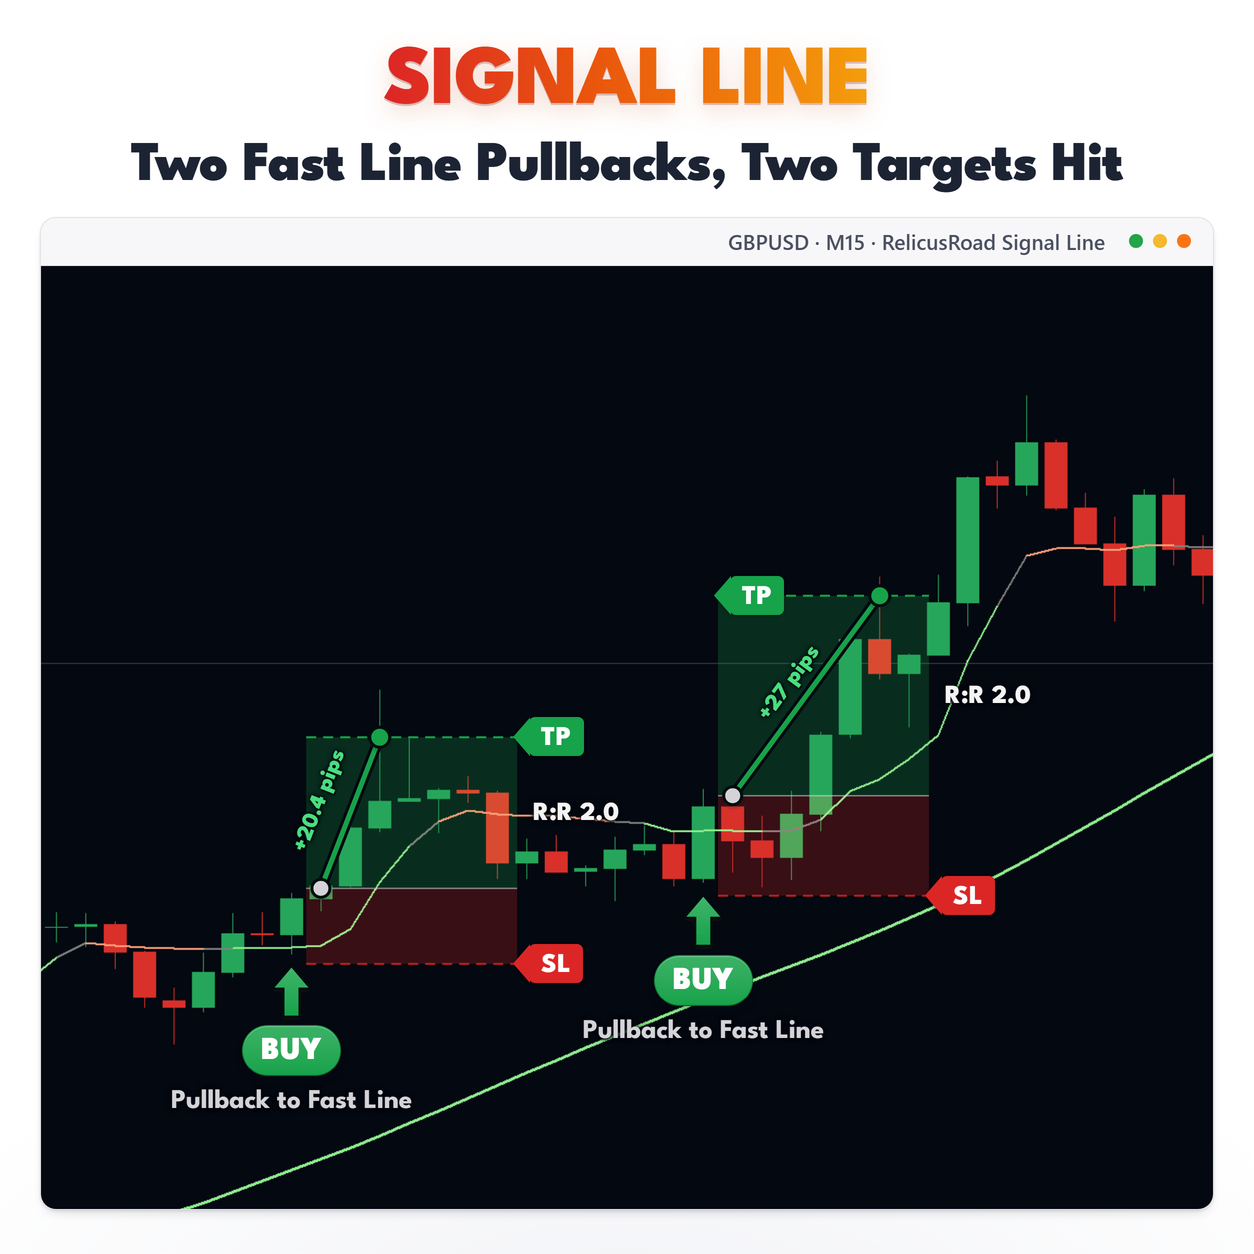
Line 1 is the working line. Its color changes far more often, and its job is to tell you whether the short swing is pushing with the regime or against it. Both lines the same color is the simple case. Fast green against slow salmon is a counter-trend bounce, and you can treat it as one.
The line itself still matters. Price returning to a slow average that has kept its color is the setup
plenty of traders build on, and having the color there saves you from adding a second indicator to
confirm it.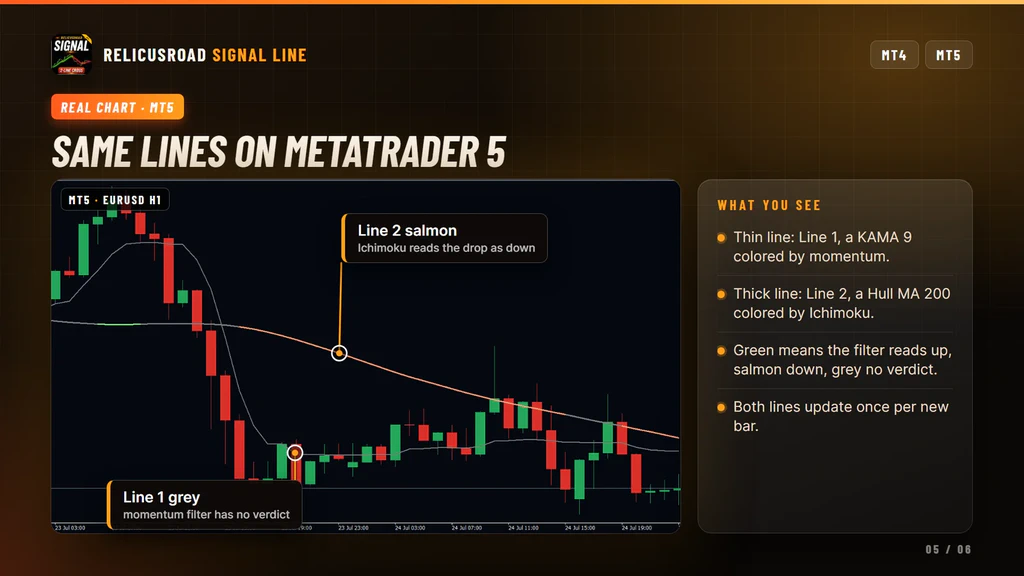
Settings You Can Change
Which lines run: Show Signal Line 1 and Show Signal Line 2. Turn either off and it stops being calculated.
Per line: the average type, one of eight; the length, 9 for Line 1 and 200 for Line 2 by default; the color filter, one of six; and the number of bars calculated, 3000 by default and capped at 5000.
Appearance: the up, neutral and down colors for each line, plus style and width for Line 1. Line 2 is always drawn solid at width 3, so its style and width inputs have no effect.
Timeframes: each line has an average timeframe and a filter timeframe. Both default to the chart timeframe, and leaving them there is the safe choice, for the reason in the next section.
What It Does Not Do
Worth knowing before you install:
- It does not detect crossovers. The two lines exchanging places is not tested, measured or marked.
- It does not send alerts in this build. The toggles exist, but nothing is delivered.
- It does not align other timeframes properly. The higher-timeframe inputs read by bar position, not by time, so the values do not line up with your chart bars.
- It does not support the Trend entry in the filter list. That one needs the Signal Cloud data from the full system, so use the other six and see Signal Cloud if the cloud is what you are after.
- It does not update inside a bar, and it does not tell you where to enter or exit.
Setup In Three Steps
- Buy it on the MQL5 Market and install it from the Market tab of your terminal.
- Drag RelicusRoad Signal Line from Navigator, Indicators, Market onto a chart.
- Pick each line’s average, length and filter in the inputs, and leave both timeframe inputs on the chart timeframe.
It runs on forex, gold, indices, stocks and crypto, on any chart timeframe. The defaults are a
starting pair rather than a system, so change the length of the slow line first and see how the color
behaves on the instrument you trade.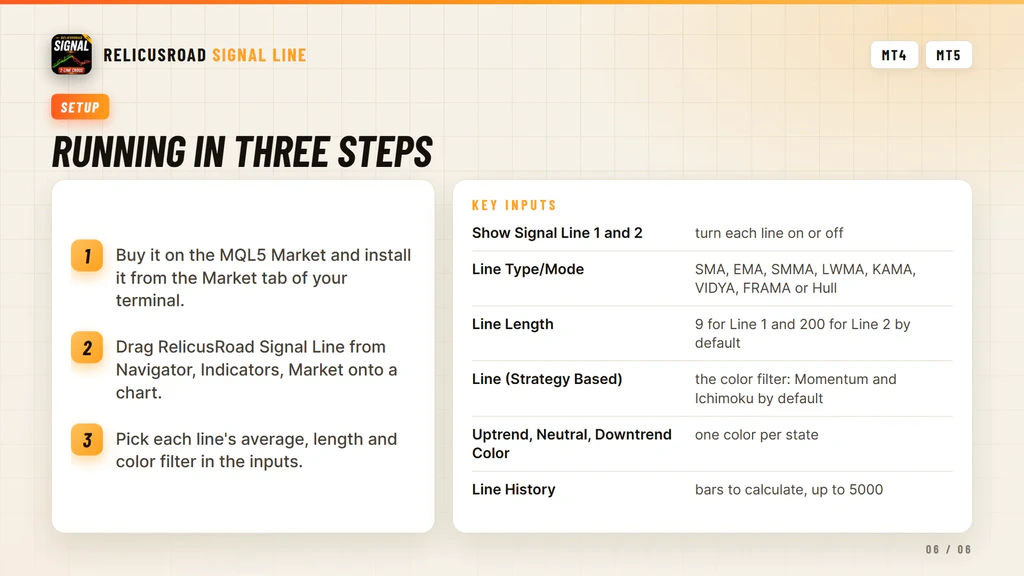
Where It Comes From
The colored line layer sits underneath the trend reading in RelicusRoad Pro. This is that layer on its own, for traders who want a moving average with an opinion and nothing else on the chart. It runs standalone and needs no other RelicusRoad product. If you want a trend read that flips at a level instead of coloring an average, look at SuperTrend, and for the same idea across nine timeframes in one panel there is Multi Timeframe Trendbar.
Support runs through the product comments and the mql5.com messaging system.
Frequently Asked Questions
Everything you need to know about RelicusRoad Signal Line. Still curious? Reach out anytime.
Learn How to Trade It
Every indicator ships with reference documentation and a matching strategy guide. You can also read what other traders say or start with the setup guide.
Indicator Reference
- Road Levels Dynamic S/R levels around a moving center line
- Support & Resistance Advanced S/R zones with alerts
- Action Levels Critical price levels for major moves
- Signal Lines Trend bias filter with two independent lines
- Daily High/Low/Open Daily extremes for range trading
- Daily Pivots Pro pivot points S1-S3, R1-R3
Trading Strategies
- Strategy #1: Price Action (Road) + SR + Trendlines + 2 TFs
- Strategy #2: Local Trendline + Price Position on Road + 2 TFs
- Strategy #3: Arrows + Price Action (Road) + SR
- Strategy #4: MicroScalping + Multiple Pairs + Daily Target 2-10%
Trading Guides
- Non-Repaint Forex Indicators: What 'Non-Repaint' Actually Means (and How to Verify It)
- Prop Firm Challenges: The 'Slow Boring' Strategy to Getting Funded
- Market Sessions Trading: How to Time the 'London-NY Overlap'
- What Is Forex Trading and How Does It Work?
- The Real Cost of Trading Platforms in 2026: A Broker-Neutral Teardown
- Position Sizing: The Boring Math That Keeps Traders Alive
- Forex Trading Psychology: 7 Traps and Process Fixes
Related tools
Single RelicusRoad indicators for MT4 and MT5, each one standalone.



