
What It Does
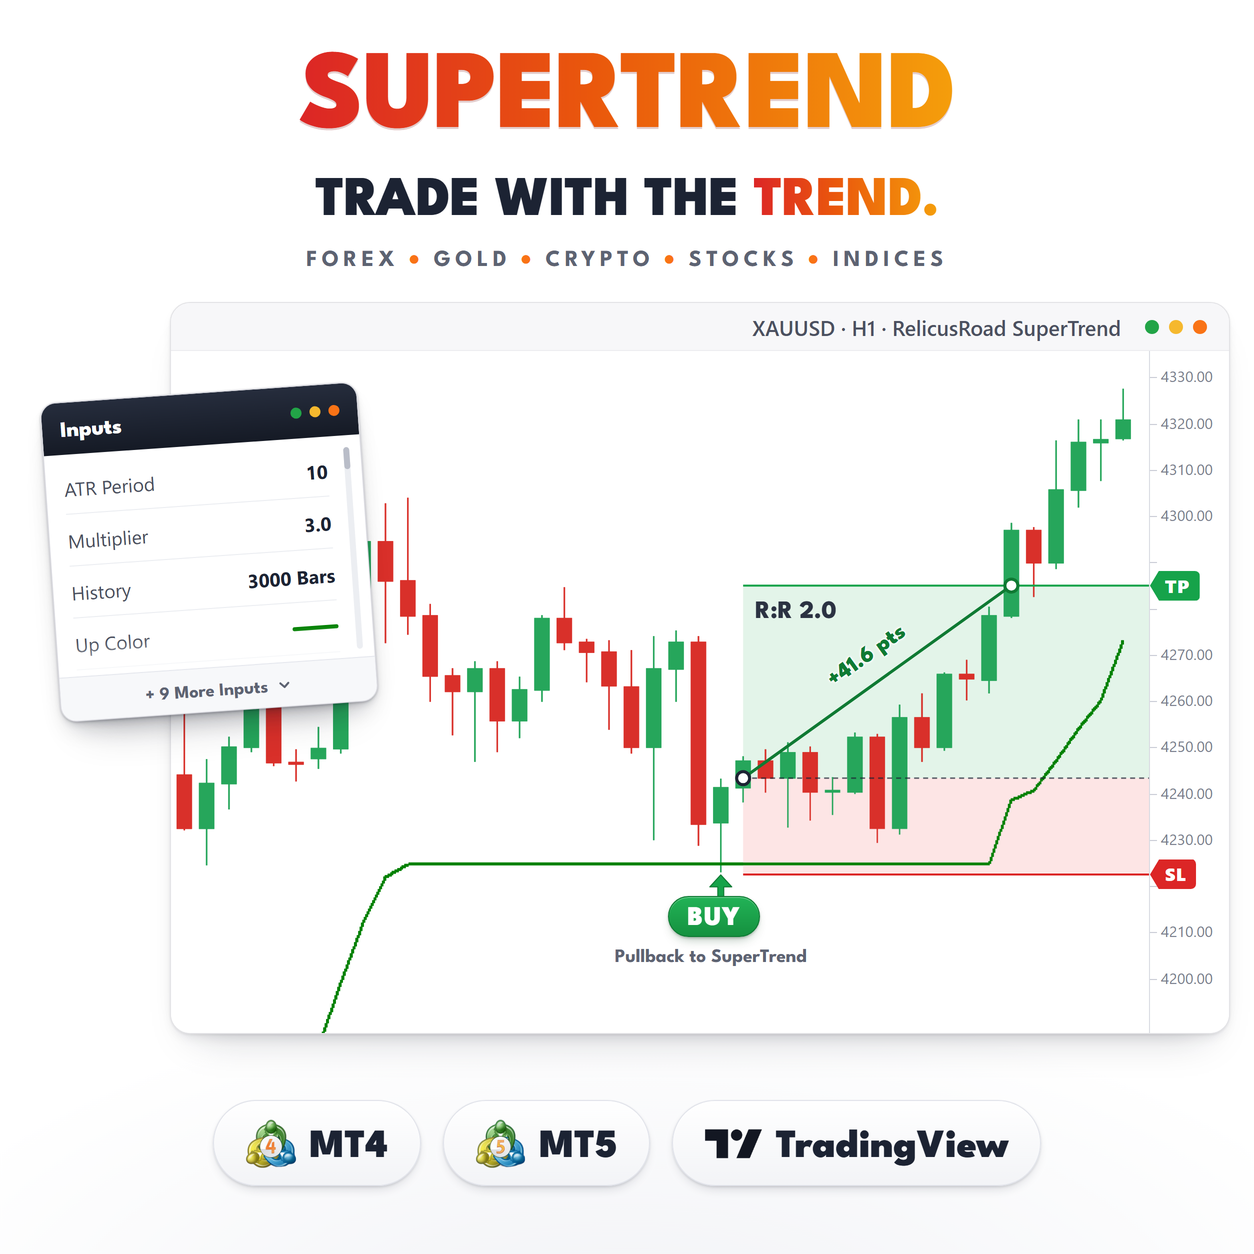
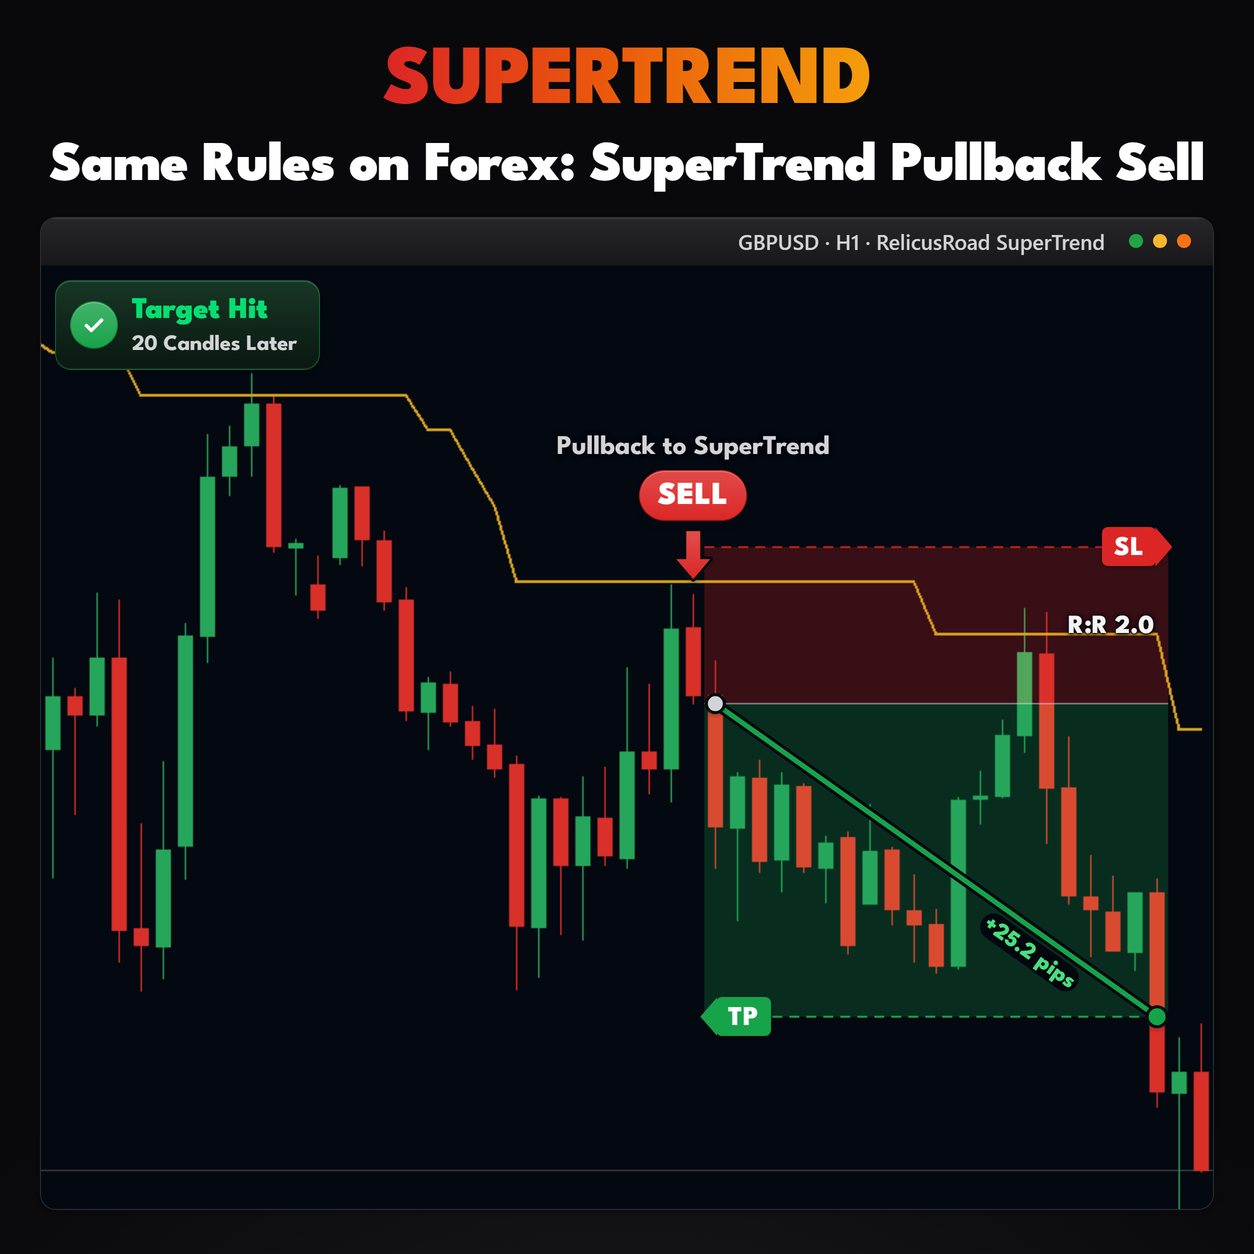
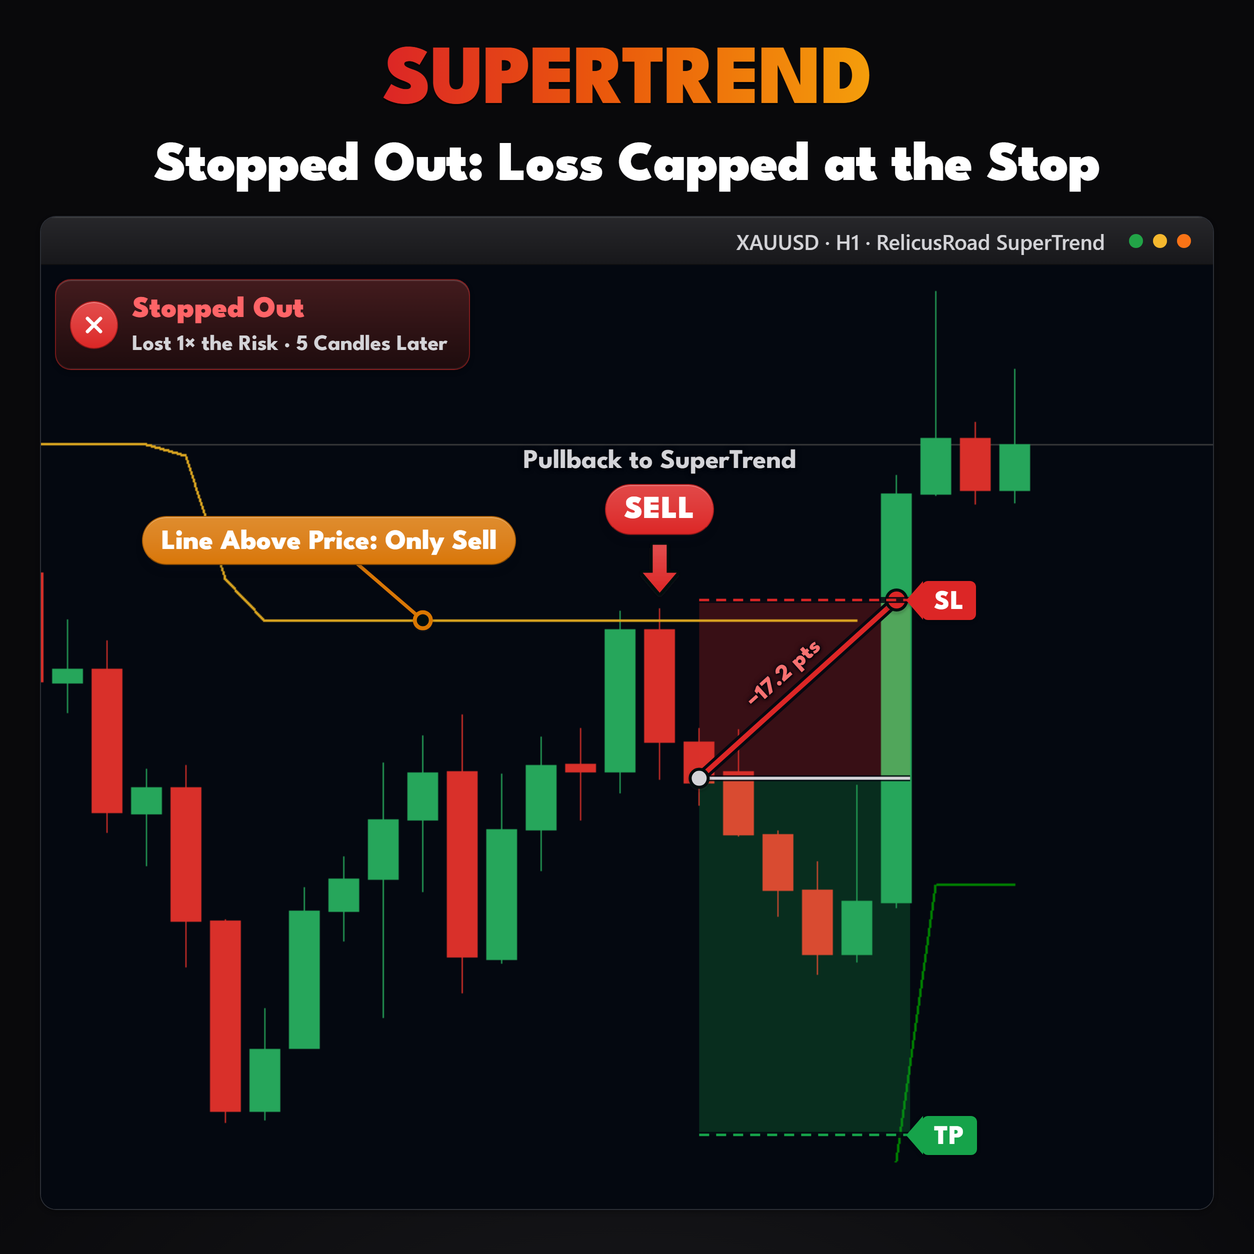
SuperTrend answers one question on every bar: is price on the up side or the down side of an ATR band. The answer is a single line. Green and under price means up. Goldenrod and above price means down. There is no third state.
This is the classic calculation with nothing layered on top. No arrows, no labels, no dashboard, no extra confirmation lines. If you already know SuperTrend from another platform, this behaves the way you expect it to.
What you get from that is a line you can trade around without thinking about it: a place to trail a
stop, a line to define the side you are allowed to take, or a filter for whatever setup you run.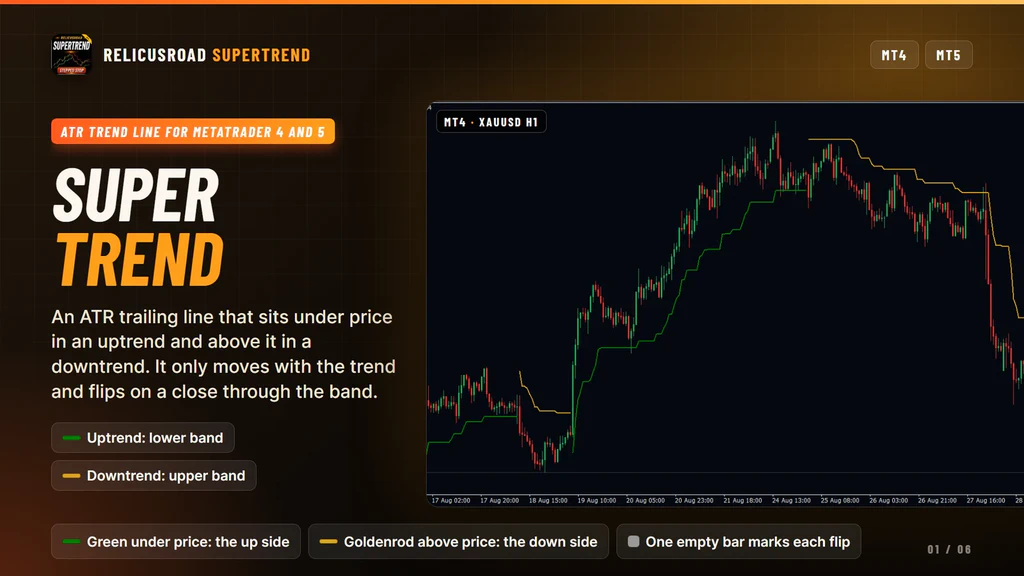
How It Works
Take the median price of a bar, the midpoint between its high and its low. Put a band a set number of Average True Range units above and below it. With the defaults that is ATR over 10 bars and a multiplier of 3.
The trend turns up when a bar closes above the previous bar’s upper band, and turns down when a bar closes below the previous bar’s lower band. Nothing else moves it.
Between flips the band ratchets. In an uptrend the lower band can rise but never fall, so the line
steps up behind price and holds. In a downtrend the upper band can fall but never rise. That one rule
is what turns a pair of bands into a trailing stop.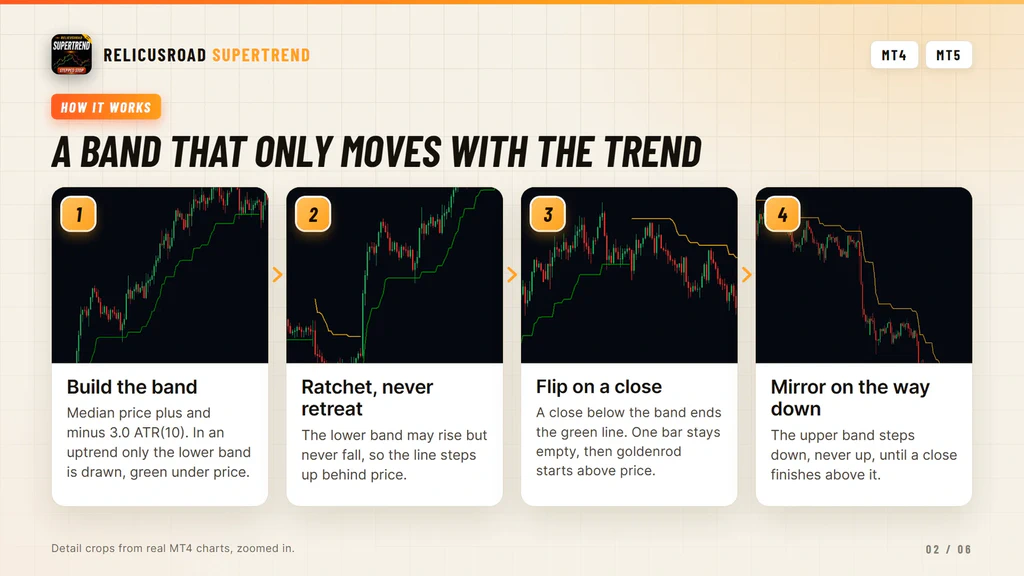
The Flip Is Decided Once Per Bar
Price can trade straight through the line during a bar and leave the trend unchanged. The test is a close against the previous bar’s band, and this build evaluates it when a new bar opens rather than tick by tick. A wick through the line means nothing here.
That is usually what you want, because it stops the line jumping around inside a bar. It also means the flip you see live was computed from the opening tick of the new bar. Reload the chart or switch timeframe and the history is rebuilt from final prices, so a recent flip can settle a bar earlier or later than you first saw it. Older bars, well behind the right edge, are stable.
When the flip happens the old line stops, one bar is left blank, and the new line appears on the other
side of price. That gap is the only marker you get, and it is enough to spot at a glance.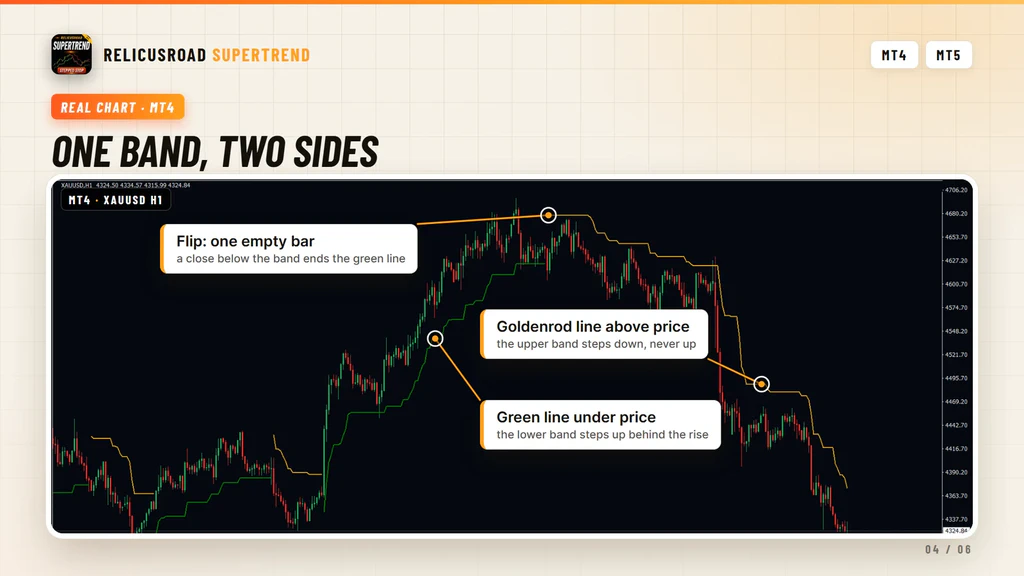
What You See On The Chart
| Element | Meaning |
|---|---|
| Green line under price | Uptrend, drawn from the lower band, width 2 by default |
| Goldenrod line above price | Downtrend, drawn from the upper band |
| One-bar gap | The flip, where the old line ends and the other begins |
| Stepped shape | The ratchet, holding level or moving with the trend, never against it |
| Empty older bars | Beyond the calculated history, 3000 bars by default |
- Green line under price
- Uptrend, drawn from the lower band, width 2 by default
- Goldenrod line above price
- Downtrend, drawn from the upper band
- One-bar gap
- The flip, where the old line ends and the other begins
- Stepped shape
- The ratchet, holding level or moving with the trend, never against it
- Empty older bars
- Beyond the calculated history, 3000 bars by default
Every calculated bar belongs to one side or the other. There is no neutral line and no strength grade,
which keeps the reading binary on purpose.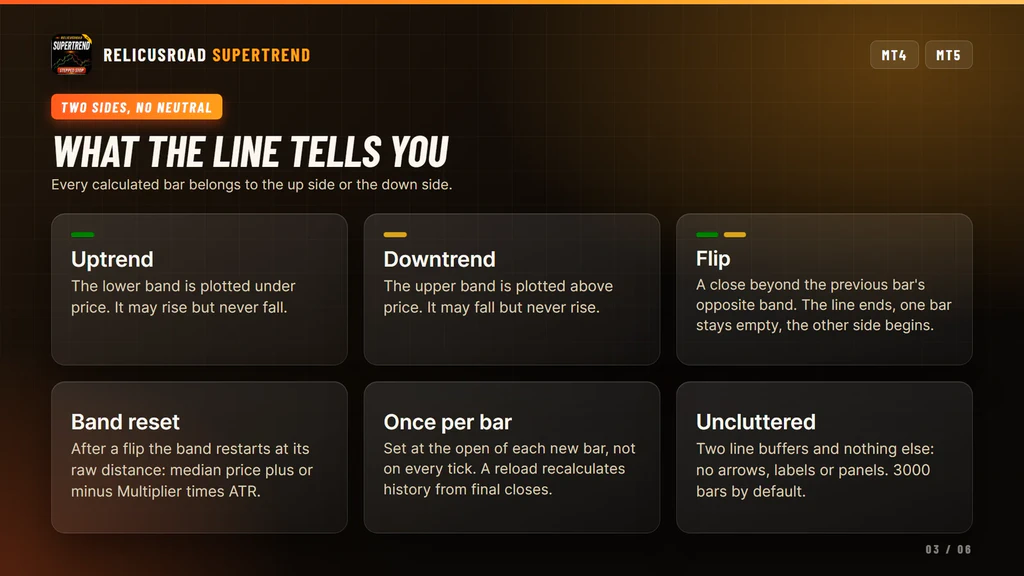
What It Does For Your Trading
Four things, each one you can check on the chart before you trust it.
Puts A Stop Level On Every Bar
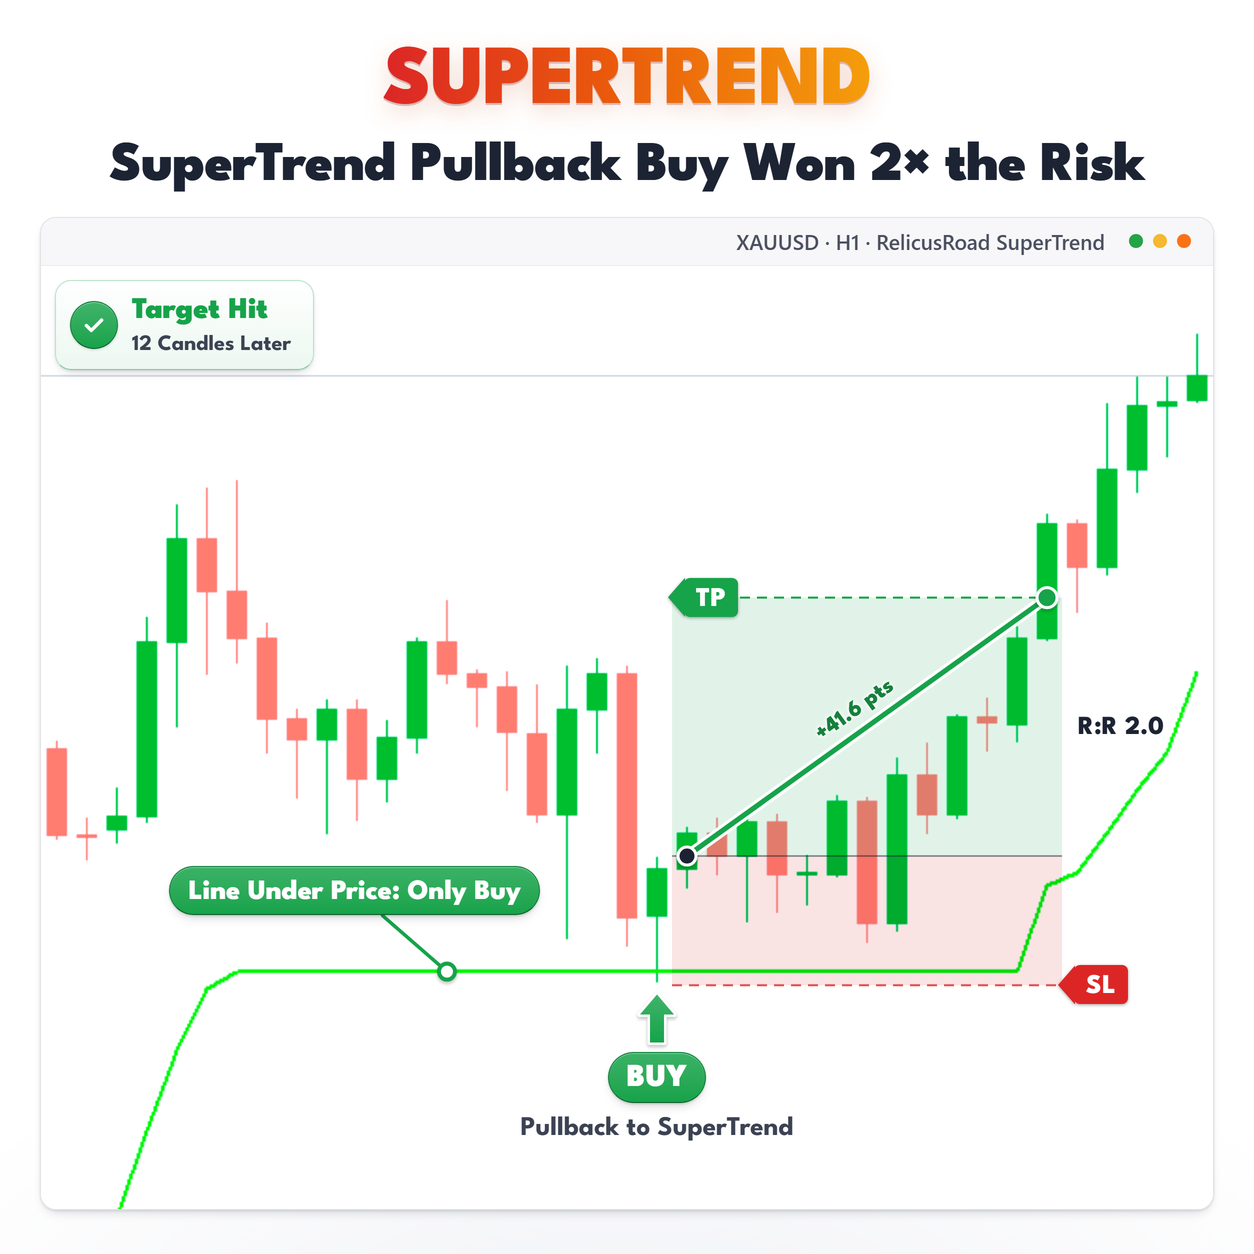
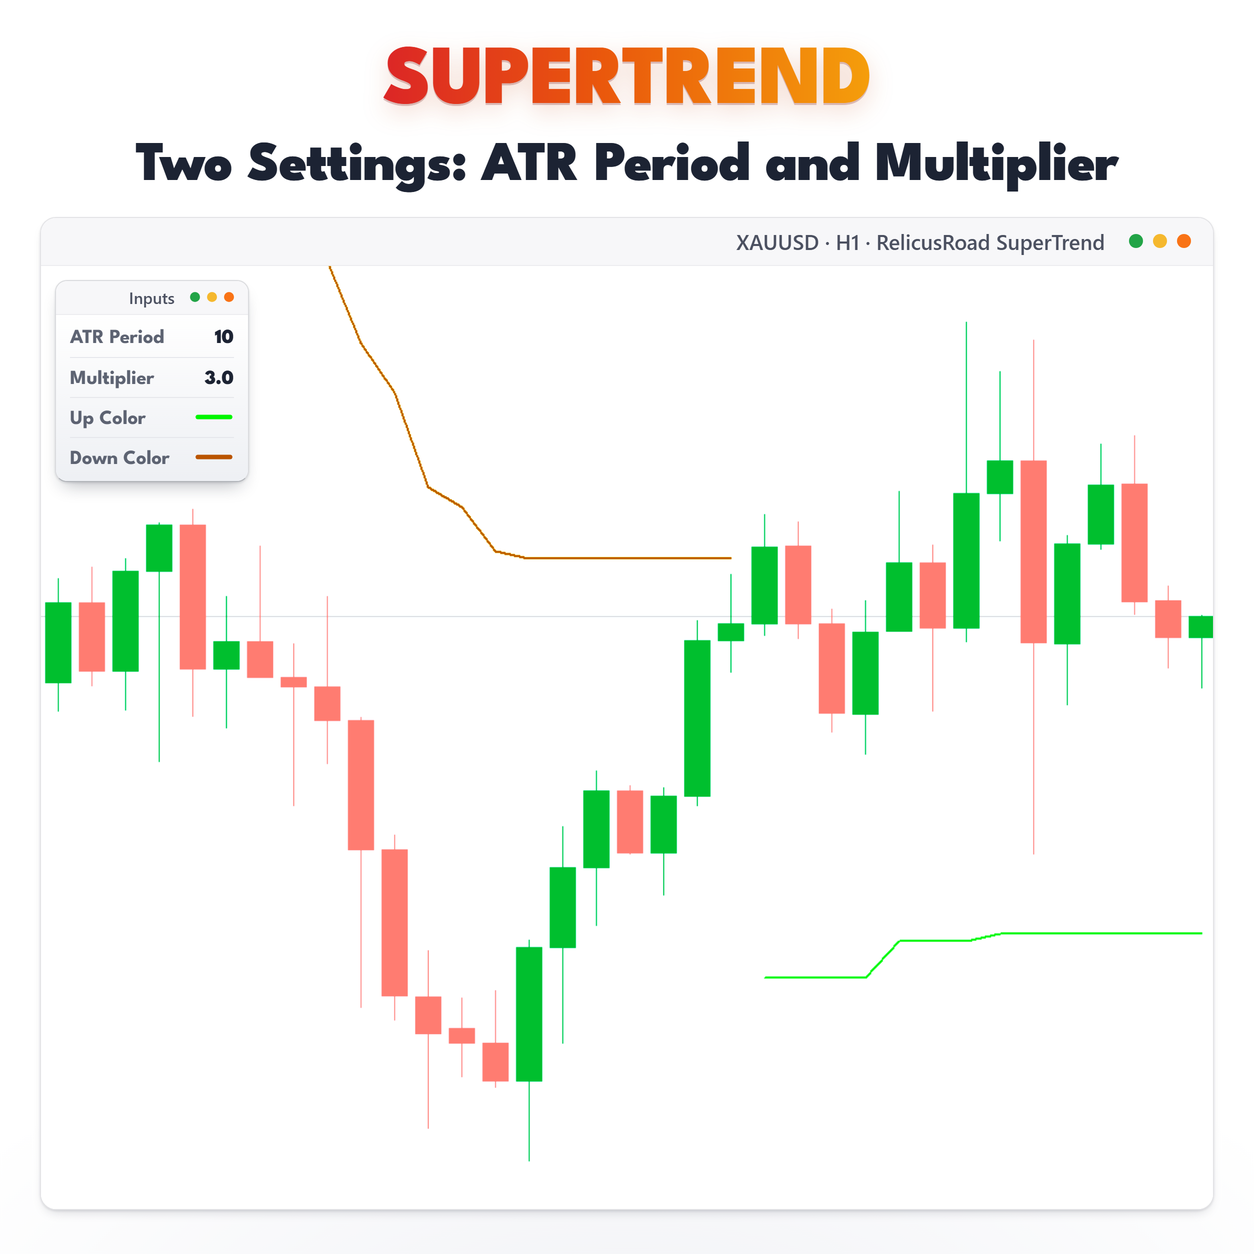
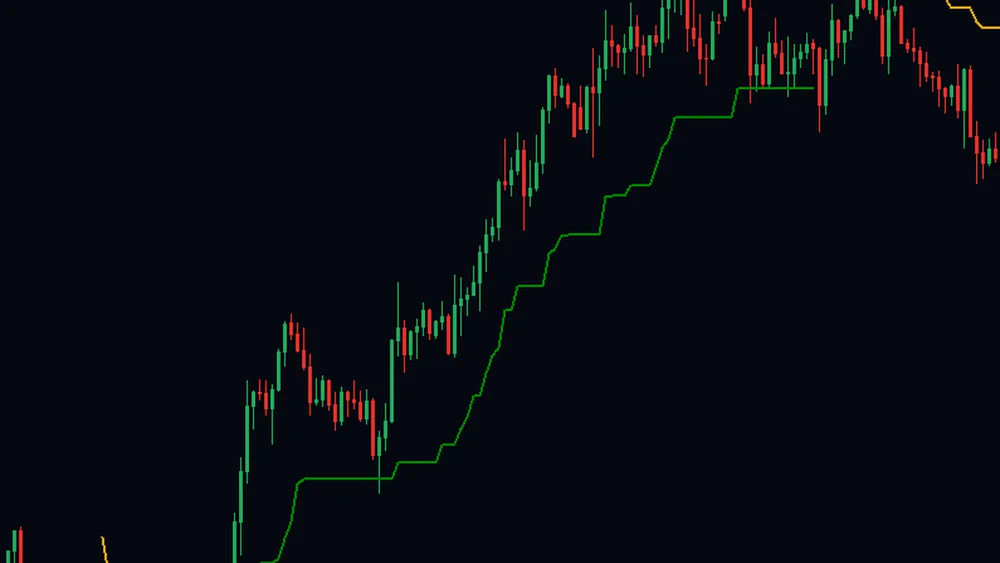
While the trend is up, the line sits under price at a distance set by ATR, so it is wide on a volatile symbol and tight on a quiet one without you changing a thing. In this crop it holds flat through the pullbacks and steps up after each push.
You stop asking where the stop goes. The line is already at a level the market has to break to prove you wrong, and it is the same rule on every symbol you open.
Steps Up Behind Price, Never Down
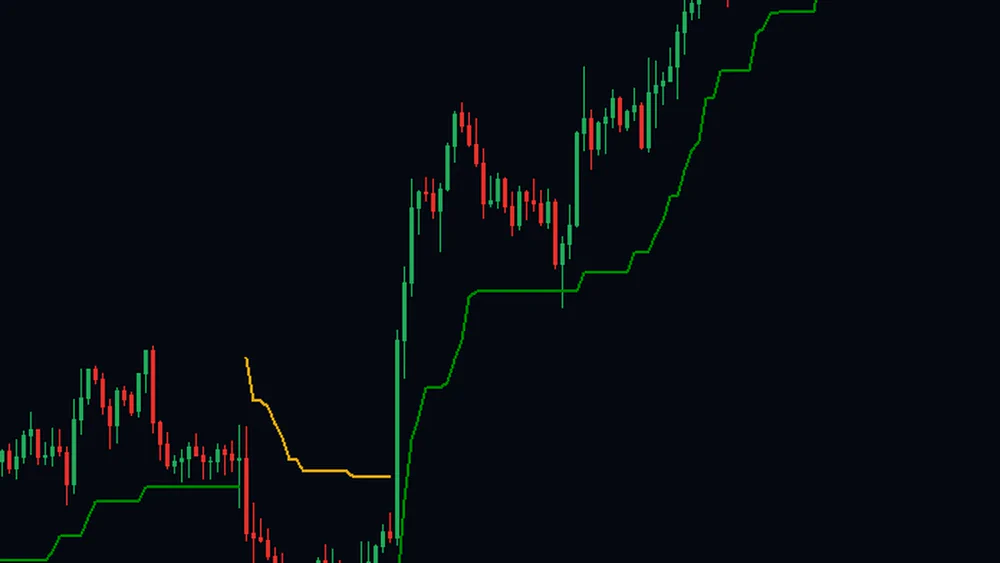
Once the trend is up, the line can rise but it cannot fall. Every step it takes is kept, so the distance between price and your exit tightens as the move extends rather than drifting back out.
That is the difference between a trail and a moving target. You can leave the trade alone and let the line do the tightening, which is exactly the part most traders get wrong by hand.
Tells You The Side Has Changed
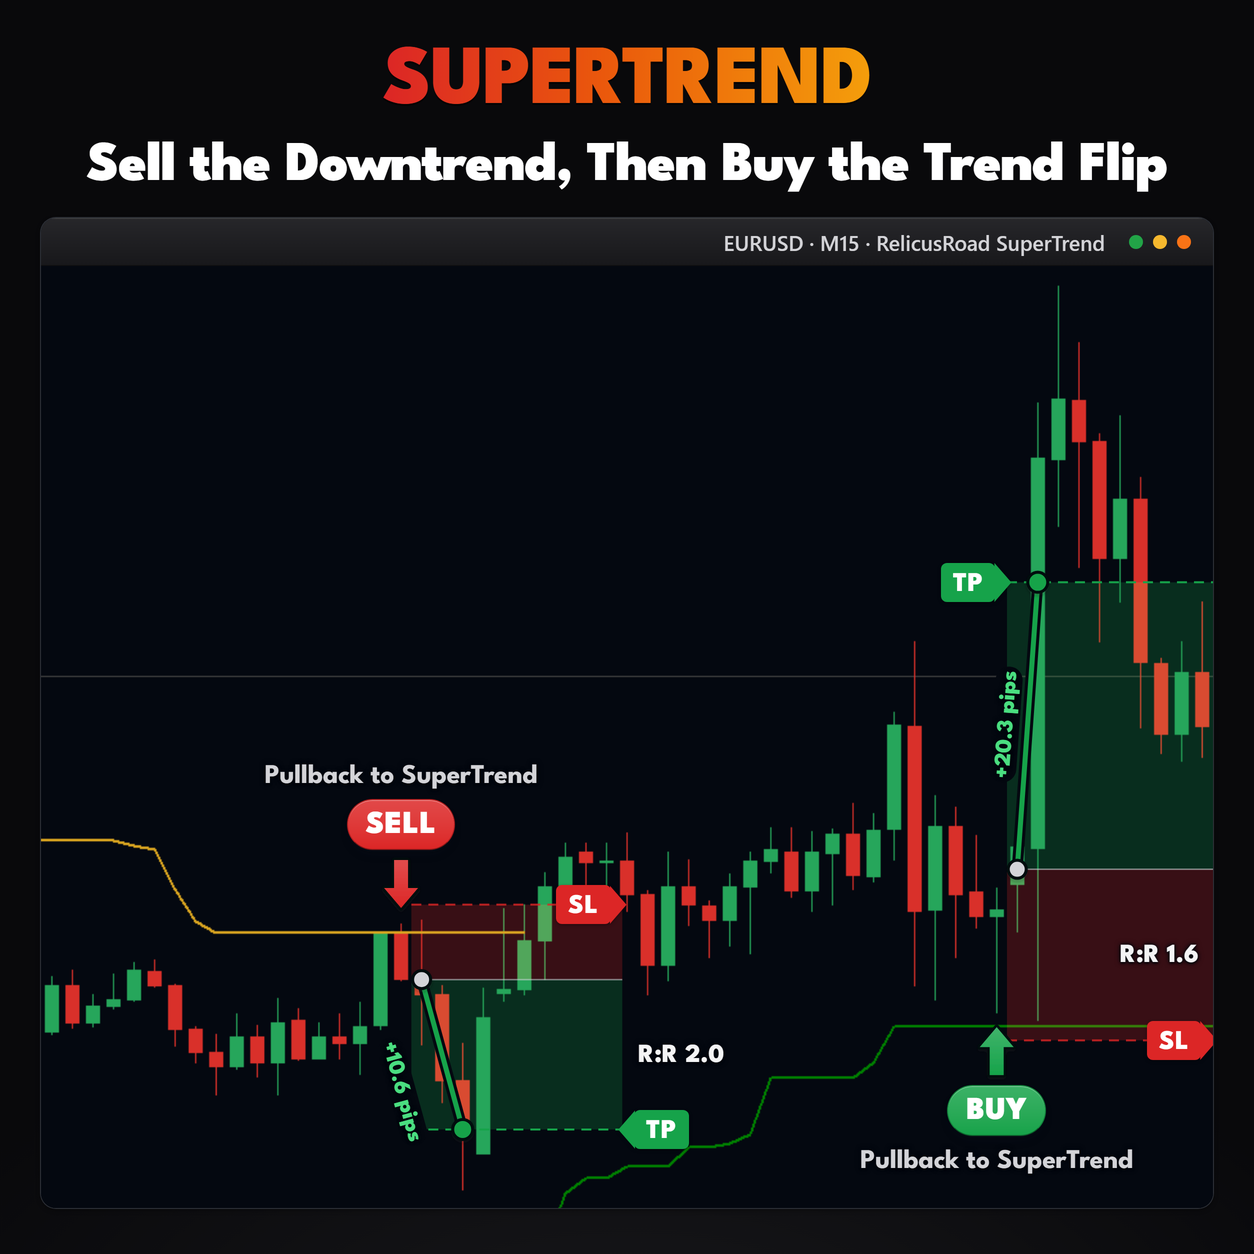
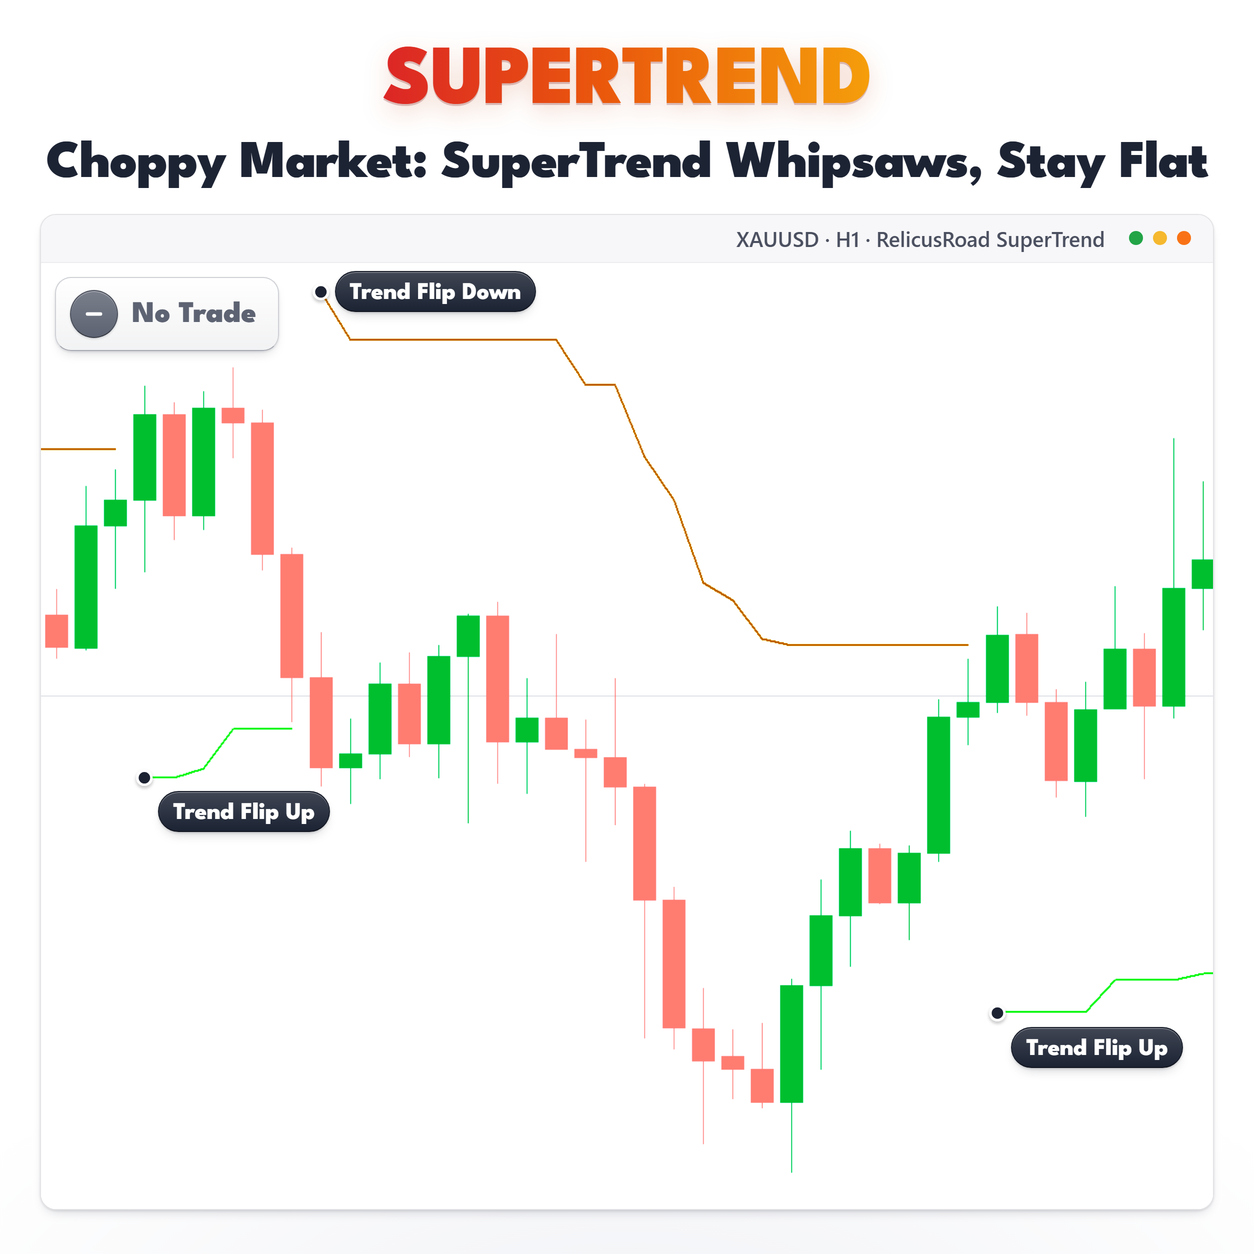
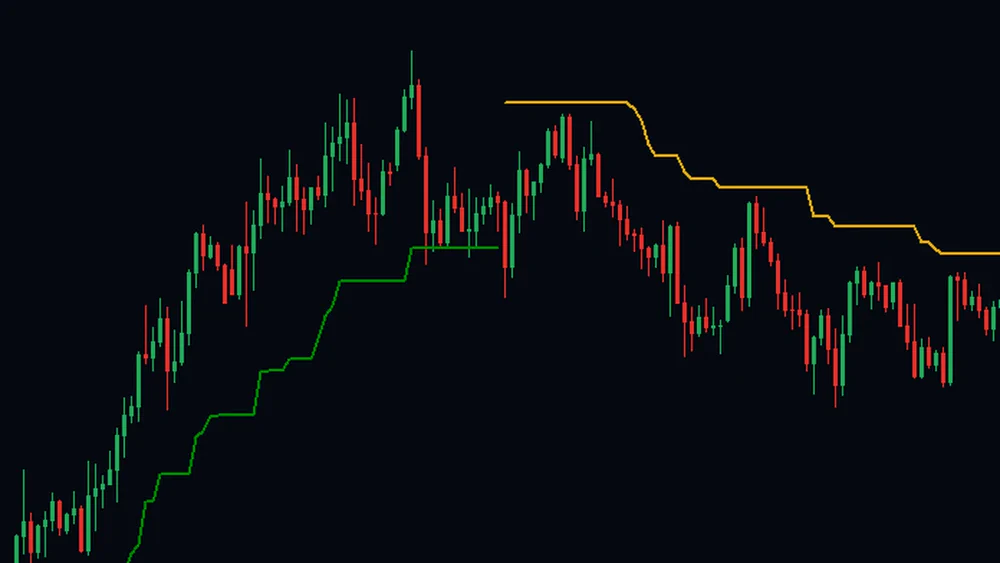
A close beyond the band ends the green line, leaves one bar empty and starts the goldenrod line above price. No arrows, no labels, only the side change, which you can see from across the room.
That gap is your cue to stop treating dips as buying opportunities. Whatever you do next, the framing you had before the flip no longer applies.
Ignores Wicks, Waits For The Close
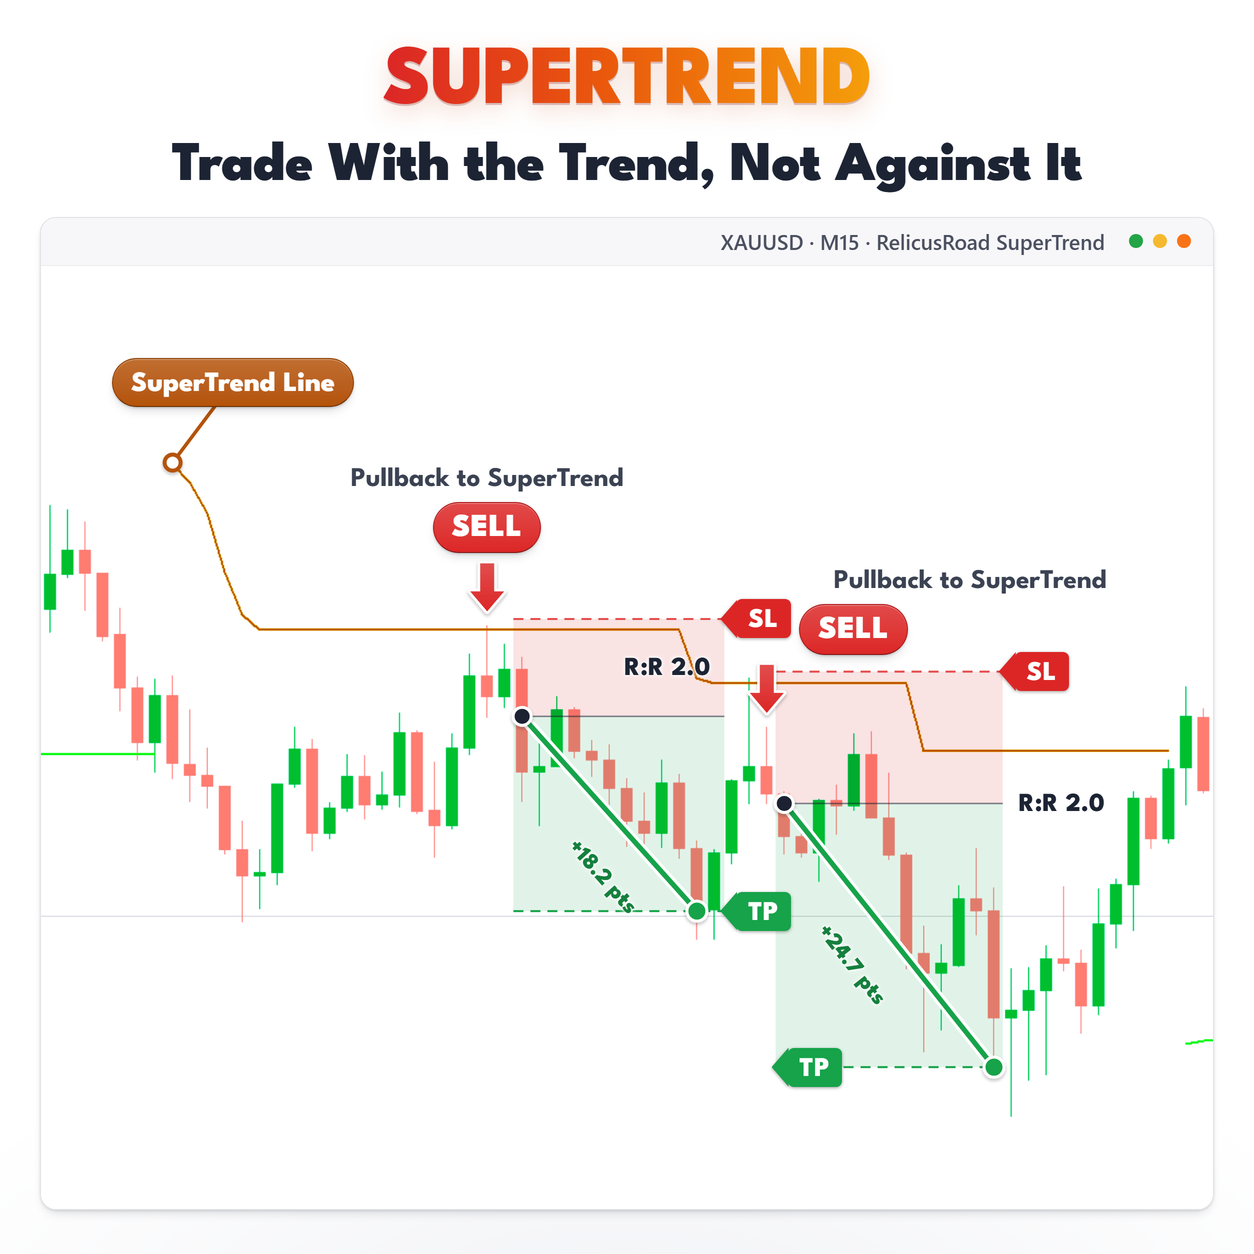
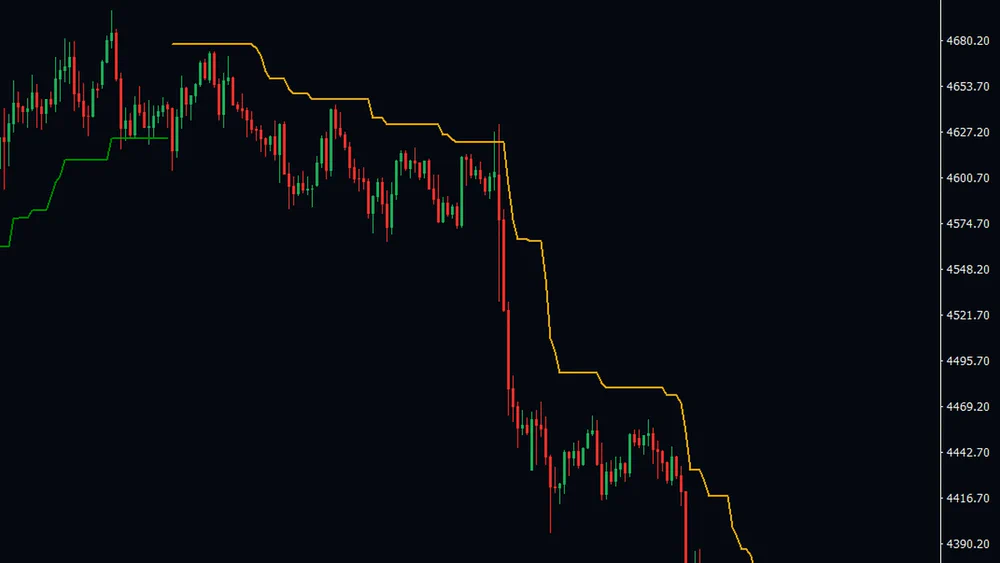
Through this whole decline the goldenrod line steps down and price never closes above it, so the read never changes. Wicks reaching up into the line do nothing, because the test is a close against the previous bar’s band and it runs once per bar.
Being slower is the feature. An indicator that reacts to every tick would have flipped you three times inside this move, and each flip is a decision you have to make and a spread you have to pay. The cost is stated plainly. A recent flip can settle a bar earlier or later once the chart reloads and rebuilds from final prices.
Reading It On A Live Chart
The simplest use is direction. While the line is green and below, you are looking for longs and treating dips into the line as pullbacks rather than reversals. The moment it flips, that framing is gone.
The second use is the trail. The line only moves with the trend, so its current value is a ready-made stop level that tightens as the move extends. Traders who like a mechanical exit can ride the line until the flip prints.
The third thing to watch is flip frequency. A run of quick flips on a chart that is going nowhere is
the band telling you the multiplier is too tight for this symbol, or that there is no trend to follow.
Widen the multiplier or step up a timeframe, rather than taking every flip.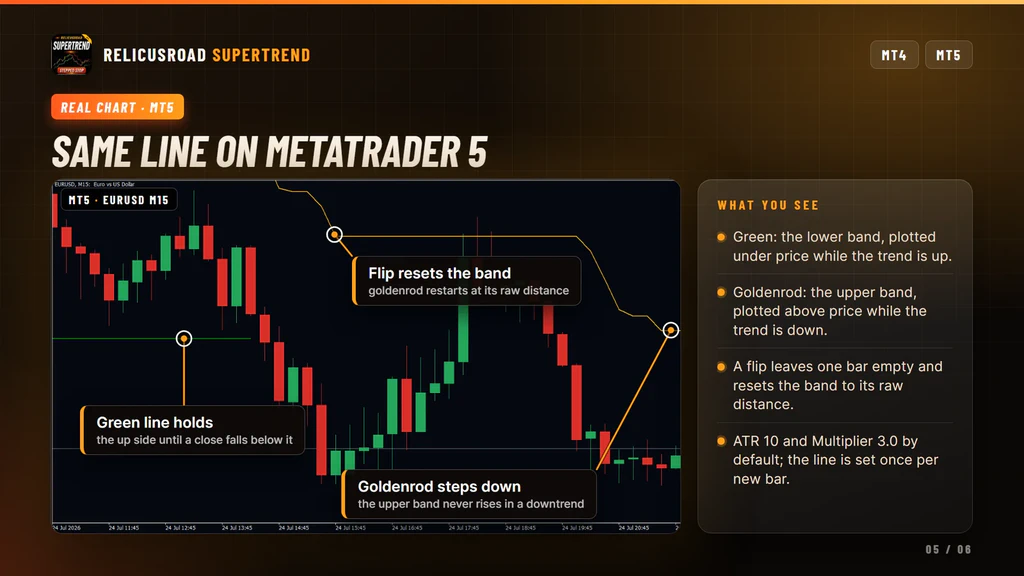
Settings You Can Change
Calculation: ATR Period, 10 by default, and Multiplier, 3.0, which set how far the band sits from median price. History controls how many bars are calculated, 3000 by default and capped at 5000.
Timeframe: an input exists, and it should stay on the current chart. Higher-timeframe values are written bar for bar without matching times, so the line would not line up with the real higher-timeframe SuperTrend.
Line style: up color and down color, green and goldenrod out of the box, plus a style and a width for each side. Two clicks give you a dotted down line if you prefer the sides to look different.
The multiplier is the setting that changes behaviour. Everything else is presentation.
What It Does Not Do
Worth knowing before you install:
- It does not draw arrows or flip markers. The side change and the one-bar gap are the whole signal.
- It does not send alerts in this build. The toggle is there, nothing is delivered.
- It does not align higher timeframes. Keep the timeframe input on the current chart.
- It does not update inside a bar. A wick through the line does not flip it.
- It does not claim to be non-repainting. Recent bars are computed at bar open and are rebuilt from final prices after a reload.
Setup In Three Steps
- Buy it on the MQL5 Market and install it from the Market tab of your terminal.
- Drag RelicusRoad SuperTrend from Navigator, Indicators, Market onto the chart you trade.
- Set the multiplier for the symbol, then leave it alone long enough to judge it.
It runs on forex, gold, indices, stocks and crypto, on any chart timeframe. A good habit is to check
the same symbol on two timeframes. When the flips disagree, the higher one tells you which side the
lower one is fighting.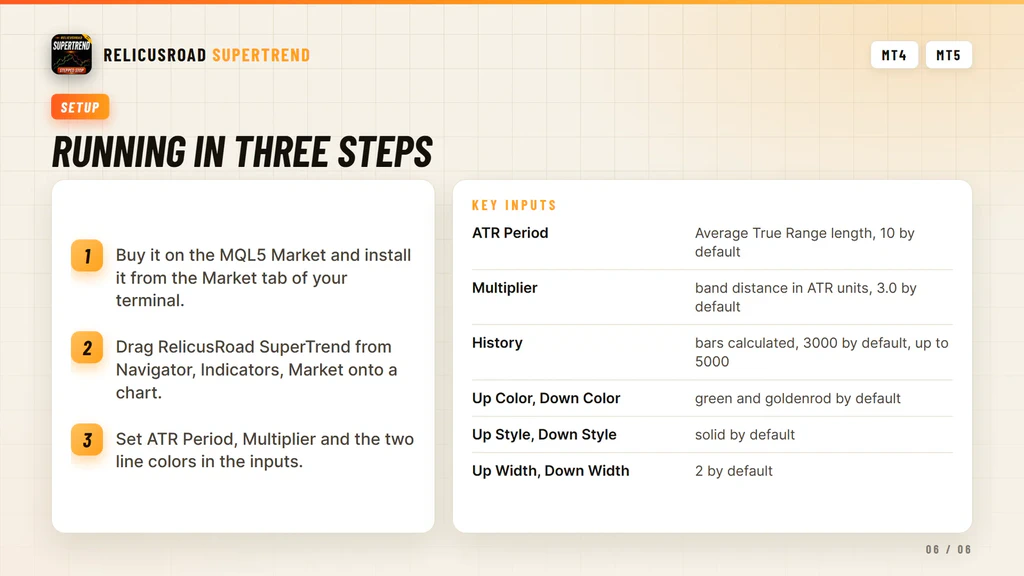
Where It Comes From
This is the ATR trend module out of RelicusRoad Pro, released on its own as a single-line trend filter. It runs standalone and needs no other RelicusRoad product. Traders who want the same question answered by a moving average with a filter behind it use Signal Line, and Signal Cloud adds a band that shows how strongly the fast and slow averages disagree.
Support runs through the product comments and the mql5.com messaging system.
Frequently Asked Questions
Everything you need to know about RelicusRoad SuperTrend. Still curious? Reach out anytime.
Learn How to Trade It
Every indicator ships with reference documentation and a matching strategy guide. You can also read what other traders say or start with the setup guide.
Indicator Reference
- Road Levels Dynamic S/R levels around a moving center line
- Support & Resistance Advanced S/R zones with alerts
- Action Levels Critical price levels for major moves
- Signal Lines Trend bias filter with two independent lines
- Daily High/Low/Open Daily extremes for range trading
- Daily Pivots Pro pivot points S1-S3, R1-R3
Trading Strategies
- Strategy #1: Price Action (Road) + SR + Trendlines + 2 TFs
- Strategy #2: Local Trendline + Price Position on Road + 2 TFs
- Strategy #3: Arrows + Price Action (Road) + SR
- Strategy #4: MicroScalping + Multiple Pairs + Daily Target 2-10%
Trading Guides
- Non-Repaint Forex Indicators: What 'Non-Repaint' Actually Means (and How to Verify It)
- Prop Firm Challenges: The 'Slow Boring' Strategy to Getting Funded
- Market Sessions Trading: How to Time the 'London-NY Overlap'
- What Is Forex Trading and How Does It Work?
- The Real Cost of Trading Platforms in 2026: A Broker-Neutral Teardown
- Position Sizing: The Boring Math That Keeps Traders Alive
- Forex Trading Psychology: 7 Traps and Process Fixes
Related tools
Single RelicusRoad indicators for MT4 and MT5, each one standalone.



