
What It Does
Support and resistance drawn by hand ends up as a chart full of lines, none of which carry a record of what price did at them. RelicusRoad Support Resistance replaces the lines with a short list of zones, and gives every zone a grade you can read at a glance.
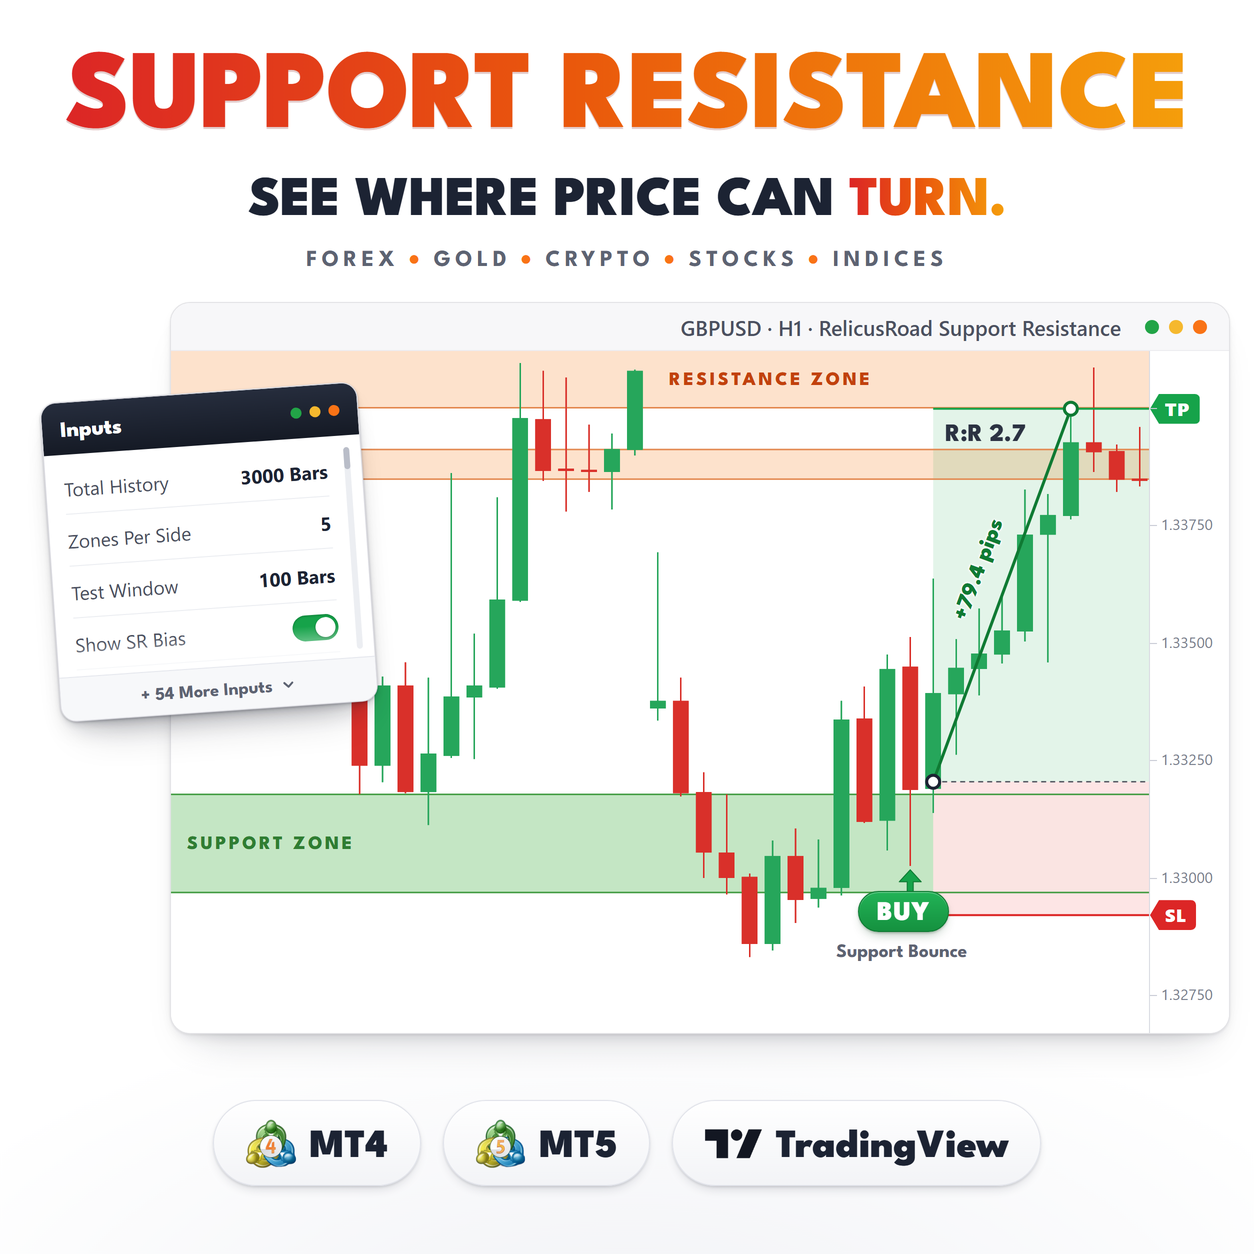
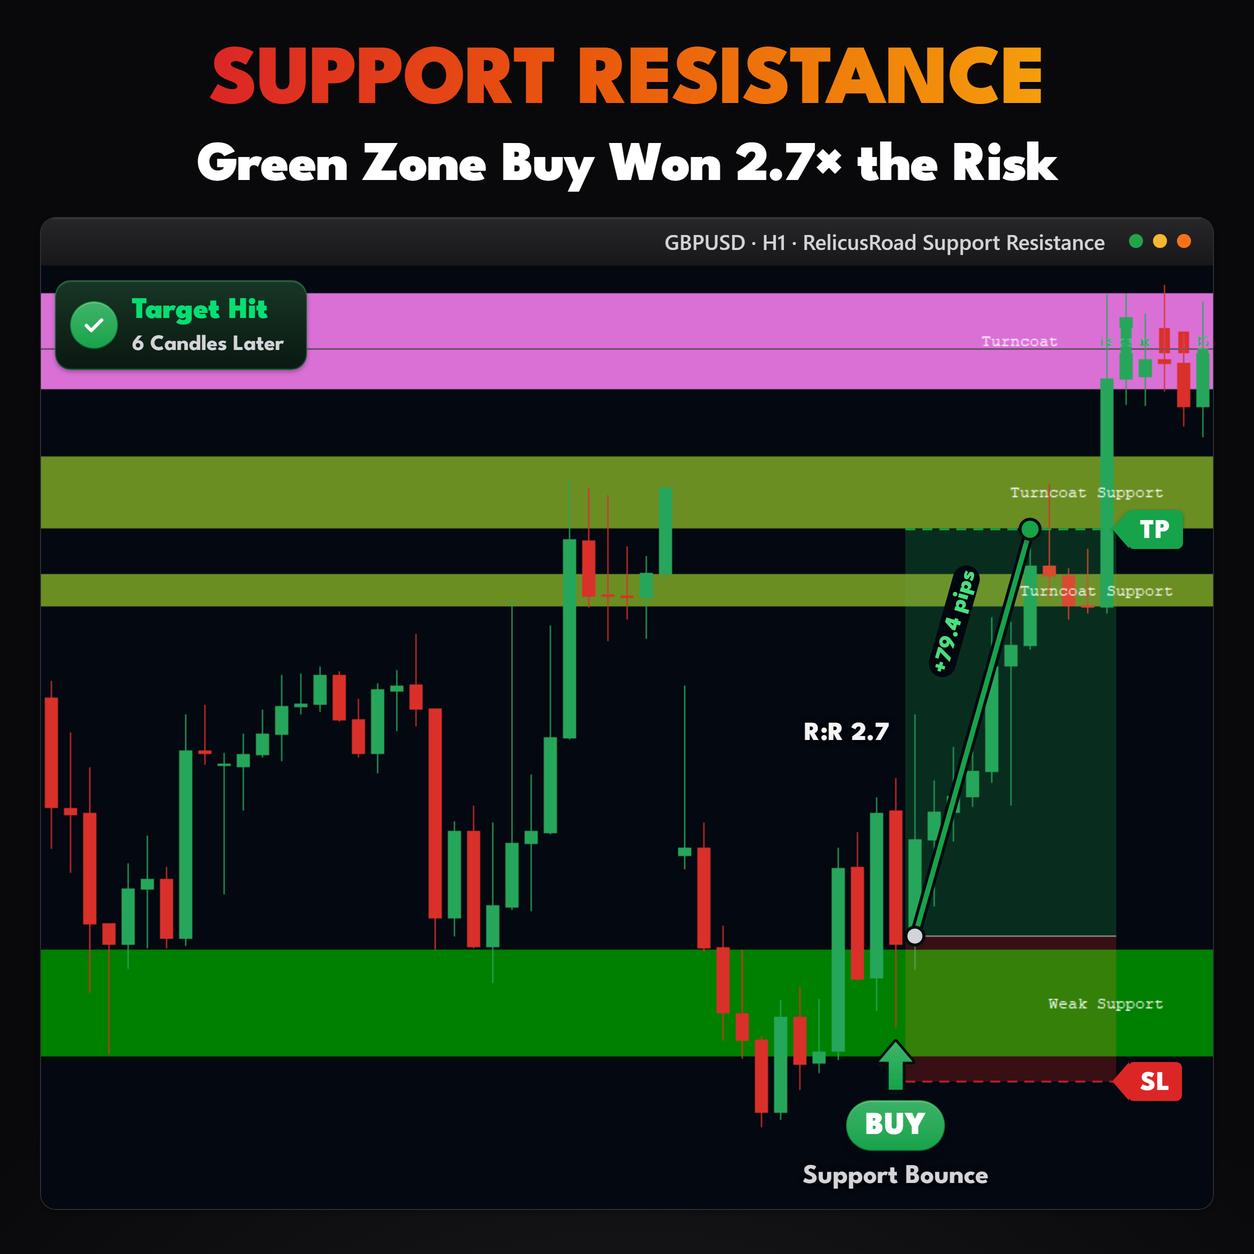
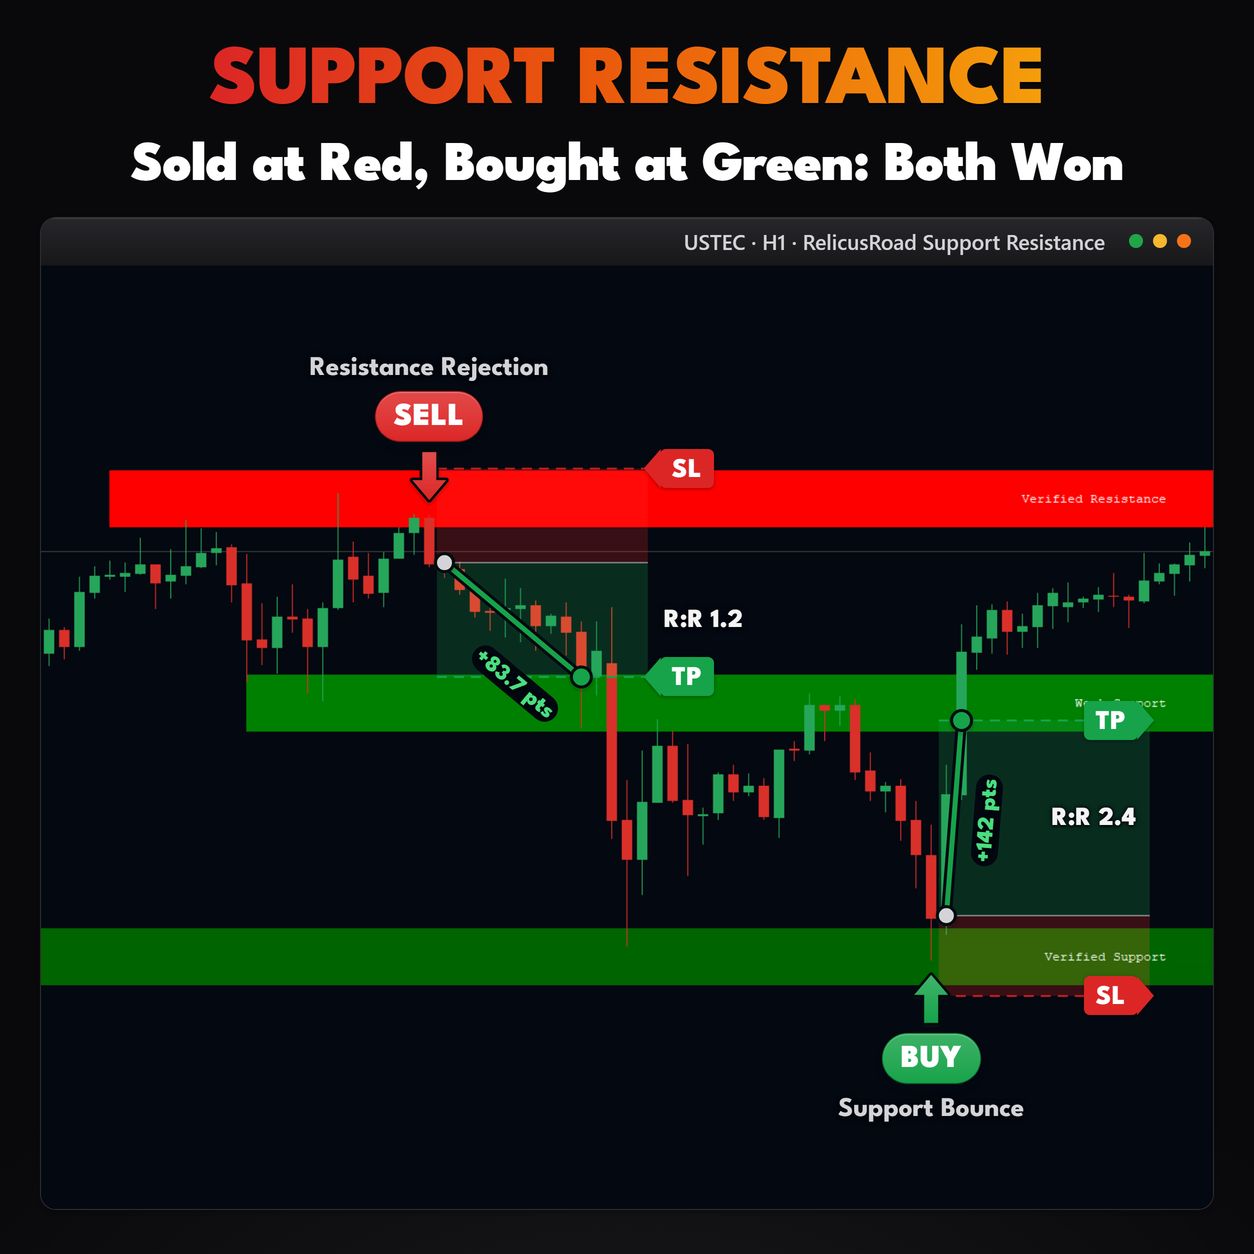
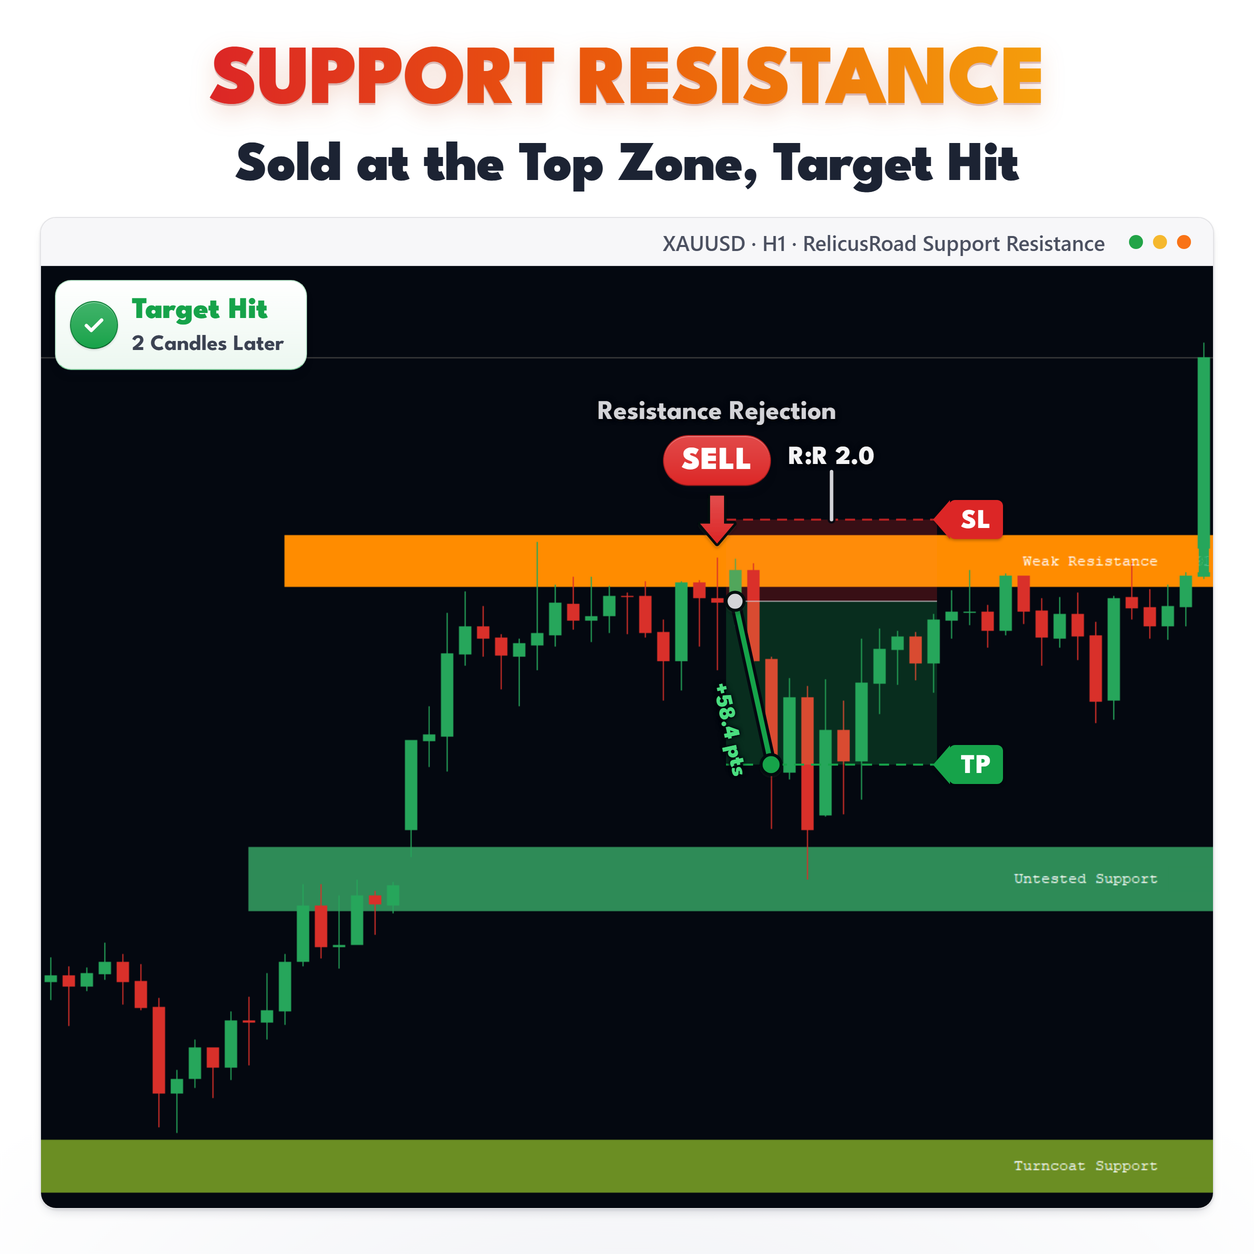
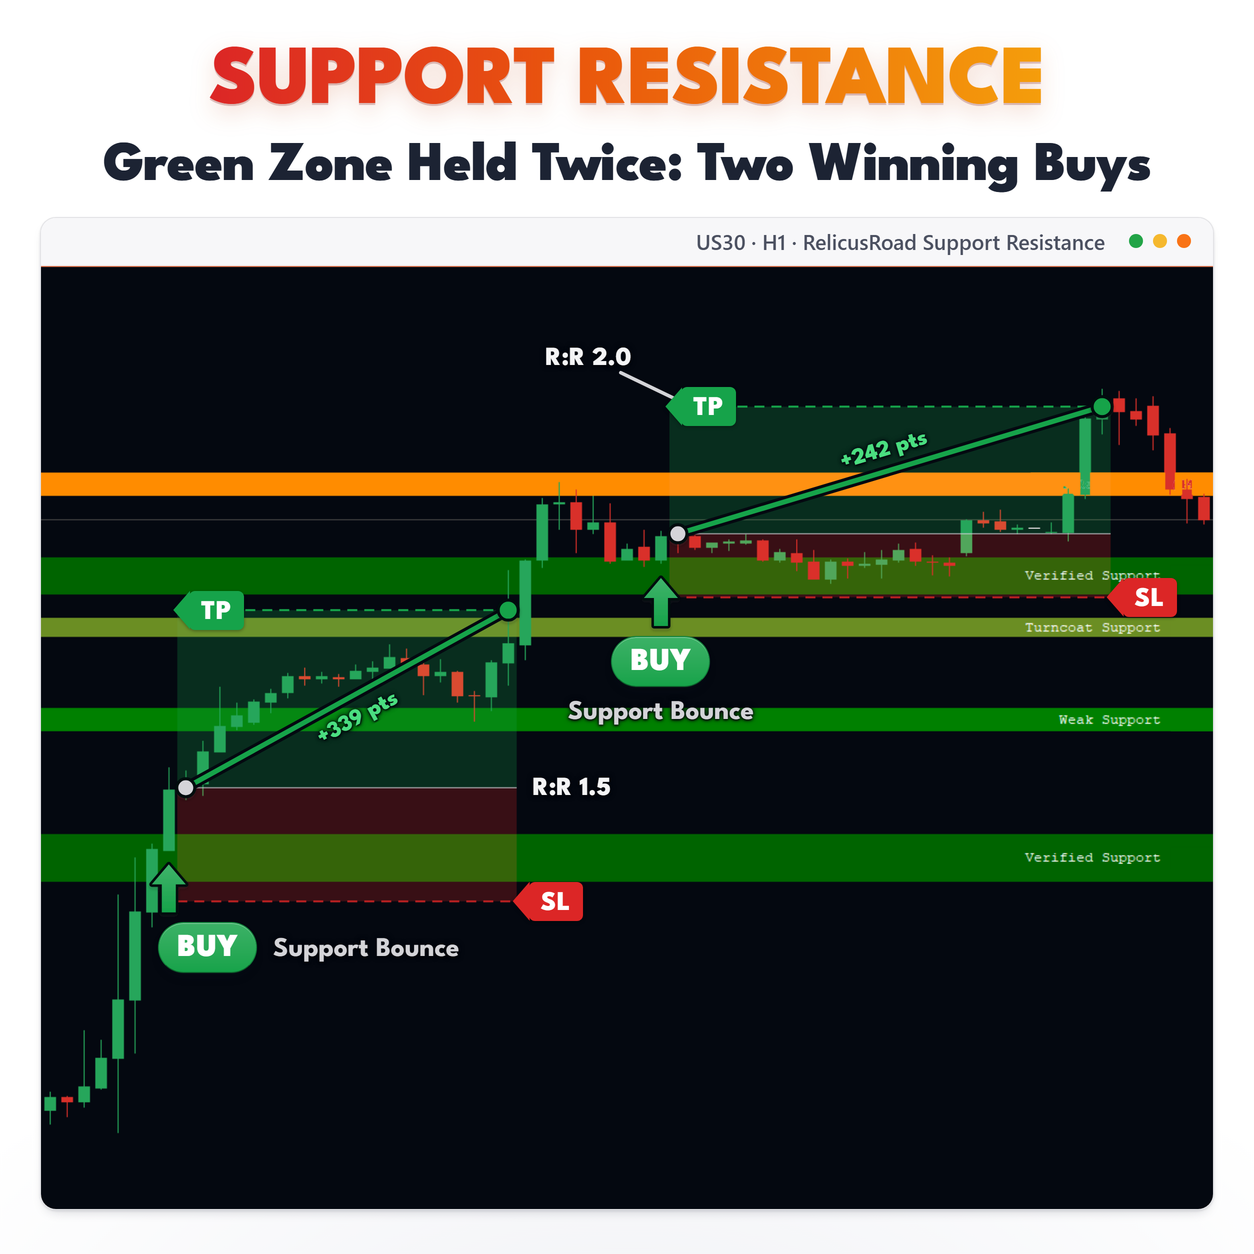
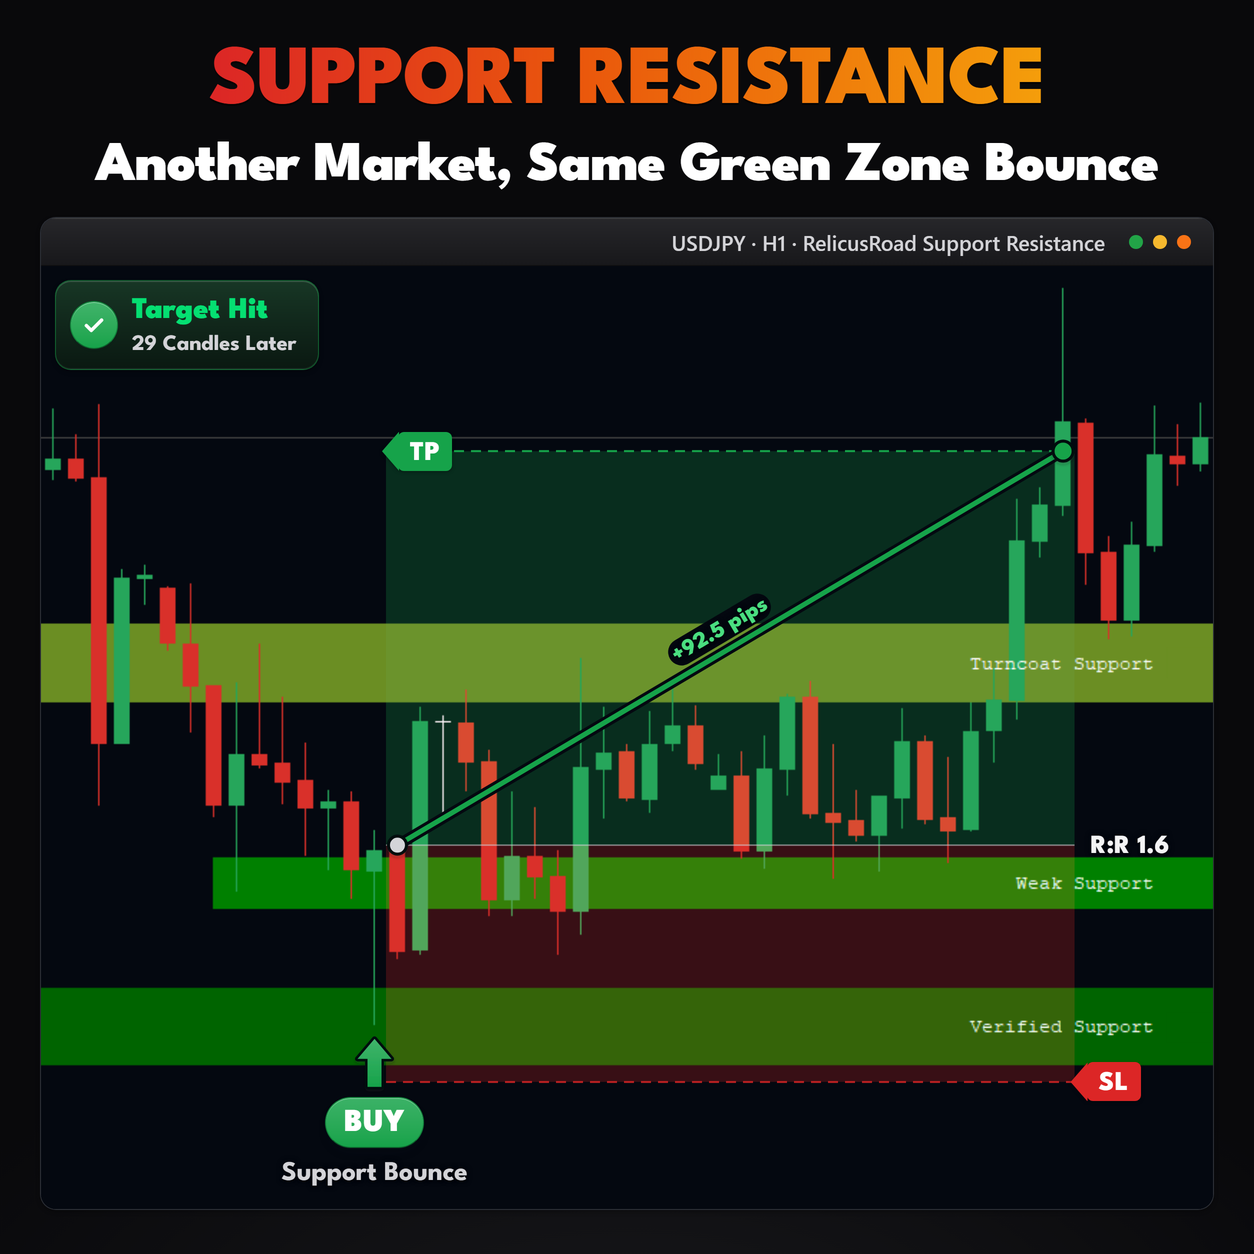
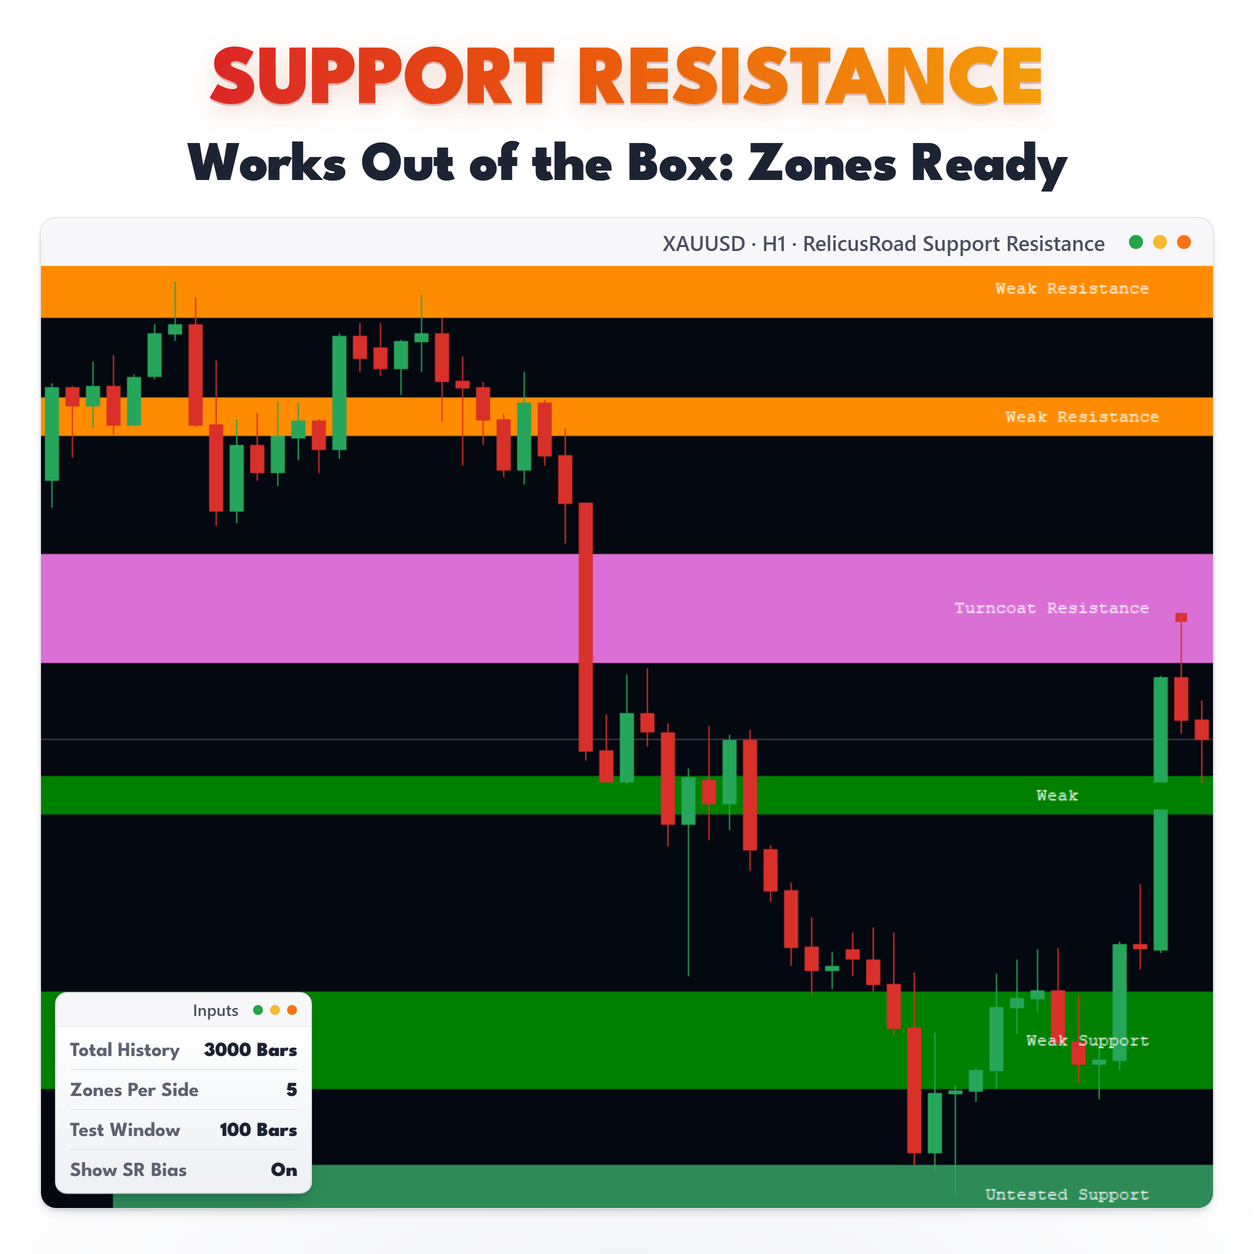
Each zone is a filled rectangle with a label. The label tells you the grade, whether the zone is currently support or resistance, how thick it is in points, and how many separate times price has tested it recently. A corner reading called SR Bias sums up whether the strength near price sits mostly below it or above it.
You get a handful of zones above price and a handful below, not twenty. The map stays readable.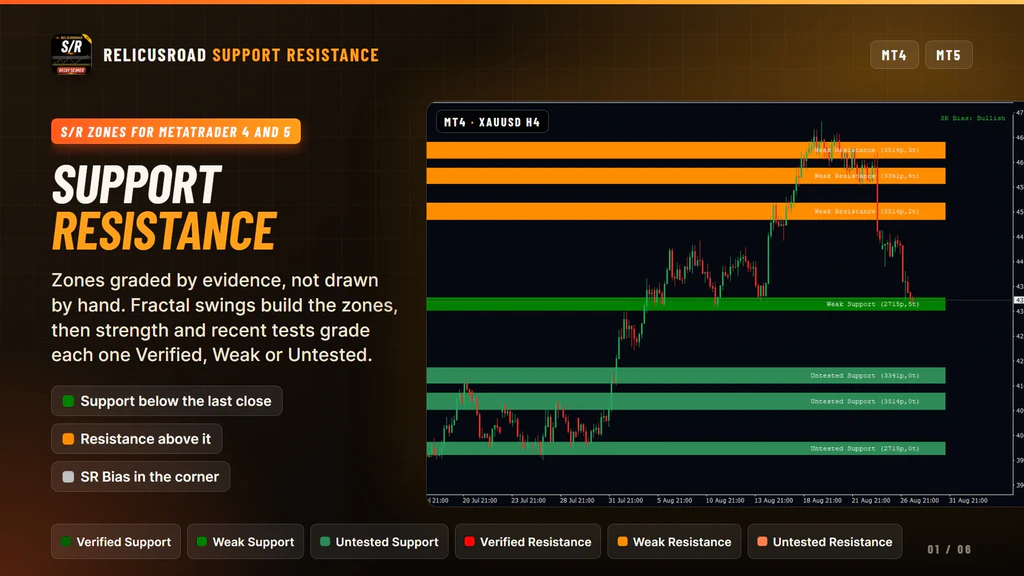
How It Works
The zones start from swing points. A swing high is a bar whose high is not exceeded by the 7 bars on either side of it, and a swing low is the mirror. Those are the same fractal swings that RelicusRoad Fractals draws as arrows, used here as raw material instead of as markers.
Not every swing counts the same. A swing that is also a larger 15-bar swing counts for more, so does one that price reacted strongly away from, and recent swings count for more than old ones.
The weighted swings are then added up along the price axis. Where several of them stack at a similar price, that area becomes dense, and the densest separated areas become the zones. Zones are kept at least 0.75 of the Average True Range apart and never overlap, which is what keeps the count low.
Finally each zone is scored and graded from its strength and its recent tests, and drawn in the color
of its grade.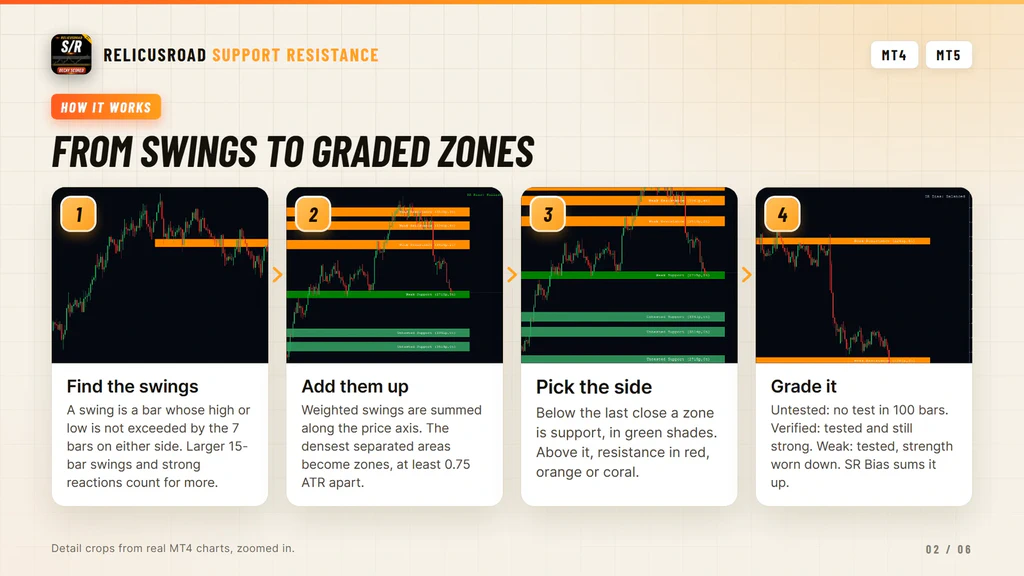
The Map Is Rebuilt Every Bar
This is the part worth understanding before you buy. The zone map is not a set of fixed lines you drew last week. When a new bar opens, the whole map is built again from the history window.
In practice that means three things. A zone can change grade, because a new test has happened or because an old one has aged out of the 100-bar window. A zone can move slightly, because the swings feeding it have changed. And a zone can disappear, because stronger zones have taken its place in the short list.
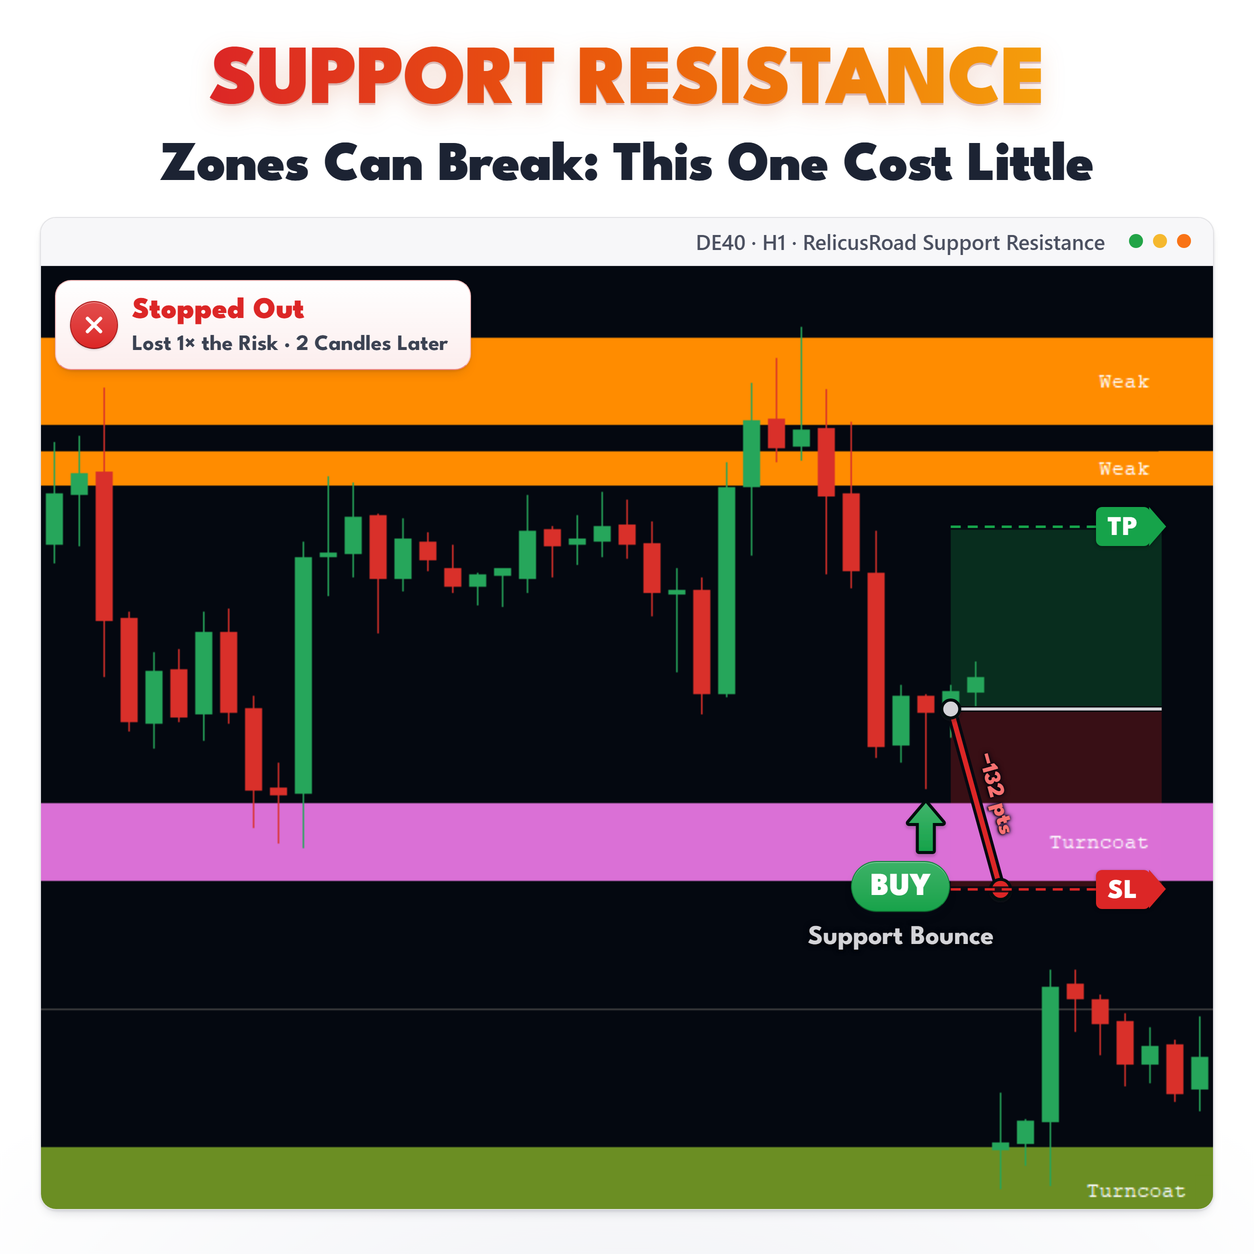
The side can change too. Support and resistance are decided by where a zone sits relative to the last closed price, so the moment price crosses a zone it is drawn in the other role.
None of that is a defect, it is what an evidence-based map does. It does mean you should read the
zones as the current state of the evidence, not as levels you can mark once and forget.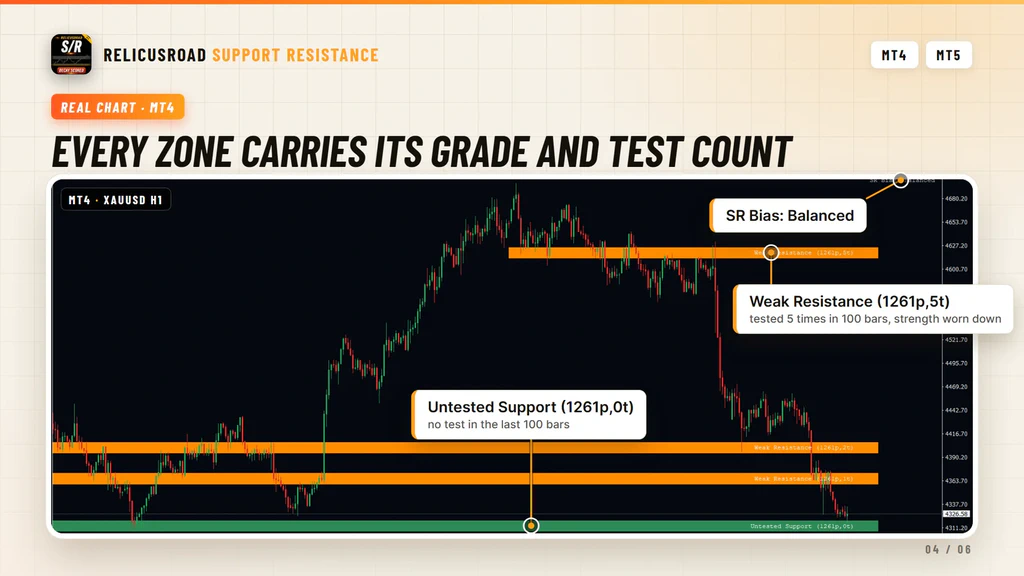
What You See On The Chart
| Element | What it tells you |
|---|---|
| Filled rectangle | A zone. Green shades below the last close, red, orange and coral above it |
| Grade in the label | Verified, Weak or Untested, the summary of strength and recent tests |
| Side in the label | Support or Resistance, from the zone’s position against the last close |
| Figures in brackets | Zone width in points, then the number of separate tests in the last 100 bars |
| SR Bias in the corner | Bullish, Bearish or Balanced, from the strength sitting near price |
| Zone span | Each rectangle starts a few bars before its oldest swing and runs a few bars past the current one |
- Filled rectangle
- A zone. Green shades below the last close, red, orange and coral above it
- Grade in the label
- Verified, Weak or Untested, the summary of strength and recent tests
- Side in the label
- Support or Resistance, from the zone’s position against the last close
- Figures in brackets
- Zone width in points, then the number of separate tests in the last 100 bars
- SR Bias in the corner
- Bullish, Bearish or Balanced, from the strength sitting near price
- Zone span
- Each rectangle starts a few bars before its oldest swing and runs a few bars past the current one
Every zone color is an input, one for each grade on each side, so you can make Untested zones faint
and Verified ones loud if that suits your eye.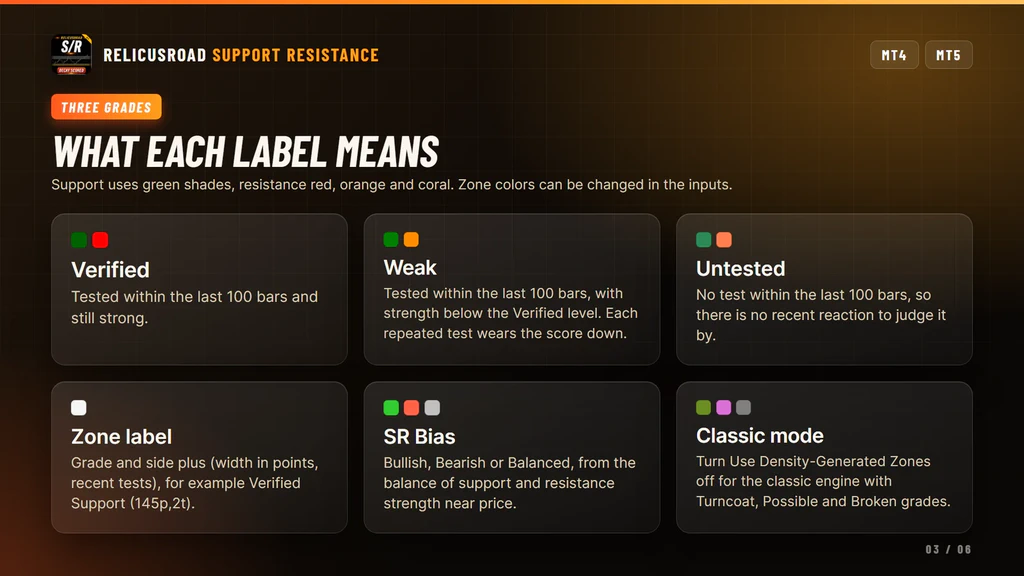
What It Does For Your Trading
Four things, each one you can check on a real chart before you trust it.
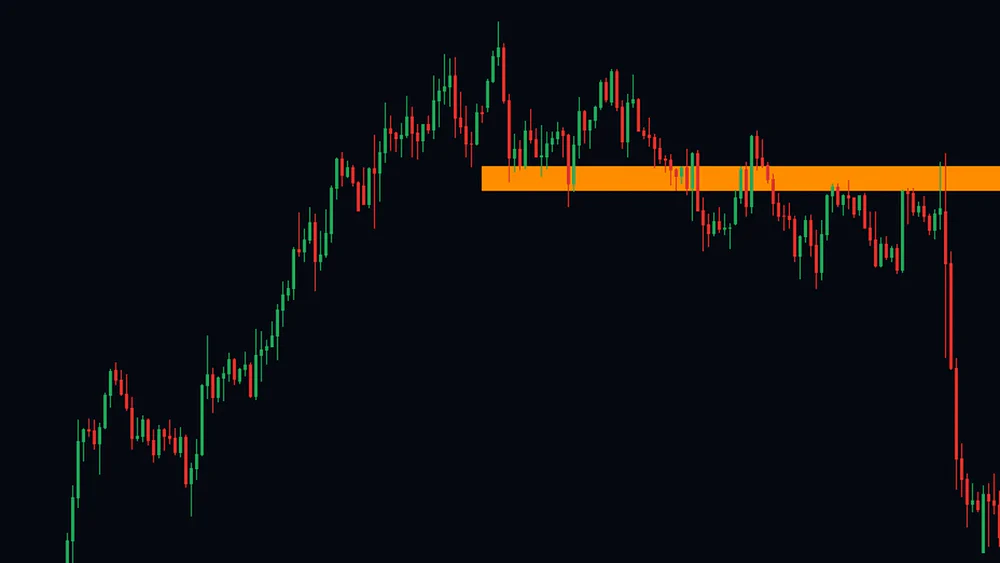
Turns Repeated Highs Into One Zone
Several swing highs at a similar price do not become several lines. They land in the same dense area along the price axis, and that area is drawn once, as a band with a top and a bottom.
You stop arguing with yourself over which high to draw from. The area price kept respecting is marked for you, at the width the swings covered.
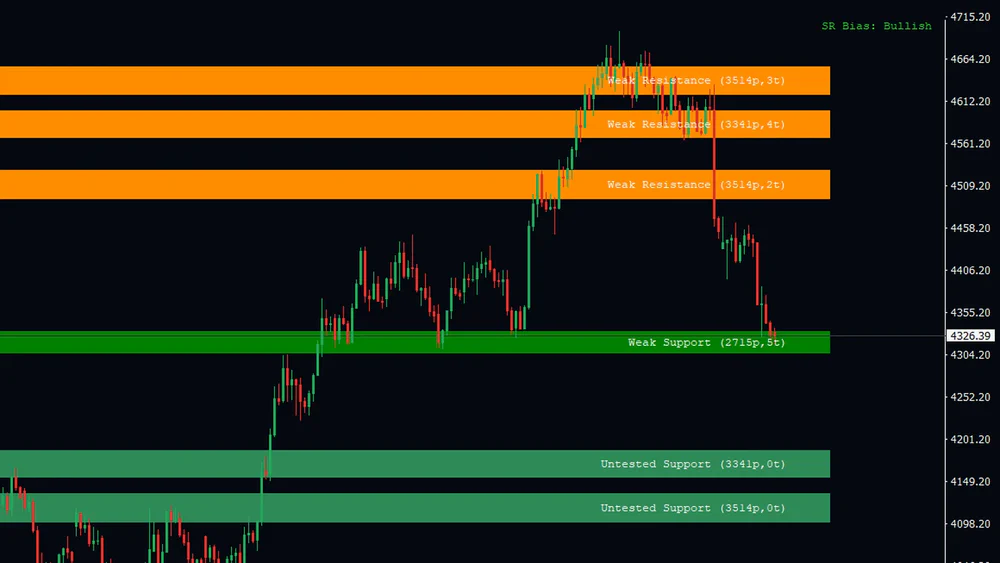
Gives You The Whole Map At Once
Zones are kept apart and capped in number, so you get a handful above price and a handful below, each labeled with its grade, its width in points and how many times price has tested it lately. The corner reading sums up which side carries more strength near price.
That is the whole picture for the session in one glance: where price is, what is above it, what is below it, and which of those areas the market has been visiting.
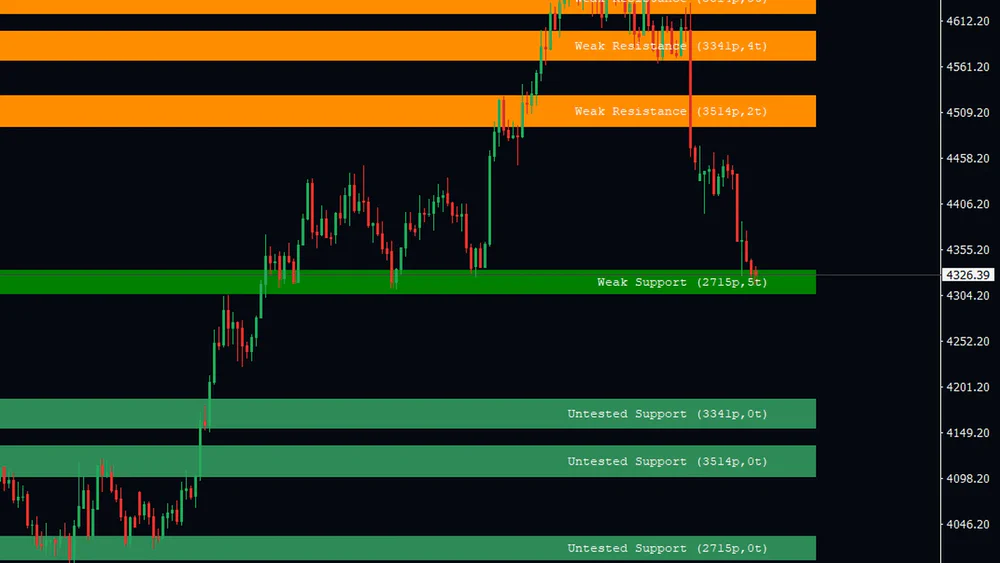
Shows Which Side You Are On
A zone below the last close is drawn as support in green shades, and one above it as resistance in red, orange or coral. Cross a zone and it switches role on the next rebuild.
When you are deciding where a stop goes, the zones under price are already separated from the ones over it, and the untested ones further down are the next places to aim at.
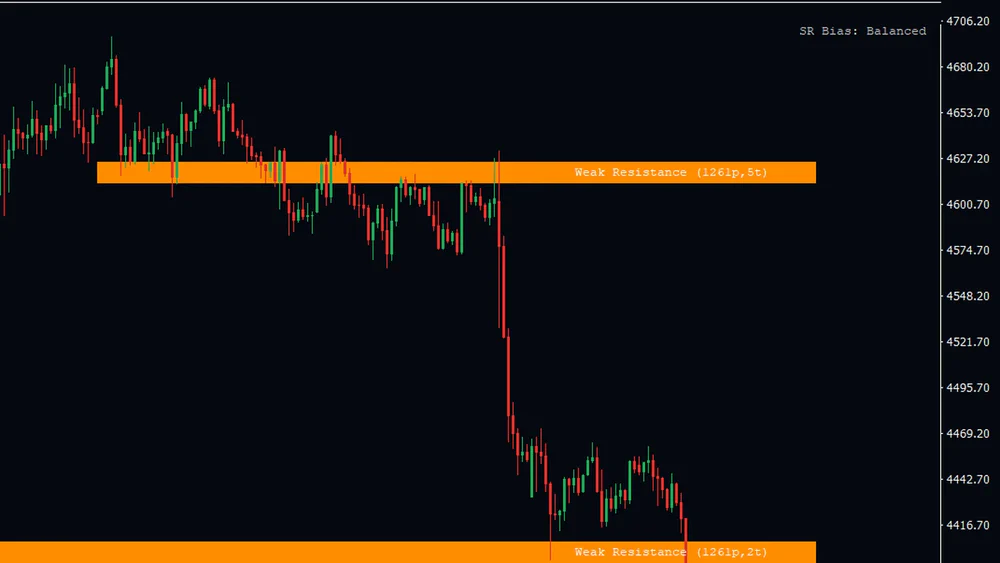
Downgrades A Level As It Wears Out
This zone has been tested five times in the last 100 bars, and the label says Weak rather than Verified. Each visit consumes some of what was waiting there, so the grade falls even though the level held every time.
It reads as a warning rather than a badge, and that is the point. The grade describes what price has already done at the zone, not what it will do next, so you can size a trade at a worn level accordingly.
Reading It On A Live Chart
An Untested zone is a level with history but no recent reaction. It is where price has turned before and has not been back within the last 100 bars. A Verified zone has been visited recently and still carries a high score. A Weak zone has been visited too, and the visits have worn the score down.
That last case is the one traders misread. Weak does not mean the level failed. It means the market has been there several times lately, and each visit consumes some of what was waiting there.
Zones suit H1 and above, where each one has had time to be tested. On M1 and M5 the zones are
tighter and turn over quickly, which is what Adapt Geometry By Timeframe is for.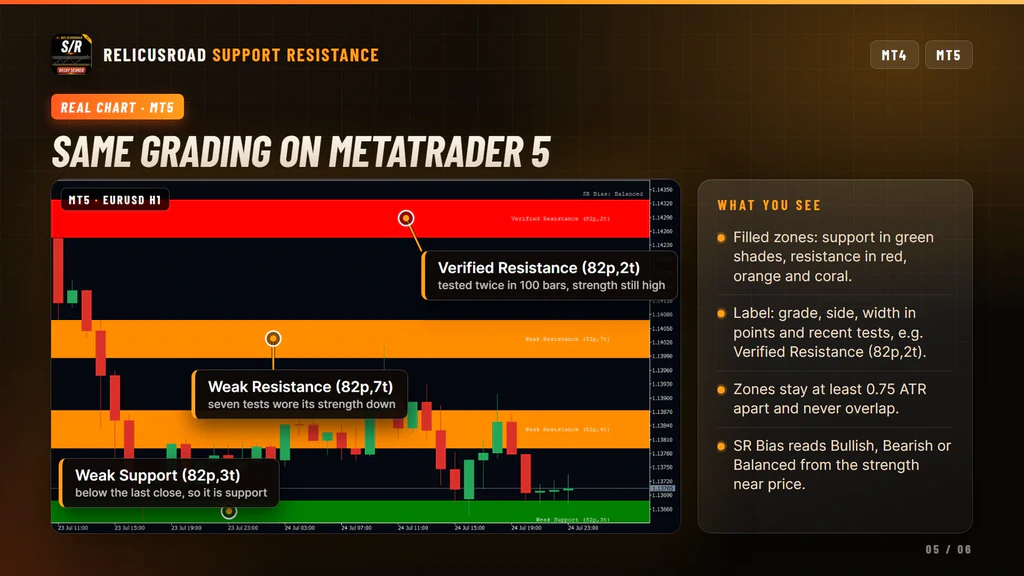
Settings You Can Change
Zone building. Timeframe, to build zones from the chart or from a higher timeframe. Total History and Zone History, the bars scanned and the cap on zones kept. Use Density-Generated Zones, on by default, which you can turn off for the classic engine with its Turncoat, Possible and Broken grades. Adapt Geometry By Timeframe, Maximum Zones Per Side and Recent Test Window, five zones per side and 100 bars by default.
Display. A separate switch for each grade, so you can hide Untested zones entirely. Show Info and Show Points for the label text and the figures in brackets. Show SR Bias for the corner reading. Fill Colors, Boundary Line Width and Boundary Line Style. Label Font and Label Size. A support color and a resistance color for every grade.
What It Does Not Do
Worth knowing before you buy:
- It does not deliver alerts. The Show Alerts input exists, but no alert reaches you in this build.
- It does not use Zone Sensitivity, Merge Near SRs or Merge Past SRs while density zones are on. Those belong to the classic engine. Zones are kept apart by the separation rule instead.
- It does not apply Label Color or Label Shift to Right. The label color and position are fixed.
- It does not keep zones still. They are rebuilt on every new bar and can move, change grade or go.
- It does not always hide weak or distant zones. If few strong ones are nearby, a weaker or more distant zone is shown so that each side still has something on it.
- It does not tell you what will happen at a zone. The grade describes what price has already done.
Setup In Three Steps
- Buy it on the MQL5 Market and install it from the Market tab of your terminal.
- Drag RelicusRoad Support Resistance from Navigator, Indicators, Market onto a chart. H1 and above is the natural home for it.
- Set Timeframe if you want higher timeframe zones, and switch off any grade you do not want to see.
It runs on forex, gold, indices, stocks and crypto. Give the chart enough history to load before you
judge the map, since the zones are built from the bars in the scan window.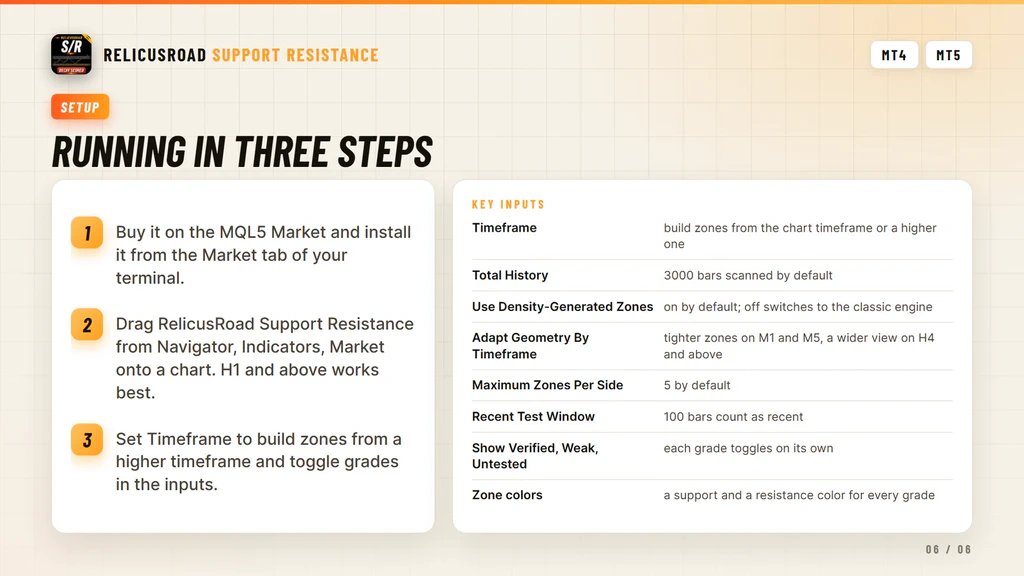
Where It Comes From
Zone grading is the support and resistance engine from RelicusRoad Pro, published separately for traders who already have their own entries and only need the levels. It runs standalone and needs no other RelicusRoad product. If you want the same levels read from several timeframes at once, that job belongs to Multi Timeframe Levels, and if you work from the candle that started a move rather than from tested areas, look at Order Blocks.
Support runs through the product comments and the mql5.com messaging system.
Frequently Asked Questions
Everything you need to know about RelicusRoad Support Resistance. Still curious? Reach out anytime.
Learn How to Trade It
Every indicator ships with reference documentation and a matching strategy guide. You can also read what other traders say or start with the setup guide.
Indicator Reference
- Road Levels Dynamic S/R levels around a moving center line
- Support & Resistance Advanced S/R zones with alerts
- Action Levels Critical price levels for major moves
- Signal Lines Trend bias filter with two independent lines
- Daily High/Low/Open Daily extremes for range trading
- Daily Pivots Pro pivot points S1-S3, R1-R3
Trading Strategies
- Strategy #1: Price Action (Road) + SR + Trendlines + 2 TFs
- Strategy #2: Local Trendline + Price Position on Road + 2 TFs
- Strategy #3: Arrows + Price Action (Road) + SR
- Strategy #4: MicroScalping + Multiple Pairs + Daily Target 2-10%
Trading Guides
- Non-Repaint Forex Indicators: What 'Non-Repaint' Actually Means (and How to Verify It)
- Prop Firm Challenges: The 'Slow Boring' Strategy to Getting Funded
- Market Sessions Trading: How to Time the 'London-NY Overlap'
- What Is Forex Trading and How Does It Work?
- The Real Cost of Trading Platforms in 2026: A Broker-Neutral Teardown
- Position Sizing: The Boring Math That Keeps Traders Alive
- Forex Trading Psychology: 7 Traps and Process Fixes
Related tools
Standalone MetaTrader indicators related to this one.



