
What It Does
Price behaves differently at 03:00 than it does at the London open, and every trader knows it. The problem is that your chart shows broker server time, which is not London time, not New York time and not your own.
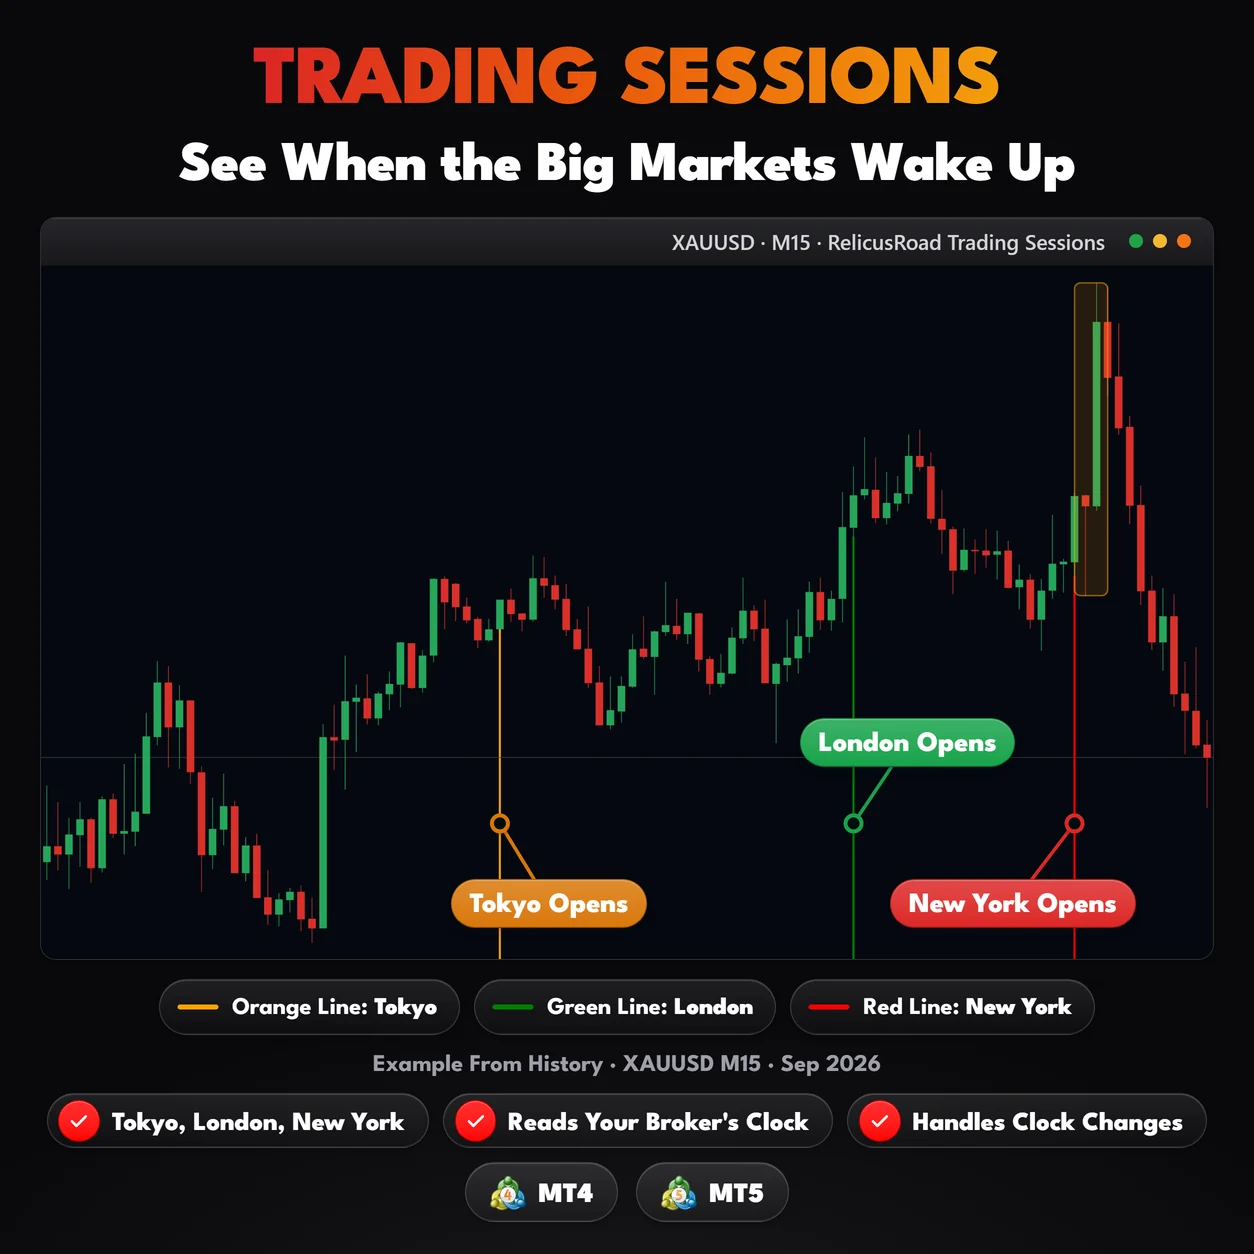
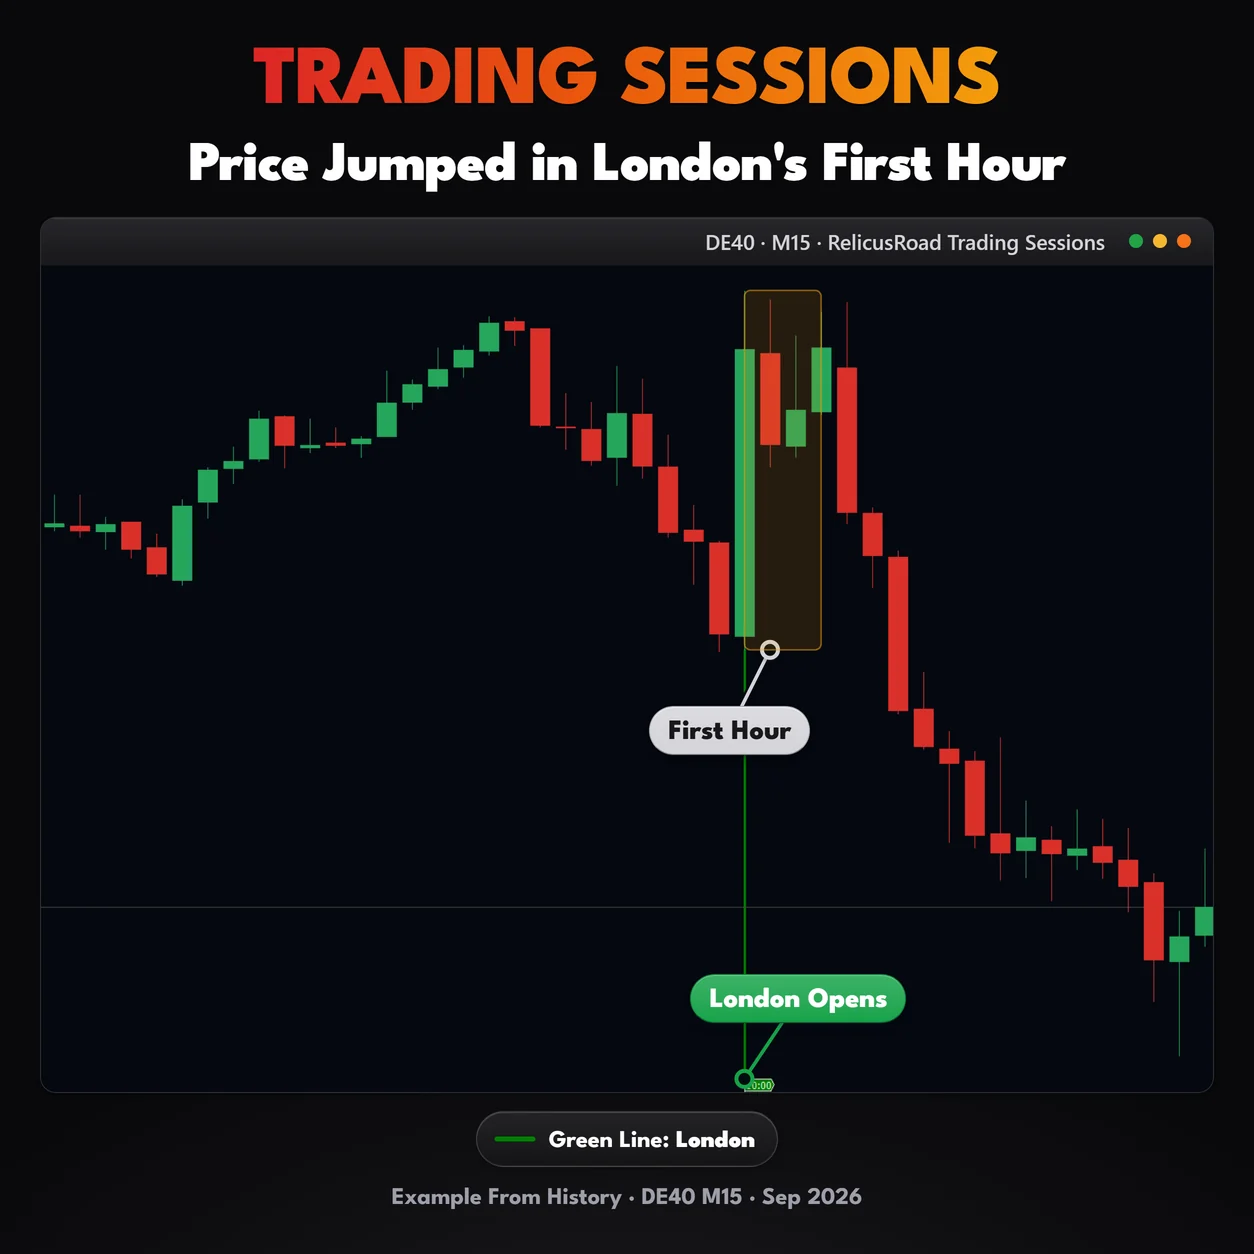
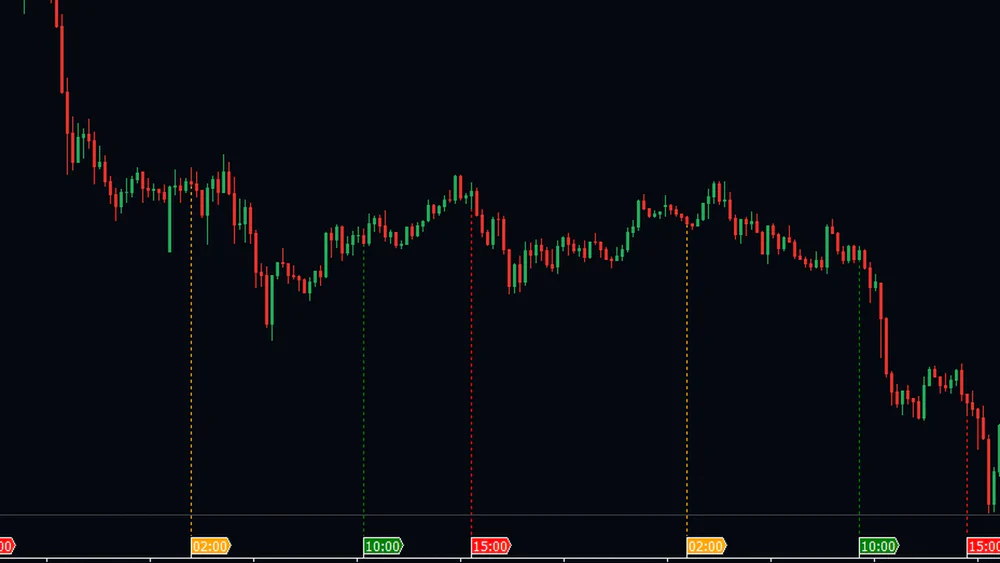
RelicusRoad Trading Sessions puts the three opens back on the chart. Tokyo, London and New York each get a dotted vertical line at the moment that session started, in its own color, for the last few weekdays. Hover a line and you get the session name and its opening time.
It marks opens and nothing else. No shaded session boxes, no session high and low, no overlap bands.
The chart stays readable, and the timing information is there when you want it.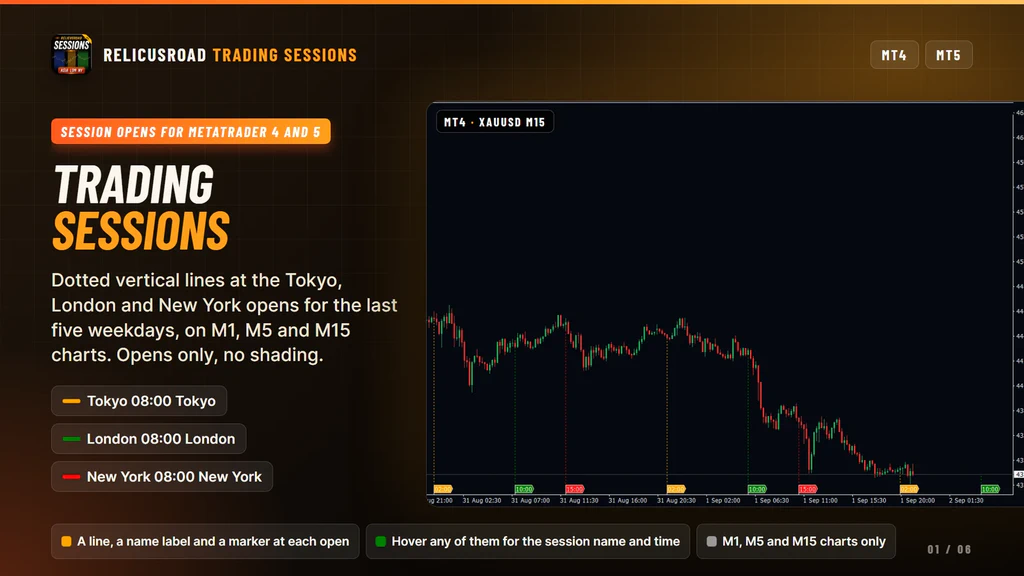
How It Works
Each session opens at 08:00 in its own city. The indicator turns that into your broker’s clock.
- It finds 08:00 in Tokyo, London and New York for each weekday, with each city’s own summer and winter time.
- It reads your broker’s clock by itself. Market closed? It uses the clock it saw last time. When prices move again, it checks once more.
- It draws each open in your broker’s time, on every weekday counting back from today. Weekends are skipped.
| Session | Opens at | In UTC | Default color |
|---|---|---|---|
| Tokyo | 08:00 in Tokyo | 23:00 the day before, all year | Orange |
| London | 08:00 in London | 07:00 in summer, 08:00 in winter | Green |
| New York | 08:00 in New York | 12:00 in summer, 13:00 in winter | Red |
- Opens at
- 08:00 in Tokyo
- In UTC
- 23:00 the day before, all year
- Default color
- Orange
- Opens at
- 08:00 in London
- In UTC
- 07:00 in summer, 08:00 in winter
- Default color
- Green
- Opens at
- 08:00 in New York
- In UTC
- 12:00 in summer, 13:00 in winter
- Default color
- Red
Five weekdays are drawn by default, including the current one. That gives you the same three lines
across a working week, which is what makes the comparison useful: how did price behave into the London
open on Monday, and on Tuesday, and today.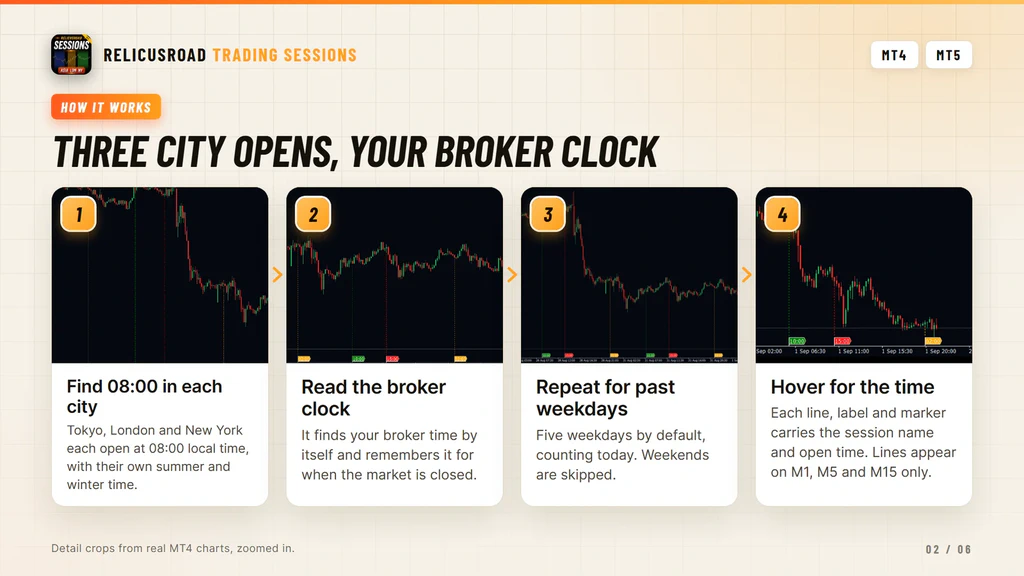
Clock Changes Are Handled For You
London and New York move their clocks twice a year, and not on the same day. For two or three weeks in March and one week around the start of November, the gap between them is one hour shorter than usual.
The indicator follows each city’s own calendar. The London line moves on the day London changes its
clocks, and the New York line moves on the day New York does. Tokyo never changes. Most brokers move
their own clock with New York, and that is followed too. You set nothing. On a broker that changes its
clock on another day, check the lines in the week of a change.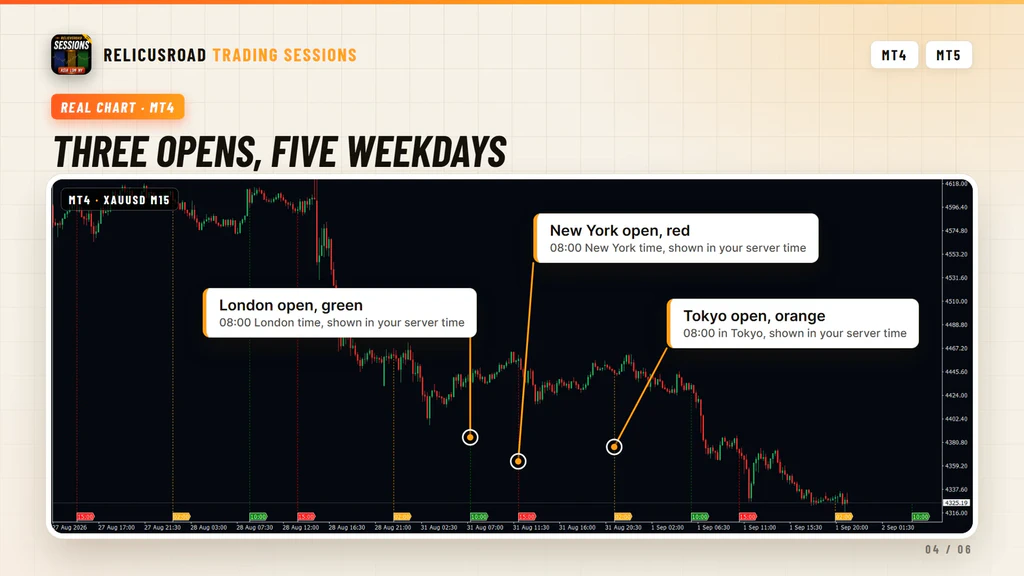
What You See On The Chart
| Element | Meaning |
|---|---|
| Dotted vertical line | The moment a session opened, drawn in the chart background |
| Rotated name label | The session name near the bottom of the chart, using your own wording |
| Event marker | A small marker at the same time along the bottom edge |
| Tooltip | The session name and its opening time, on the line, label or marker |
| Line to the right of price | Today’s session that has not opened yet |
| Nothing above M15 | M30, H1 and higher charts stay clear |
- Dotted vertical line
- The moment a session opened, drawn in the chart background
- Rotated name label
- The session name near the bottom of the chart, using your own wording
- Event marker
- A small marker at the same time along the bottom edge
- Tooltip
- The session name and its opening time, on the line, label or marker
- Line to the right of price
- Today’s session that has not opened yet
- Nothing above M15
- M30, H1 and higher charts stay clear
The lines mark time, not price. Nothing here is a level, and a line crossing the chart says only that a
session started at that bar.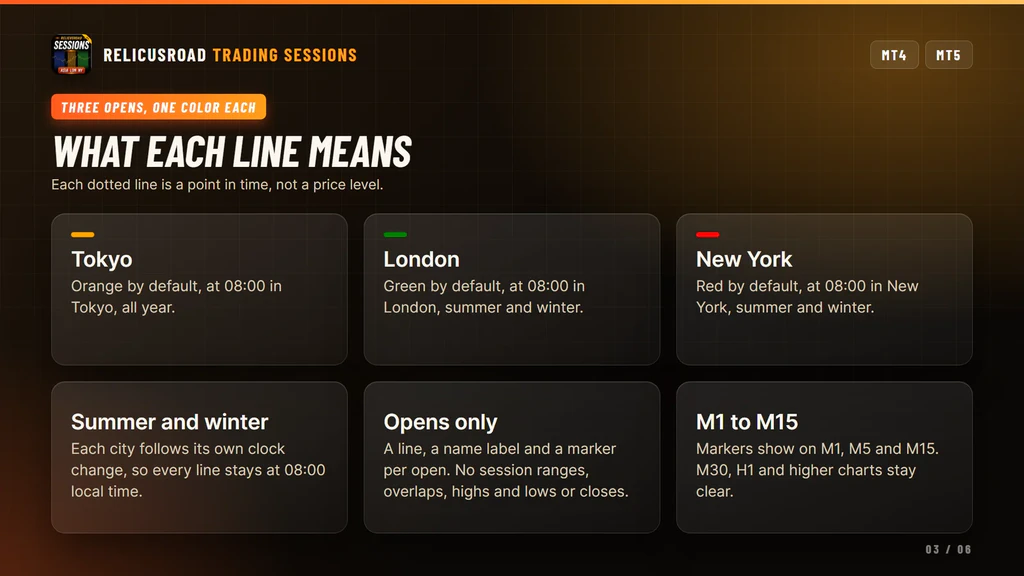
What It Does For Your Trading
Four things, all visible on a chart you can reproduce in your own terminal.
Marks The Hour The Market Changed
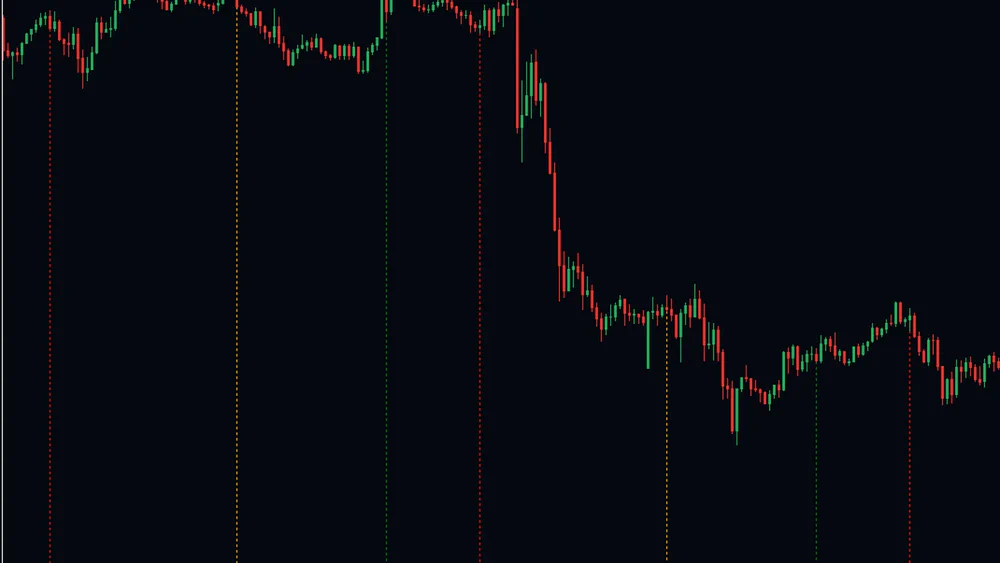
Each open gets a thin dotted line in its own color, orange for Tokyo, green for London and red for New York, drawn behind the candles so the price action stays in front.
The move you are looking at either started at one of those lines or it did not, and that single fact changes how much weight a breakout deserves.
Translated Into Your Broker Clock
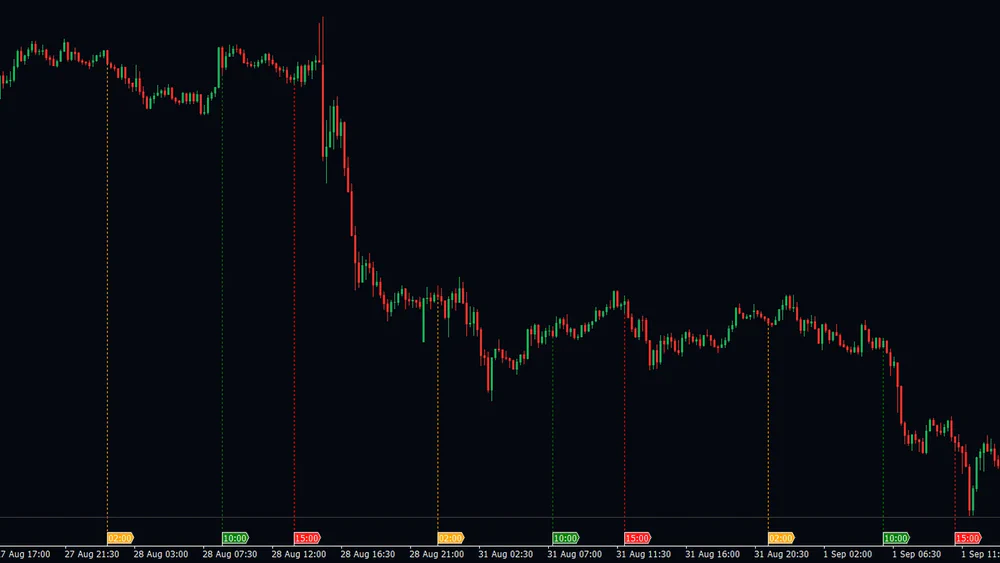
Each open is worked out in its own city and then shown in your broker’s clock, so the markers along the bottom show the hour in the clock your chart already uses.
No counting hours in your head at the start of a session, and no mental arithmetic that goes wrong the one time it matters.
Puts Five Weekdays Side By Side
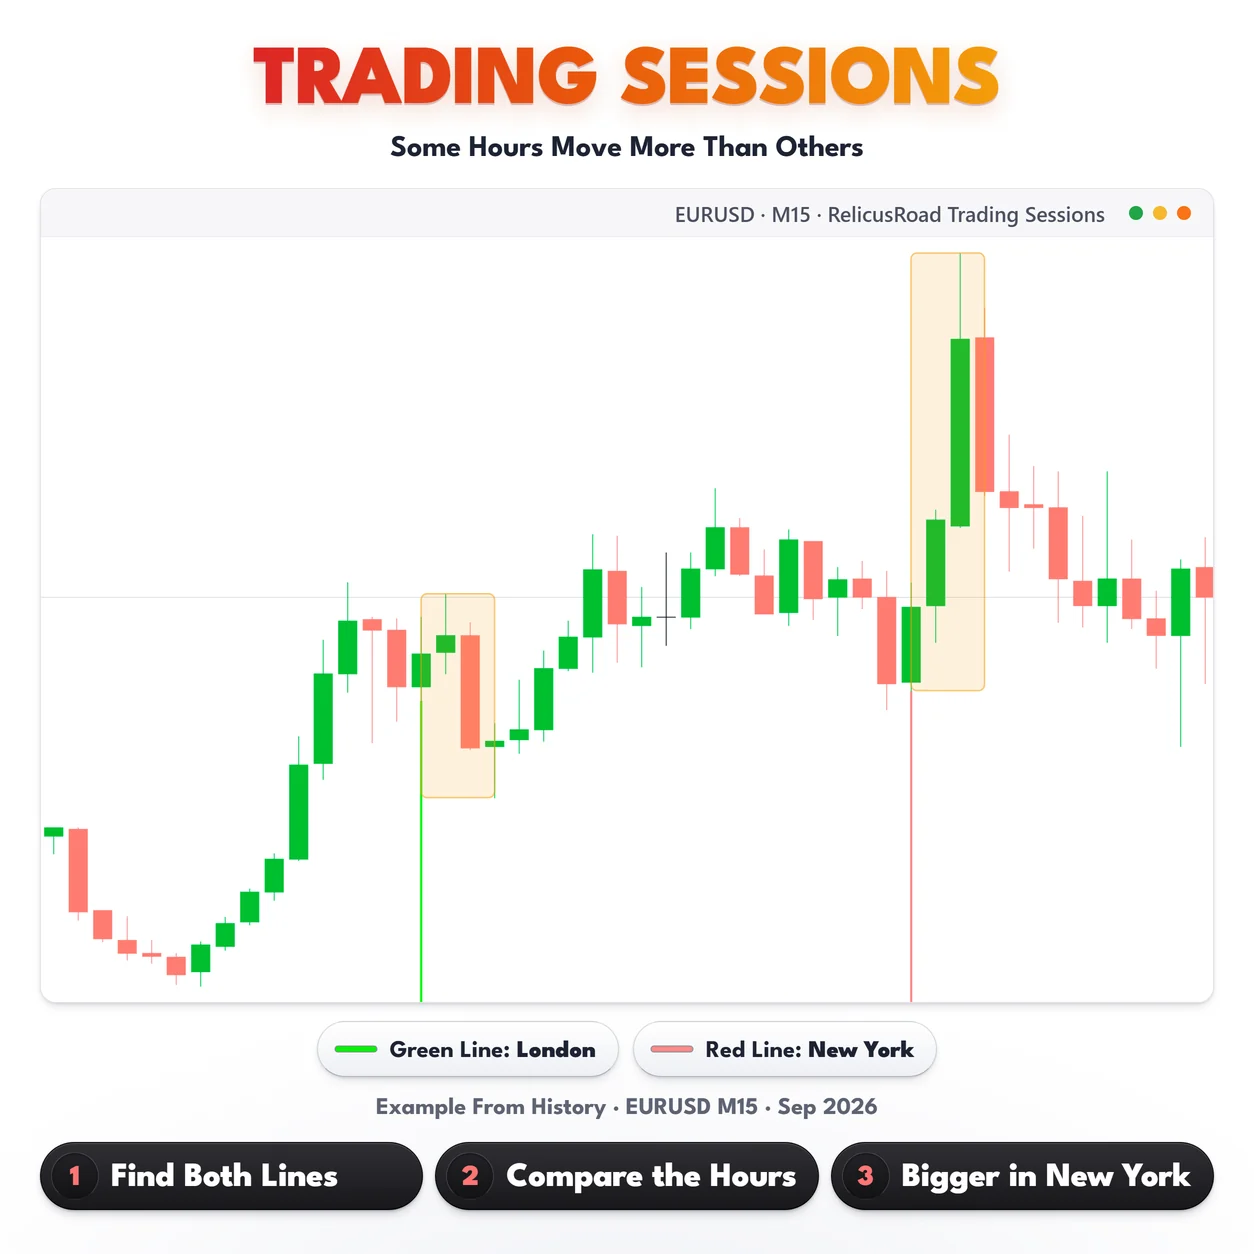
Five weekdays are drawn by default, weekends skipped, so the same three opens repeat across the screen at the same hours.
That is where the useful reading lives. If this symbol moves on the London open three days out of five, you can see it on one chart instead of remembering it.
Shows The Next Open Ahead
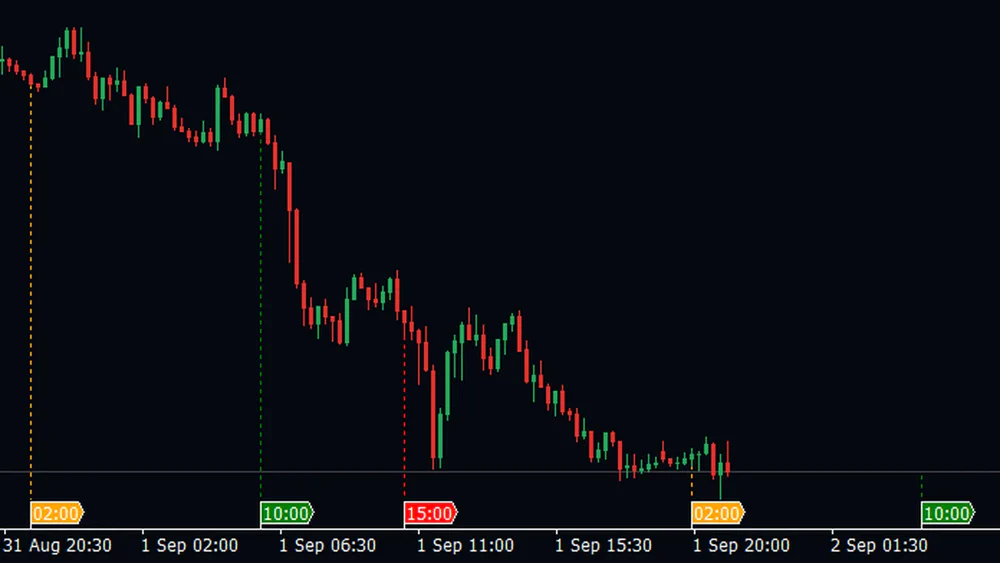
A session that has not opened yet still gets its line, standing to the right of the newest bar, so you can see how long you have before the next one arrives.
When London or New York changes its clocks, the next morning’s line is already at the new time.
Reading It On A Live Chart
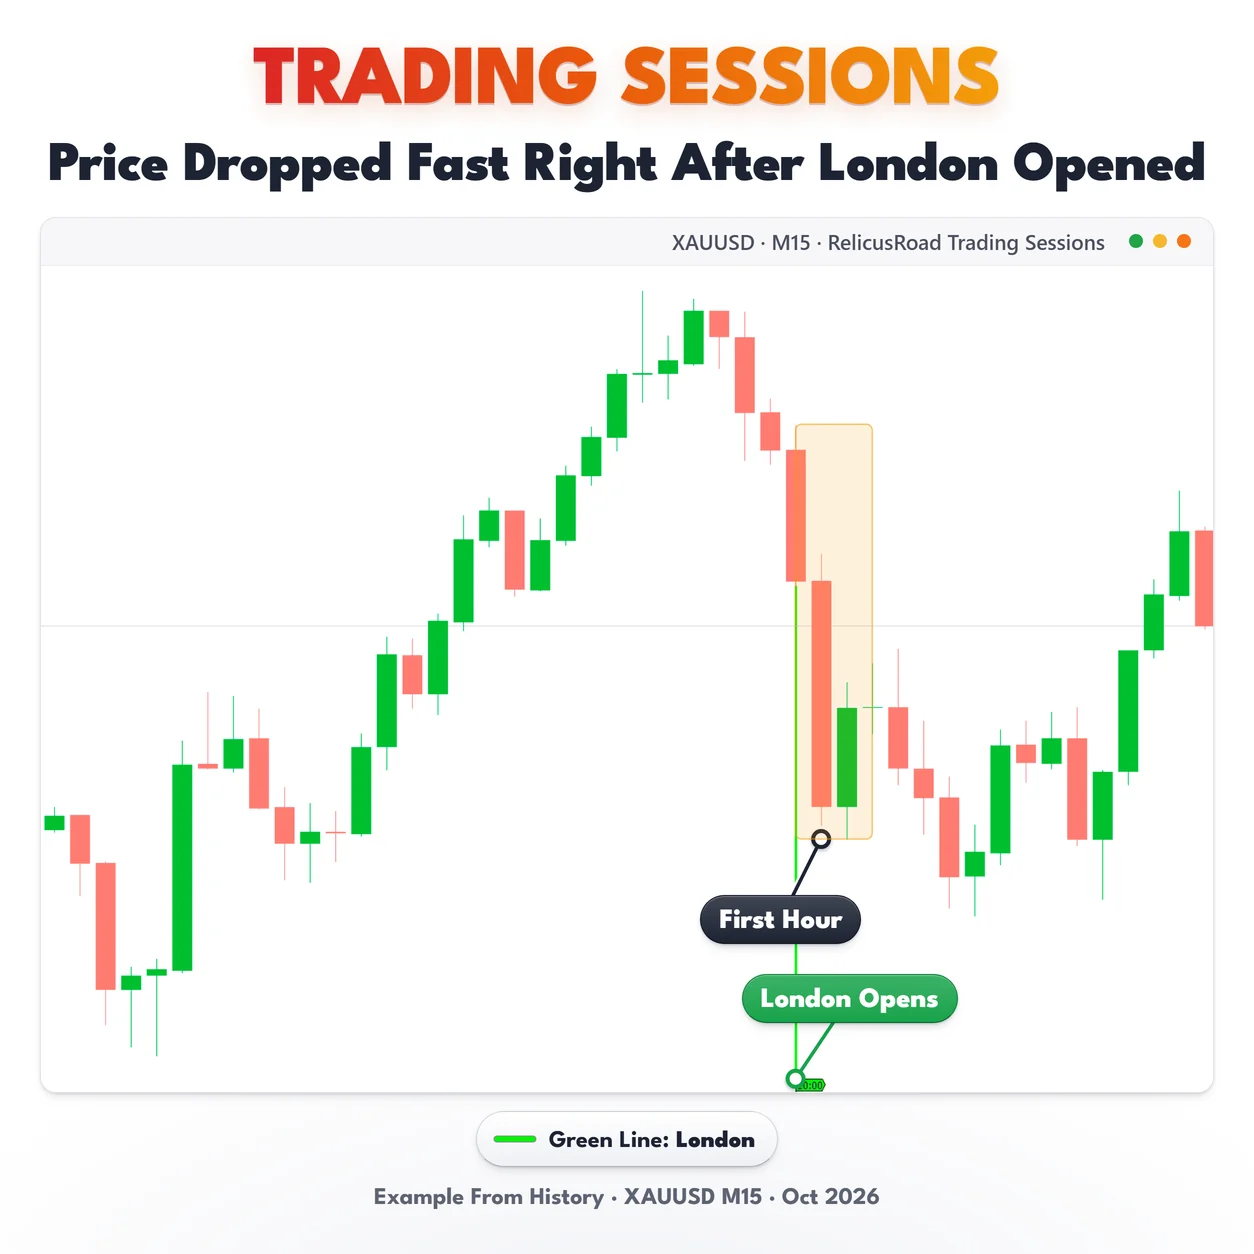
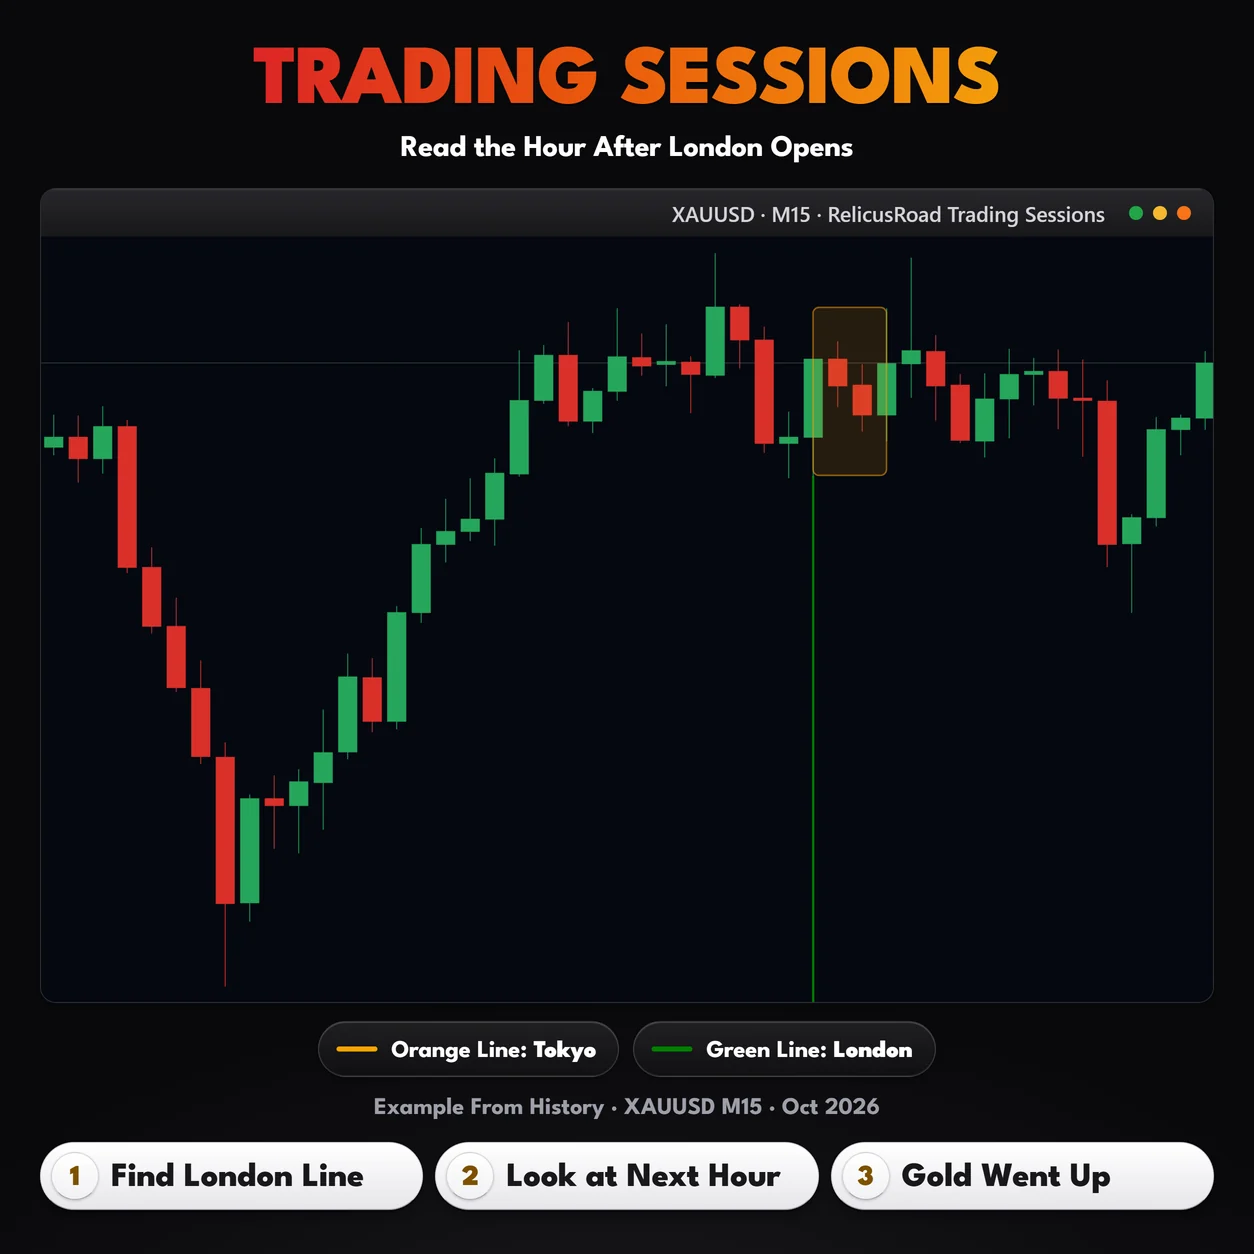
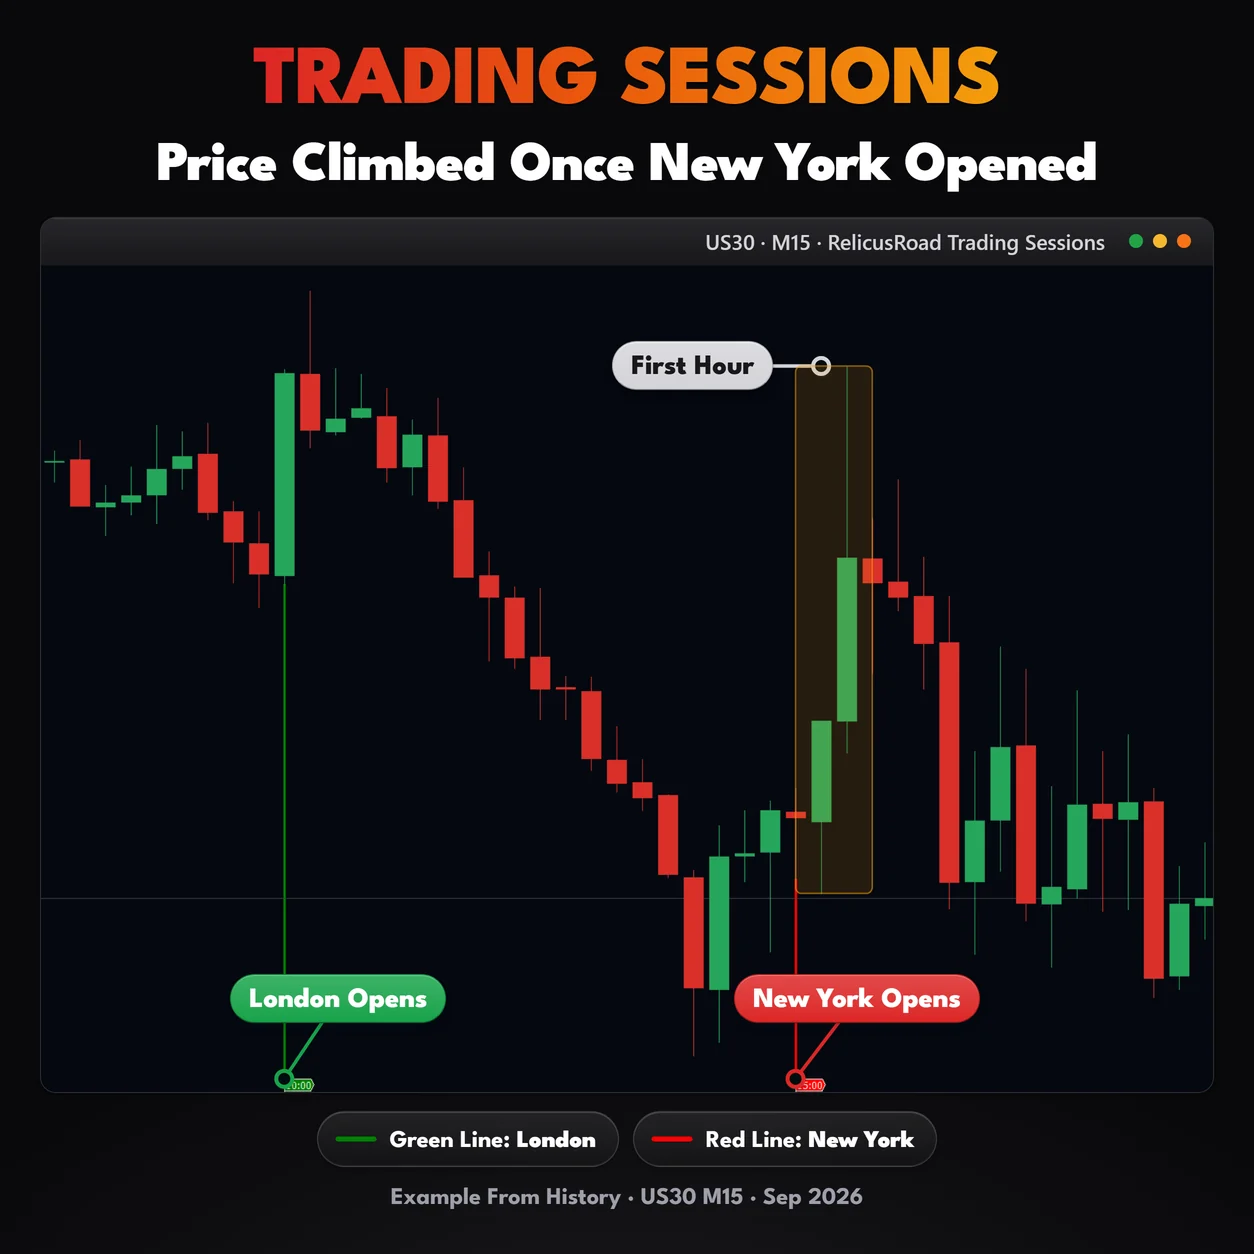
The clearest use is comparing days. Put five weekdays on an M15 chart and look at what price did in the hour after each London line. Some symbols move on the open almost every day, and others only do it when the New York line follows. You learn more from the pattern than from any single day.
The second use is simpler. A quiet range that has been going nowhere means something different at 04:00 server time than it does two bars before the London line, and the line saves you the mental arithmetic every time.
Traders who mark yesterday’s extremes often want to know which session made them.
RelicusRoad Daily High Low draws those two prices, and the
session lines tell you where in the day they happened.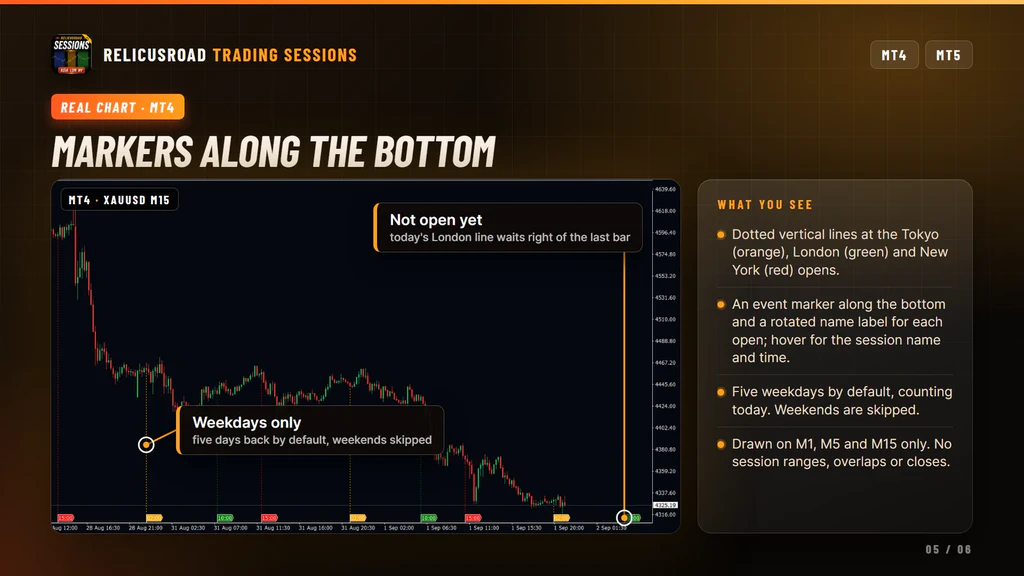
Settings You Can Change
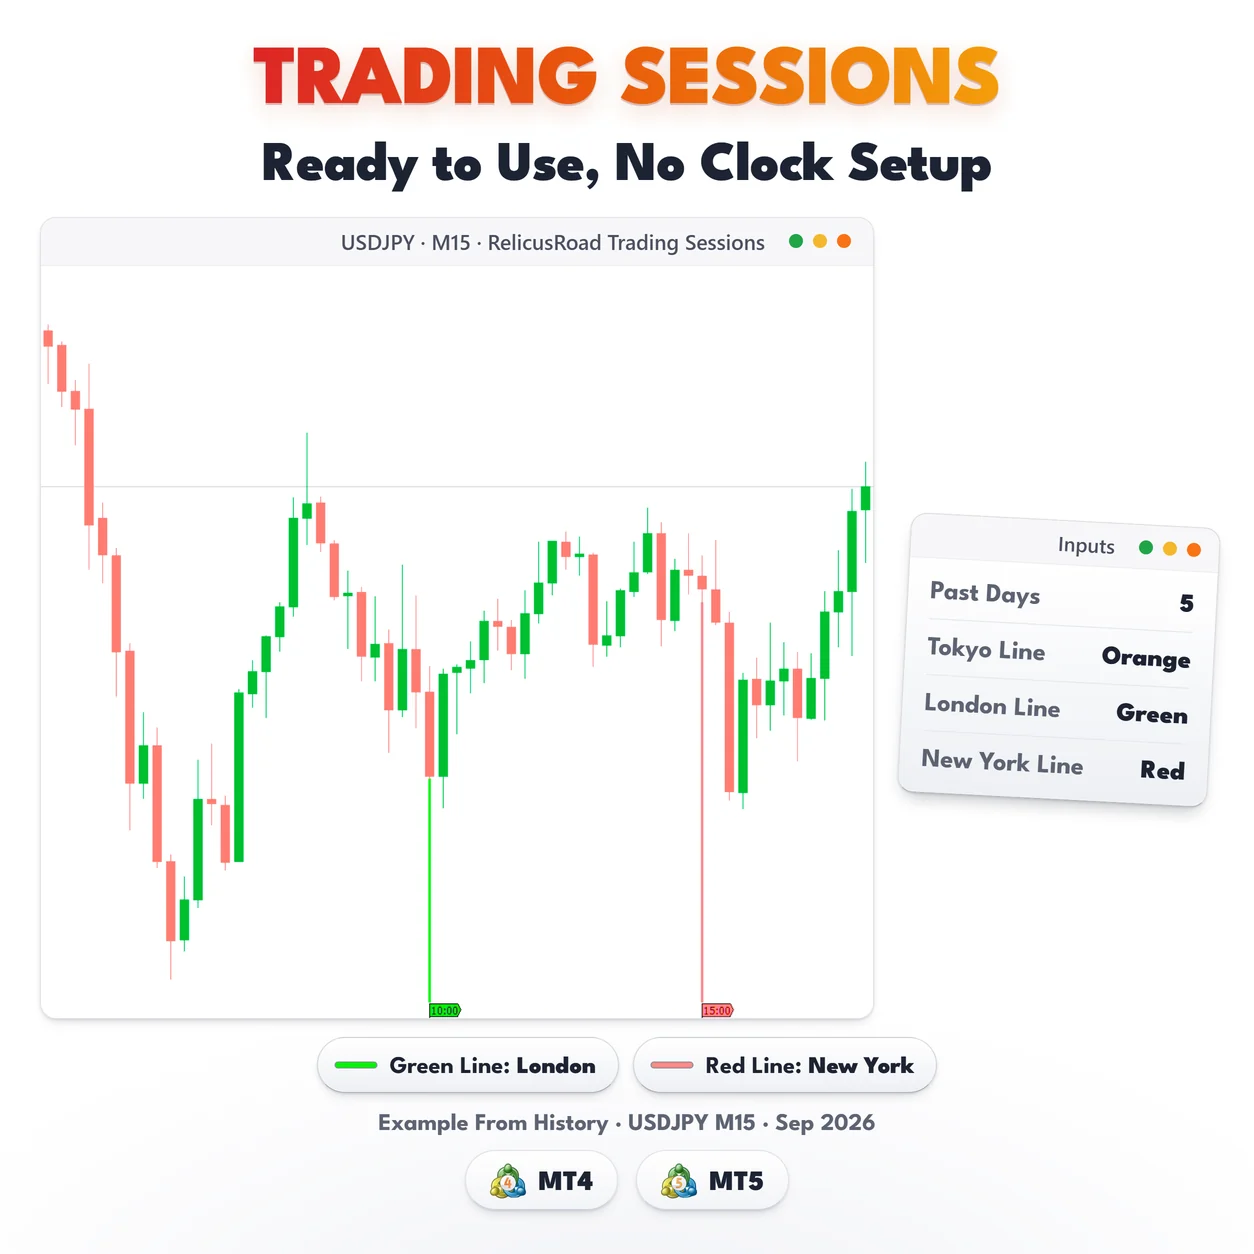
Which sessions and how many days. Show Tokyo, Show London and Show New York each toggle one session on or off. Past Days sets how many weekdays are drawn, 5 by default, counting the current day. Raise it to study a longer stretch, or drop it to 1 or 2 to keep the chart clean.
Broker clock. Broker GMT offset is 0 by default, which means automatic. Type a number only if the London line is not at 08:00 London time. To find the number, compare the server time in Market Watch with UTC: the gap in hours is your offset, such as 2 or 3. A typed number is used as it is, so change it if your broker changes its clock. The city summer and winter times are still handled for you.
Names. Name - Tokyo, Name - London and Name - New York set the text in each label and tooltip. If you think of the green line as the Frankfurt open, or you want the sessions written in your own language, this is where you change it.
Appearance. Tokyo Line Color, London Line Color and New York Line Color are orange, green and red by default, and each color is used for that session’s line, label and marker. The three Line Size inputs set line width, 0 by default, which is the thinnest line the platform draws.
What It Does Not Do
Worth knowing before you install:
- It does not mark session closes, ranges, highs, lows or overlaps. Opens only.
- It does not draw on M30, H1 or any higher timeframe.
- It does not send alerts in this build.
- It does not draw price levels. For session-anchored prices see RelicusRoad Daily Pivots.
Setup In Three Steps
- Buy it on the MQL5 Market and install it from the Market tab of your terminal.
- Drag RelicusRoad Trading Sessions from Navigator, Indicators, Market onto an M1, M5 or M15 chart.
- Set Past Days and the colors to taste. The times need no setup.
It runs on forex, gold, indices and crypto. Keep it on the short timeframes it was built for.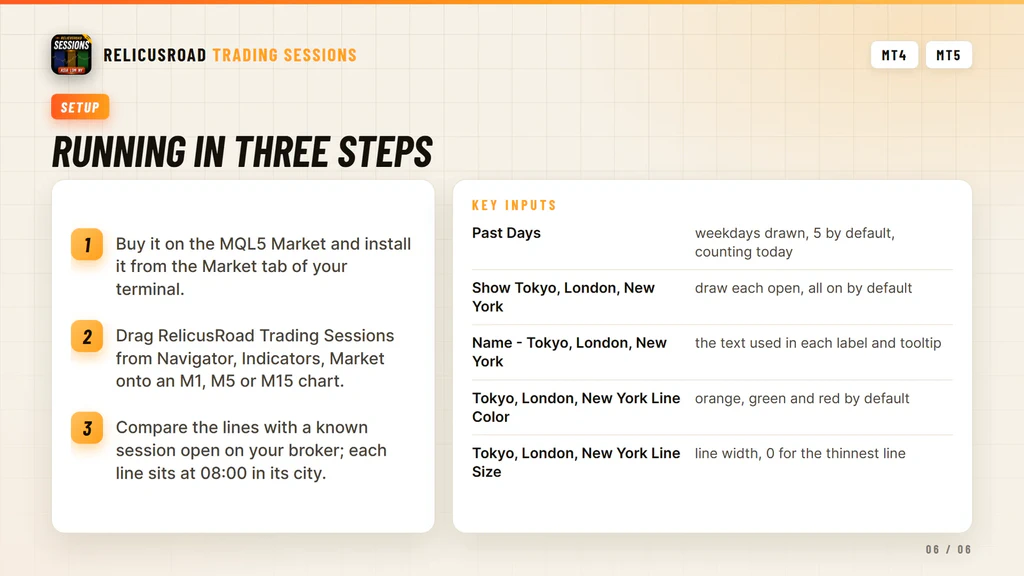
Where It Comes From
The session map is the timing layer of RelicusRoad Pro, published on its own as a light background overlay for intraday charts. It runs standalone and needs no other RelicusRoad product.
Support runs through the product comments and the mql5.com messaging system.
Frequently Asked Questions
Everything you need to know about RelicusRoad Trading Sessions. Still curious? Reach out anytime.
Learn How to Trade It
Every indicator ships with reference documentation and a matching strategy guide. You can also read what other traders say or start with the setup guide.
Indicator Reference
- Road Levels Dynamic S/R levels around a moving center line
- Support & Resistance Advanced S/R zones with alerts
- Action Levels Critical price levels for major moves
- Signal Lines Trend bias filter with two independent lines
- Daily High/Low/Open Daily extremes for range trading
- Daily Pivots Pro pivot points S1-S3, R1-R3
Trading Strategies
- Strategy #1: Price Action (Road) + SR + Trendlines + 2 TFs
- Strategy #2: Local Trendline + Price Position on Road + 2 TFs
- Strategy #3: Arrows + Price Action (Road) + SR
- Strategy #4: MicroScalping + Multiple Pairs + Daily Target 2-10%
Trading Guides
- Non-Repaint Forex Indicators: What 'Non-Repaint' Actually Means (and How to Verify It)
- Prop Firm Challenges: The 'Slow Boring' Strategy to Getting Funded
- Market Sessions Trading: How to Time the 'London-NY Overlap'
- What Is Forex Trading and How Does It Work?
- The Real Cost of Trading Platforms in 2026: A Broker-Neutral Teardown
- Position Sizing: The Boring Math That Keeps Traders Alive
- Forex Trading Psychology: 7 Traps and Process Fixes
Related tools
Single RelicusRoad indicators for MT4 and MT5, each one standalone.



