
What It Does
Drawing a trendline by hand takes two swing points and an opinion. Which two you pick changes the line, and the line you drew last week is often no longer the one that matters.
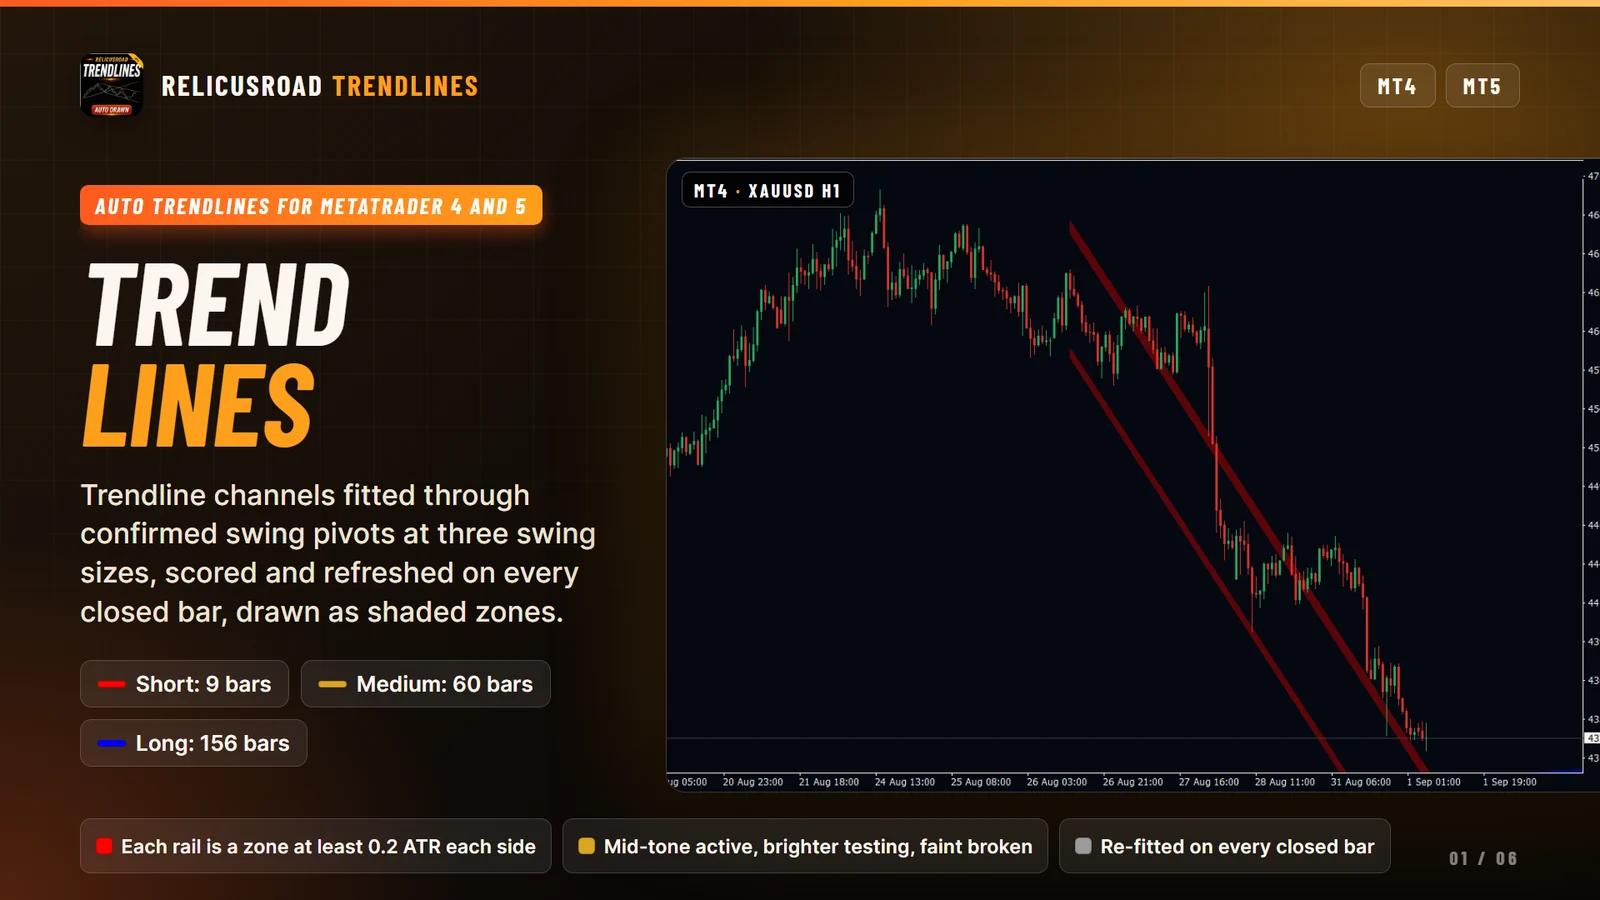
RelicusRoad Trendlines does the picking and the redrawing. It confirms swing pivots at three swing sizes, fits lines through them, pairs high lines with low lines into channels, and keeps the two or three channels that matter most to the current price. Every rail is drawn as a shaded band rather than a hairline, because price turns in areas and not at exact prices.
There is also a grey checkerboard box on one rail at a time, mapping a reference entry, stop and
target so you can see the shape of the setup at a glance.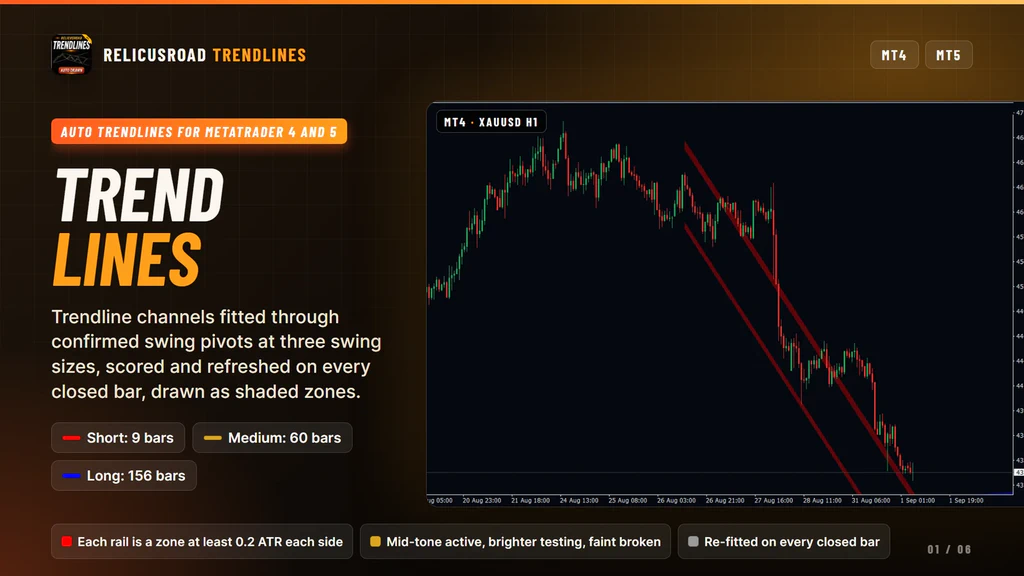
How It Works
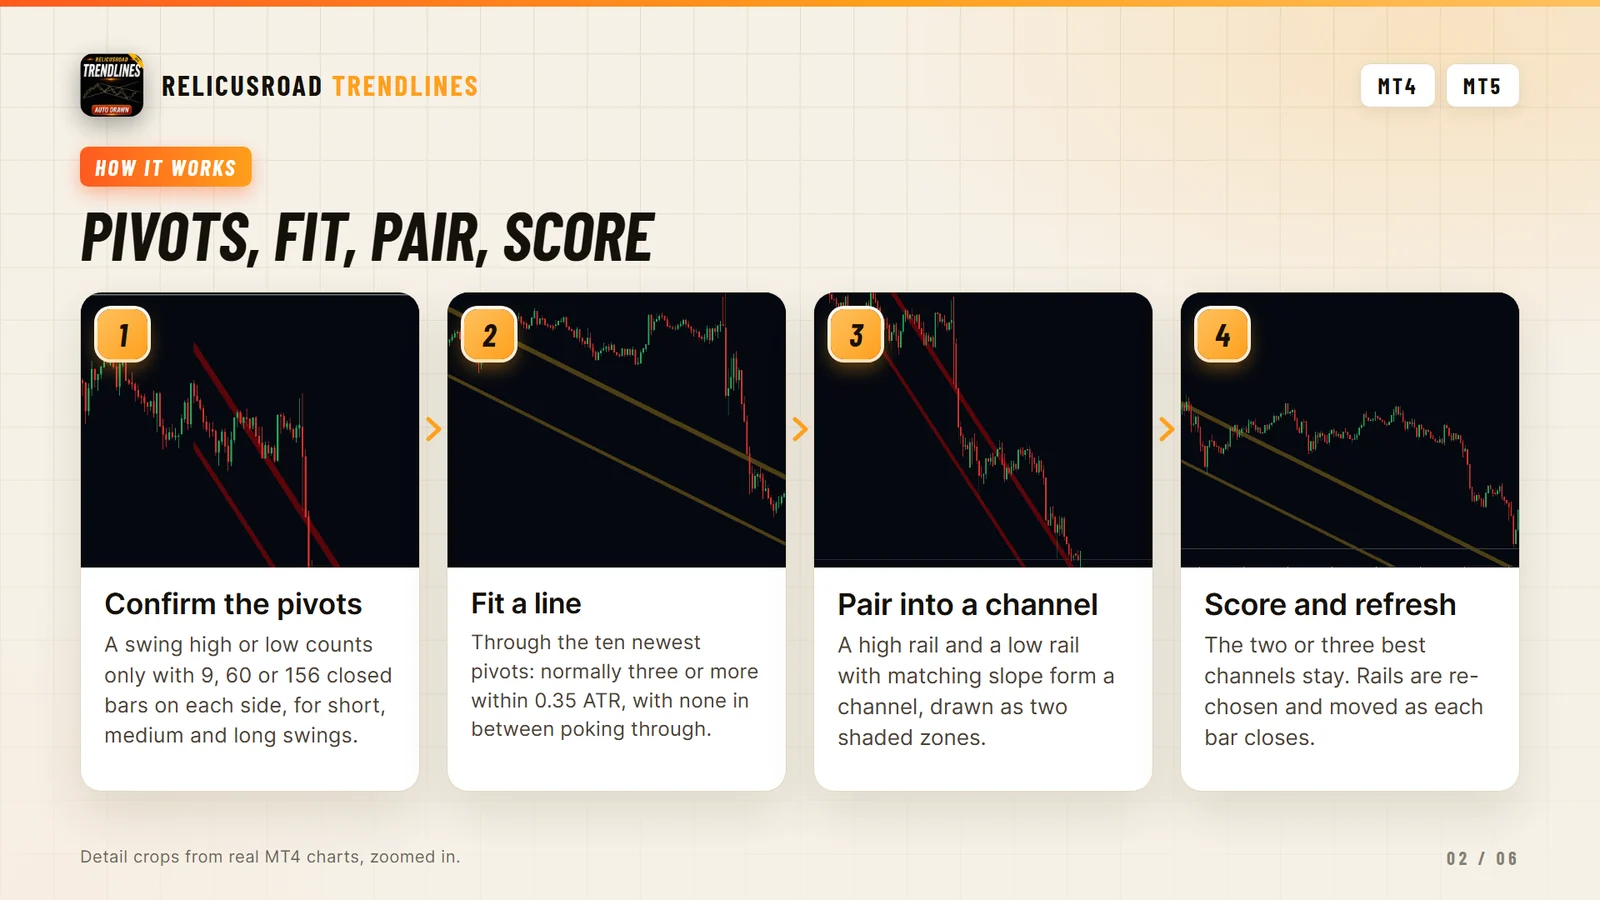
Confirmed pivots. A pivot is a bar that tops or bottoms its window, with a set number of closed bars on each side: 9 for short swings, 60 for medium and 156 for long. Nothing is counted until those bars have closed, so a long pivot is confirmed 156 bars after it printed.
Fitting. Pairs of pivots seed a line, and other pivots within 0.35 ATR join it. The line is then refitted as a weighted least-squares line through its members, which is why it does not pass exactly through any single high. A fit normally needs three pivots, and it is rejected if the line is too short, if the pivots sit too far off it, if the slope is too flat or too steep, or if an inner pivot pokes through it.
Channels. A high rail and a low rail are paired when they overlap by at least half their length, their width sits in a sensible range and the pair is within 4 ATR of price. That gives you parallel, converging and diverging shapes.
Scoring. Each rail is scored from its distance to price, its age, how often price has touched or
been rejected by it, and its current state. Channels are drawn in score order, and a new line
replaces the one on the chart only when it scores clearly higher or sits noticeably closer to price.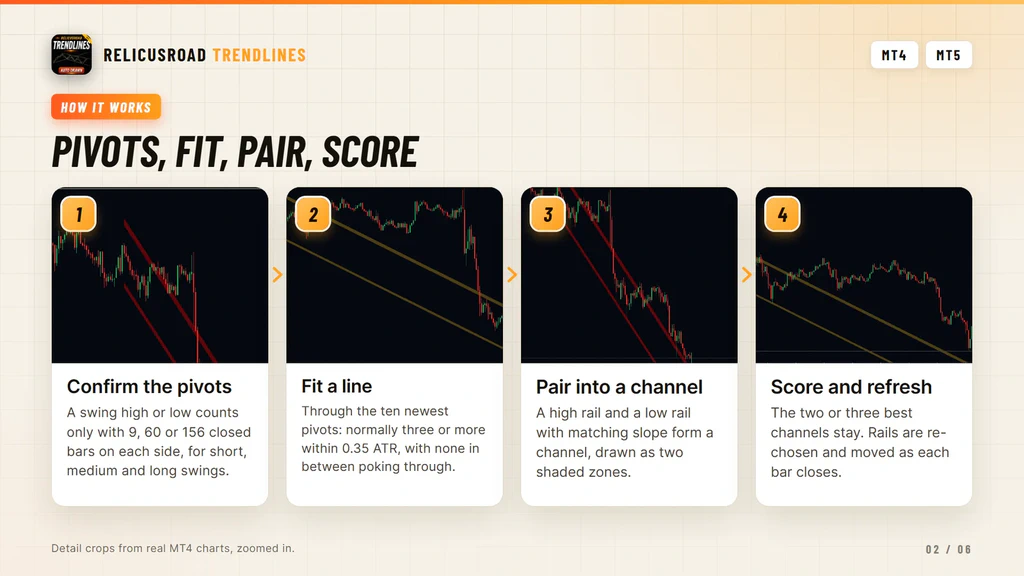
The Rails Are Re-Chosen Every Bar
Be clear about this before you buy, because it decides whether the tool suits you.
The pivots behind a line never change once they are confirmed. The lines on your chart do. When a bar closes, the model rebuilds, re-scores the candidates and moves the drawn rails to their new anchors. Past drawings are replaced rather than archived.
In practice a rail you were watching yesterday can shift by a few points, swap to a better fit, or disappear when a different channel scores higher. On a quiet chart where nothing passes the fit checks, you can also see no rails at all, which is the honest answer rather than a forced line through two random highs.
If you want to review a setup later, take a screenshot. The indicator always describes the latest
closed bar.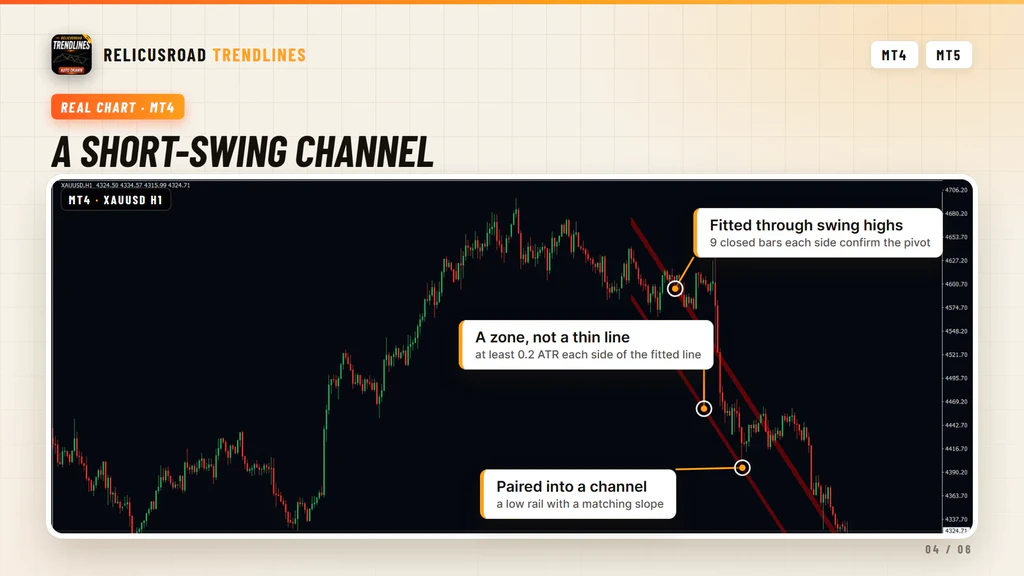
What You See On The Chart
| Element | What it tells you |
|---|---|
| Red band | A rail from the short swing size, 9 closed bars each side |
| Goldenrod band | A rail from the medium swing size, 60 bars each side |
| Blue band | A rail from the long swing size, 156 bars each side |
| Band width | At least 0.2 ATR on each side of the fitted line, never a hairline |
| Brightness | Bright is testing or retesting now, mid-tone is active, faint is broken or reclaimed |
| Dotted faint band | A developing short-swing channel that is still forming |
| Grey checkerboard | The reward area and the risk area of the current reference plan |
- Red band
- A rail from the short swing size, 9 closed bars each side
- Goldenrod band
- A rail from the medium swing size, 60 bars each side
- Blue band
- A rail from the long swing size, 156 bars each side
- Band width
- At least 0.2 ATR on each side of the fitted line, never a hairline
- Brightness
- Bright is testing or retesting now, mid-tone is active, faint is broken or reclaimed
- Dotted faint band
- A developing short-swing channel that is still forming
- Grey checkerboard
- The reward area and the risk area of the current reference plan
Colors show which swing size a rail came from, not its direction. The highs and lows of a scale share
one color.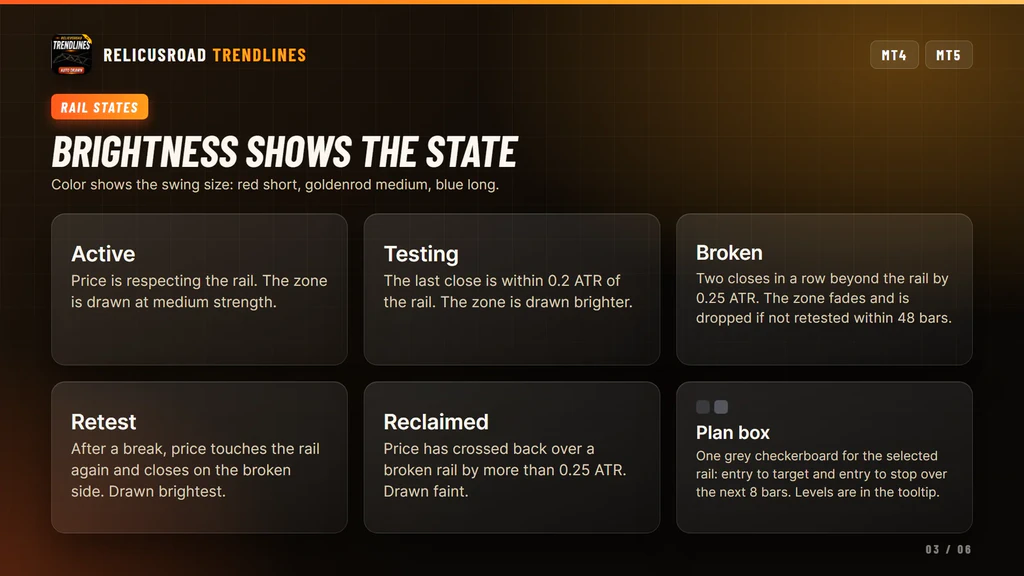
What It Does For Your Trading
Four things, each one you can check on a real chart before you trust it.
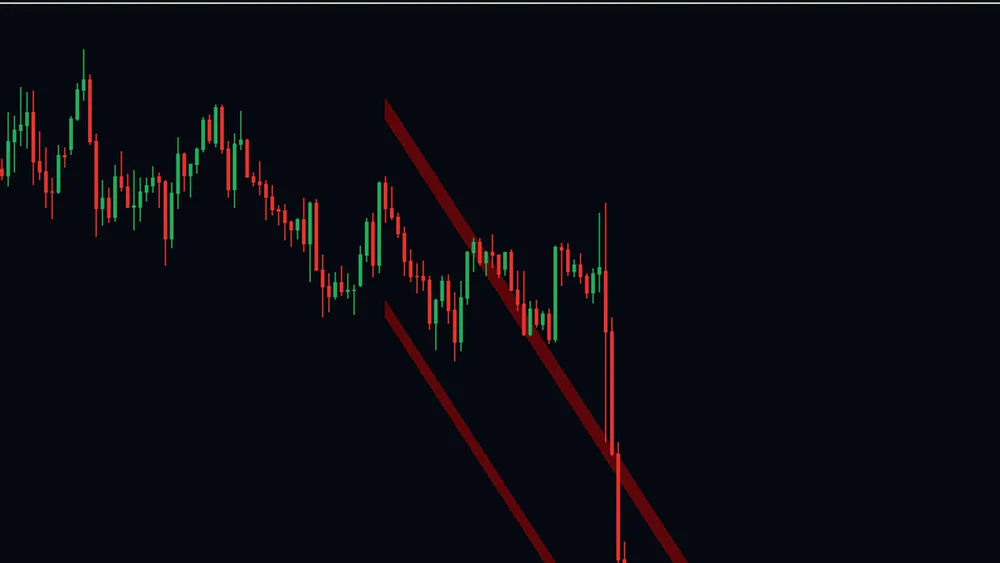
Draws The Channel You Would Have Drawn
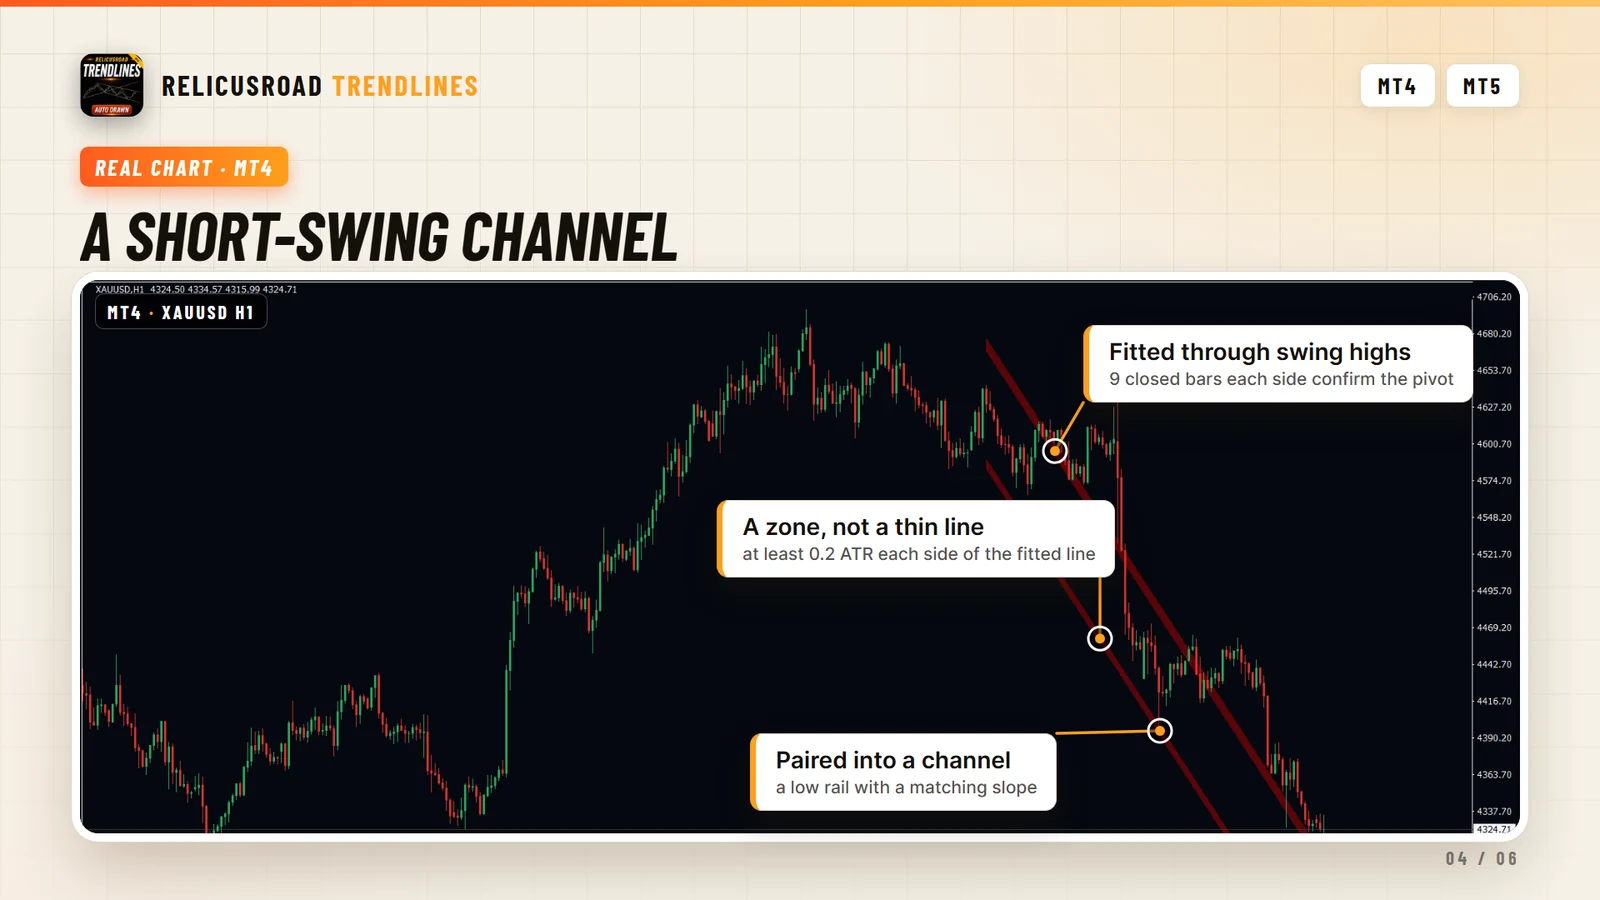
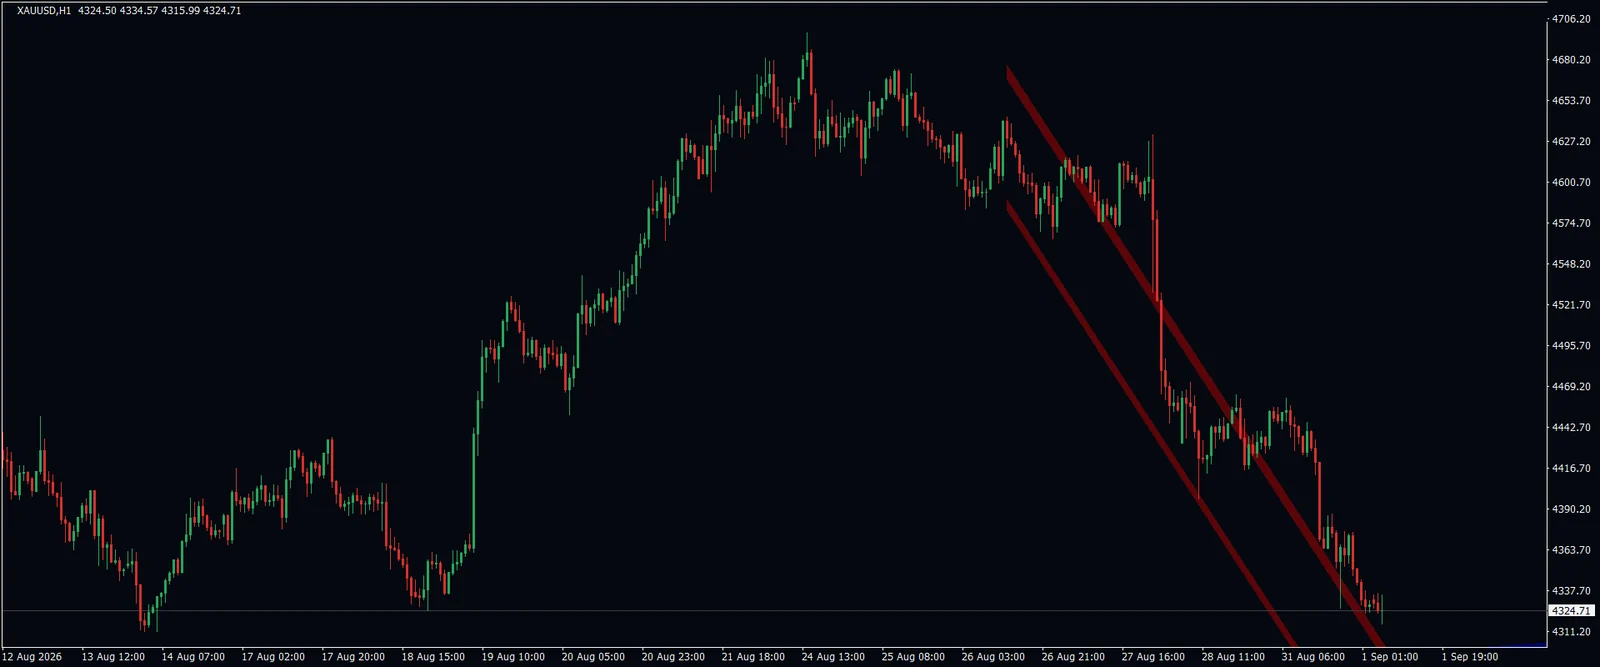
The rails come from swing pivots that are confirmed by closed bars, 9 on each side for the short scale. A line needs several of those pivots sitting close to it before it is drawn at all, so the channel on your chart is the one the swings support.
No more dragging a line between two highs, deleting it, and trying two others. The line that fits the swings is already there when you open the chart.
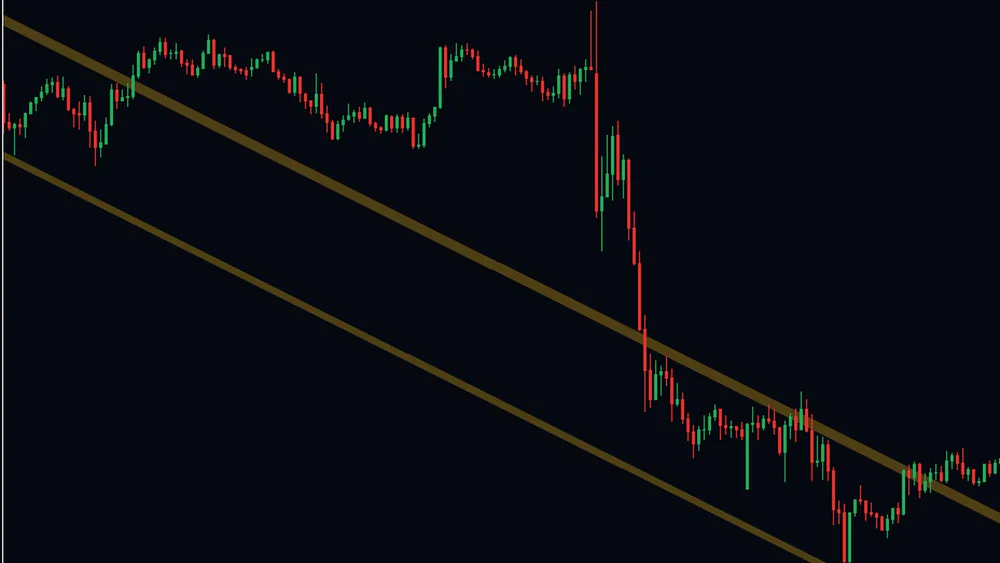
Marks The Rail Price Is Riding
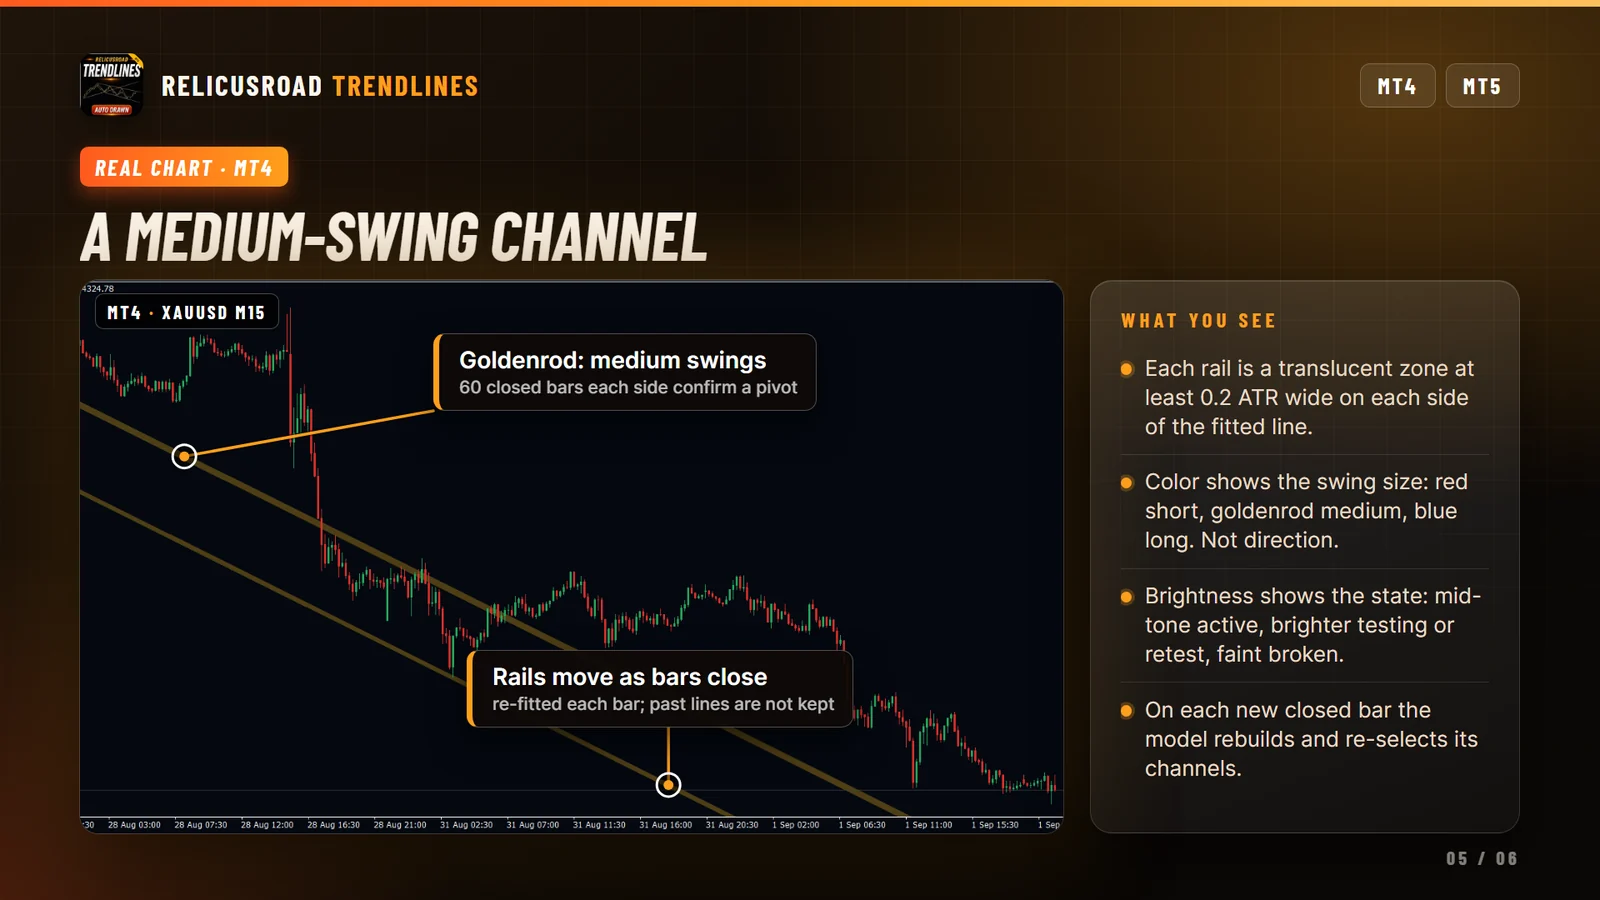
Each rail is a shaded band, at least 0.2 ATR wide on each side of the fitted line, because price turns in an area rather than at one exact price. Here the candles keep touching the upper goldenrod rail on the way down.
That width is the difference between a stop that survives a normal test of the line and one that gets clipped by the wick that tests it.
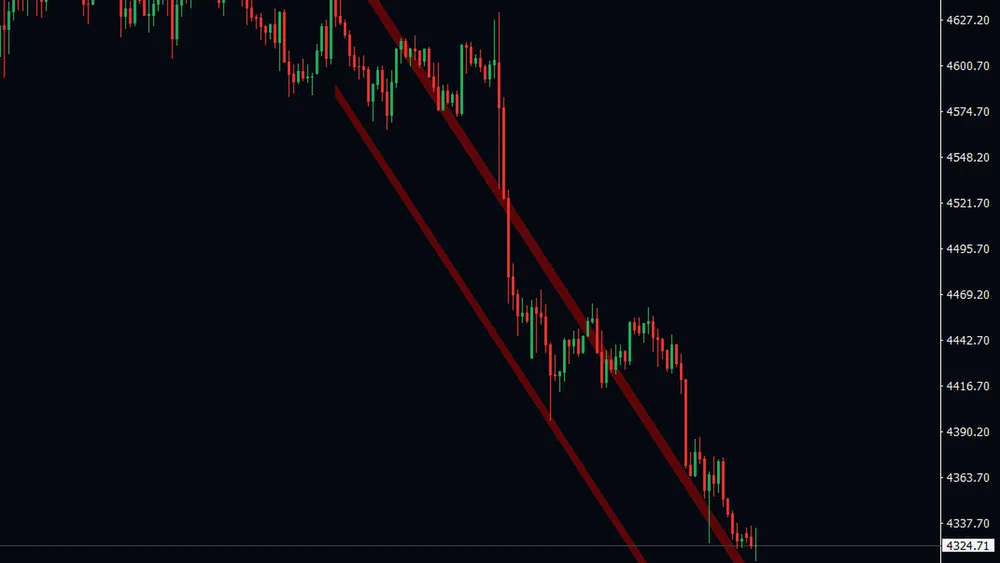
Gives You Both Rails At Once
A high rail and a low rail are paired into a channel when their slopes match and they overlap enough of each other. You get the boundary that has been holding price and the one on the other side of the move in the same drawing.
That pair is what a target is measured against. Selling at the upper rail with the lower rail as the objective is a plan you can read off the screen.
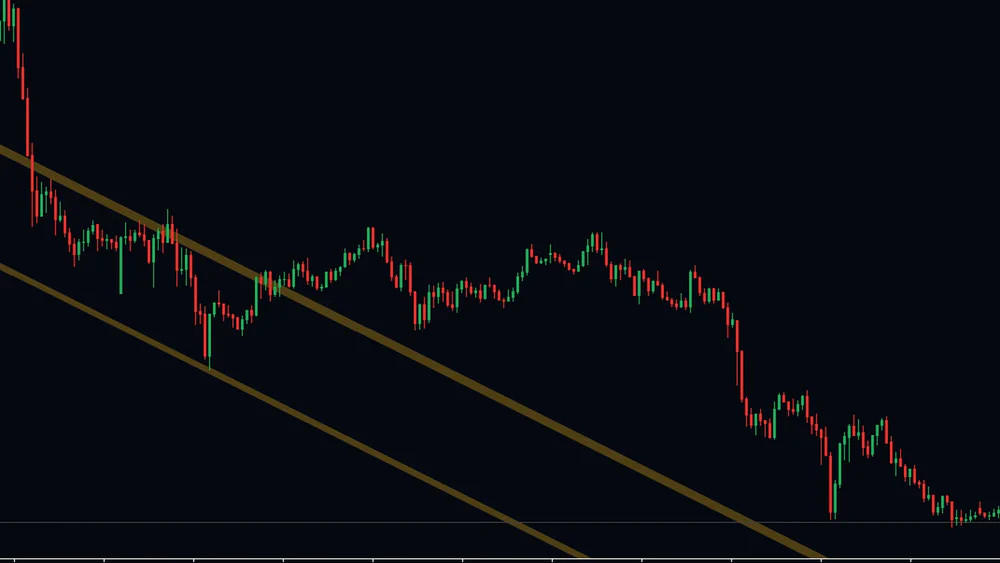
Updates Itself As Bars Close
On each closed bar the model refits, re-scores the candidates and moves the drawn rails. Old drawings are replaced rather than kept, and when nothing passes the fit checks the chart is left clean.
You never work from a line you drew three weeks ago and forgot to question. The trade-off is that the picture is always the current one, so take a screenshot when you want to review a setup later.
Reading It On A Live Chart
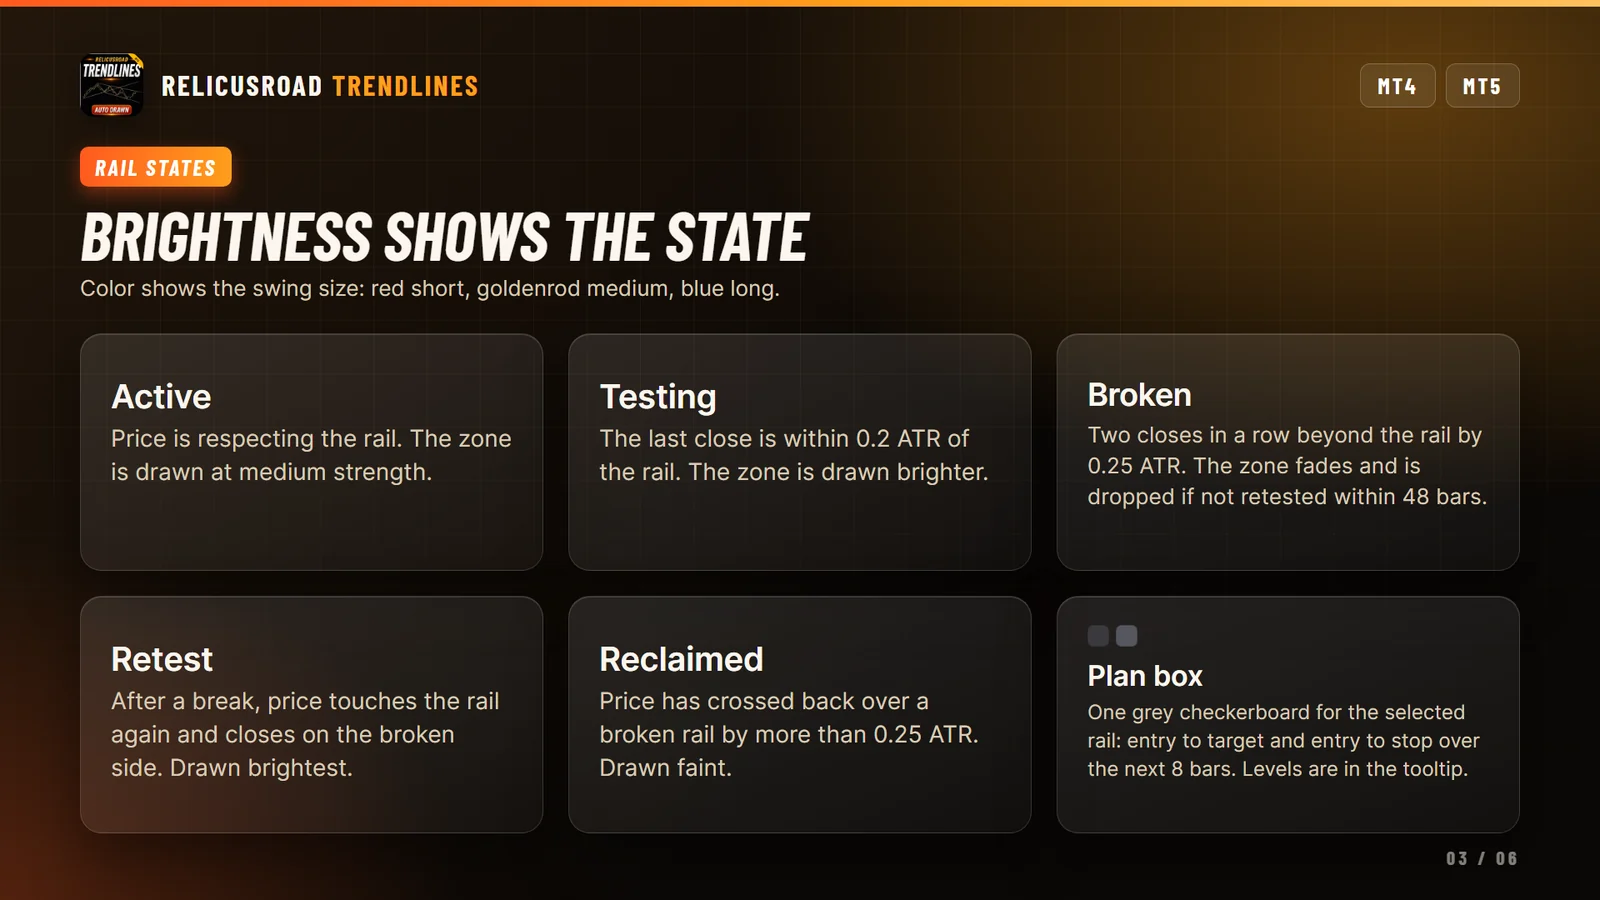
Start with the color and the brightness. A bright goldenrod band means price is at a medium-swing rail right now. A faint one means that rail has already been broken, and the fade is there so a stale line does not shout as loudly as a live one.
A break needs two closes beyond the rail by 0.25 ATR, so a single spike through a band does not change its state. After a break, price coming back to the rail and closing on the broken side is marked as a retest, which is the brightest state of all.
The plan box covers one rail at a time. An active upper rail gives a short plan, an active lower rail
a long plan, with the stop set beyond the zone and the target at the opposite rail. Hover it and the
tooltip gives you the direction and the levels. Nothing is printed on the chart, so the candles stay
readable.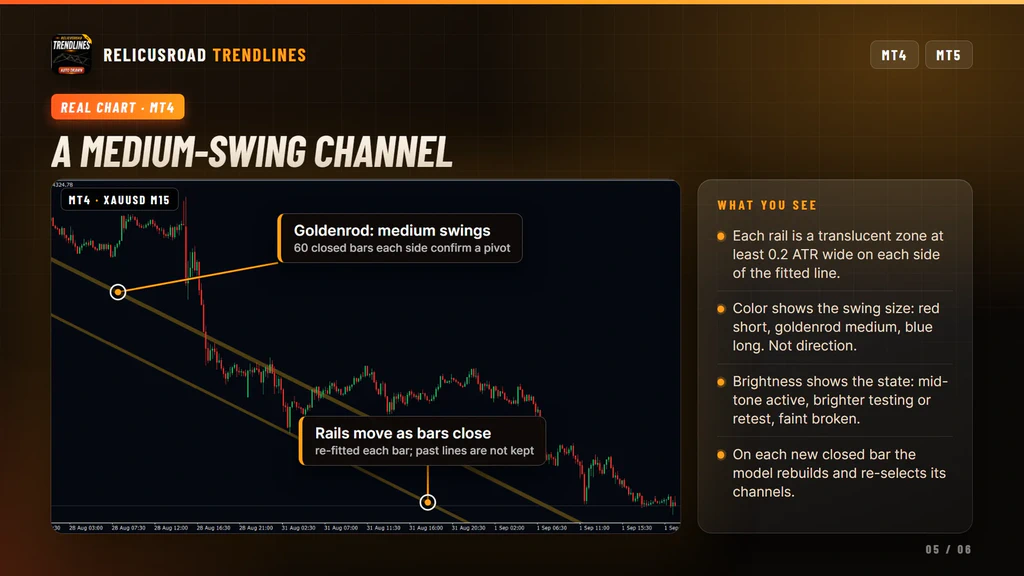
Settings You Can Change
The inputs window lists these under their internal names, which is how the build ships.
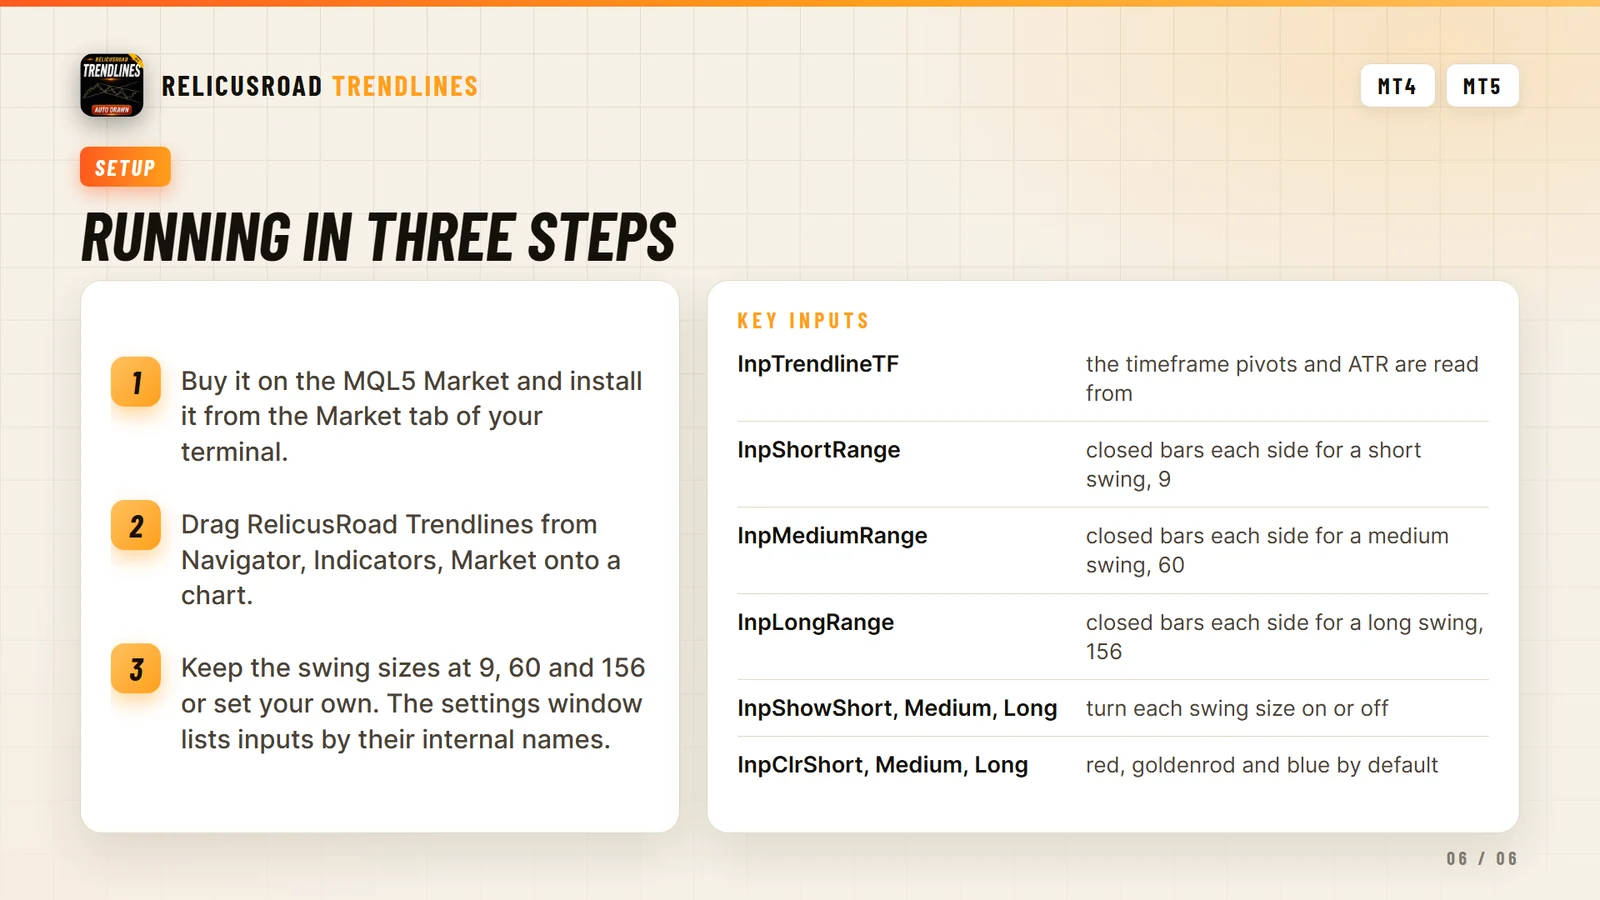
Swing detection. InpTrendlineTF, the timeframe pivots and ATR are read from. InpShortRange, InpMediumRange and InpLongRange, the closed bars on each side for each swing size, 9, 60 and 156 by default.
Display. InpShowShort, InpShowMedium and InpShowLong, one switch per swing size, all on. InpClrShort, InpClrMedium and InpClrLong, the three colors, red, goldenrod and blue.
Turning a swing size off is the quickest way to calm a busy chart. If you trade intraday and never act on a 156-bar swing, switch the long rails off and keep the short and medium ones.
What It Does Not Do
Worth knowing before you buy:
- It does not send alerts. This build has no alert input and produces no alert.
- It does not label the pivots, even though two pivot label inputs appear in the list.
- It does not keep its past drawings. Rails are re-selected each bar and moved, so this is not a non-repainting drawing tool.
- It does not read several timeframes at once. You pick one, and the three scales are three swing sizes on that timeframe.
- It does not use the width and style inputs while zones are on, and the history and chunk size inputs do nothing in the default engine.
- It does not print entry, stop or target on the chart. Those live in the plan box tooltip.
- It does not always find a channel. When no fit passes the checks, the chart stays clean.
Setup In Three Steps
- Buy it on the MQL5 Market and install it from the Market tab of your terminal.
- Drag RelicusRoad Trendlines from Navigator, Indicators, Market onto a chart. H1 and above suits the long swing size, which needs 156 closed bars on each side.
- Turn off any swing size you do not trade, and set InpTrendlineTF if you want pivots from a higher timeframe.
It runs on forex, gold, indices, stocks and crypto. The model rebuilds when a bar closes, so give the
chart a bar or two after attaching it.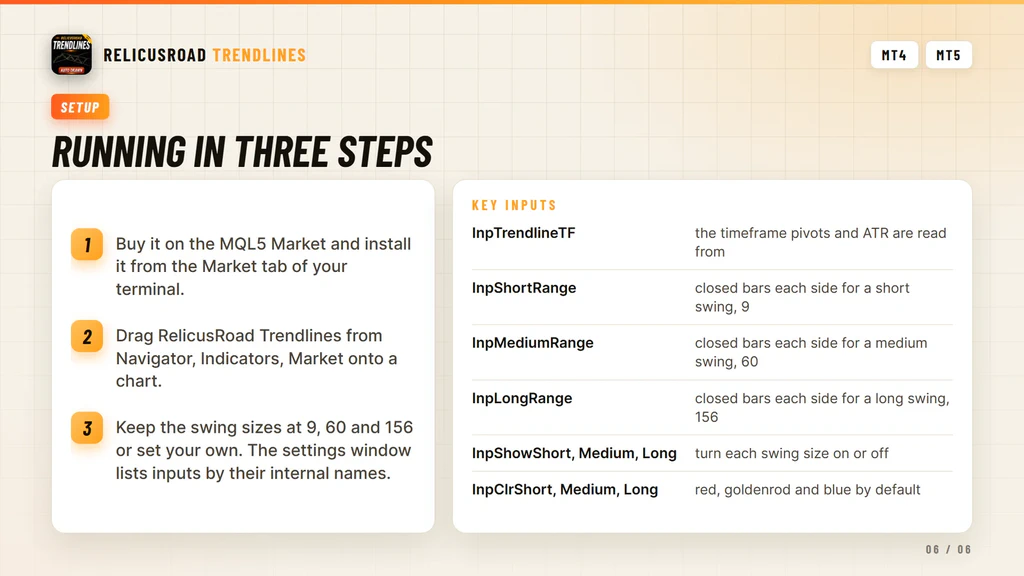
Where It Comes From
Automatic trendline fitting is the drawing engine from RelicusRoad Pro, published alone for traders who want their channels found and updated for them. It runs standalone.
The pivots behind these lines are the same kind of confirmed swings that RelicusRoad Fractals marks with arrows. For the horizontal version of the same structure, graded by how often price tested it, see Support Resistance.
Support runs through the product comments and the mql5.com messaging system.
Frequently Asked Questions
Everything you need to know about RelicusRoad Trendlines. Still curious? Reach out anytime.
Learn How to Trade It
Every indicator ships with reference documentation and a matching strategy guide. You can also read what other traders say or start with the setup guide.
Indicator Reference
- Road Levels Dynamic S/R levels around a moving center line
- Support & Resistance Advanced S/R zones with alerts
- Action Levels Critical price levels for major moves
- Signal Lines Trend bias filter with two independent lines
- Daily High/Low/Open Daily extremes for range trading
- Daily Pivots Pro pivot points S1-S3, R1-R3
Trading Strategies
- Strategy #1: Price Action (Road) + SR + Trendlines + 2 TFs
- Strategy #2: Local Trendline + Price Position on Road + 2 TFs
- Strategy #3: Arrows + Price Action (Road) + SR
- Strategy #4: MicroScalping + Multiple Pairs + Daily Target 2-10%
Trading Guides
- Non-Repaint Forex Indicators: What 'Non-Repaint' Actually Means (and How to Verify It)
- Prop Firm Challenges: The 'Slow Boring' Strategy to Getting Funded
- Market Sessions Trading: How to Time the 'London-NY Overlap'
- What Is Forex Trading and How Does It Work?
- The Real Cost of Trading Platforms in 2026: A Broker-Neutral Teardown
- Position Sizing: The Boring Math That Keeps Traders Alive
- Forex Trading Psychology: 7 Traps and Process Fixes
Related tools
Standalone MetaTrader indicators related to this one.



