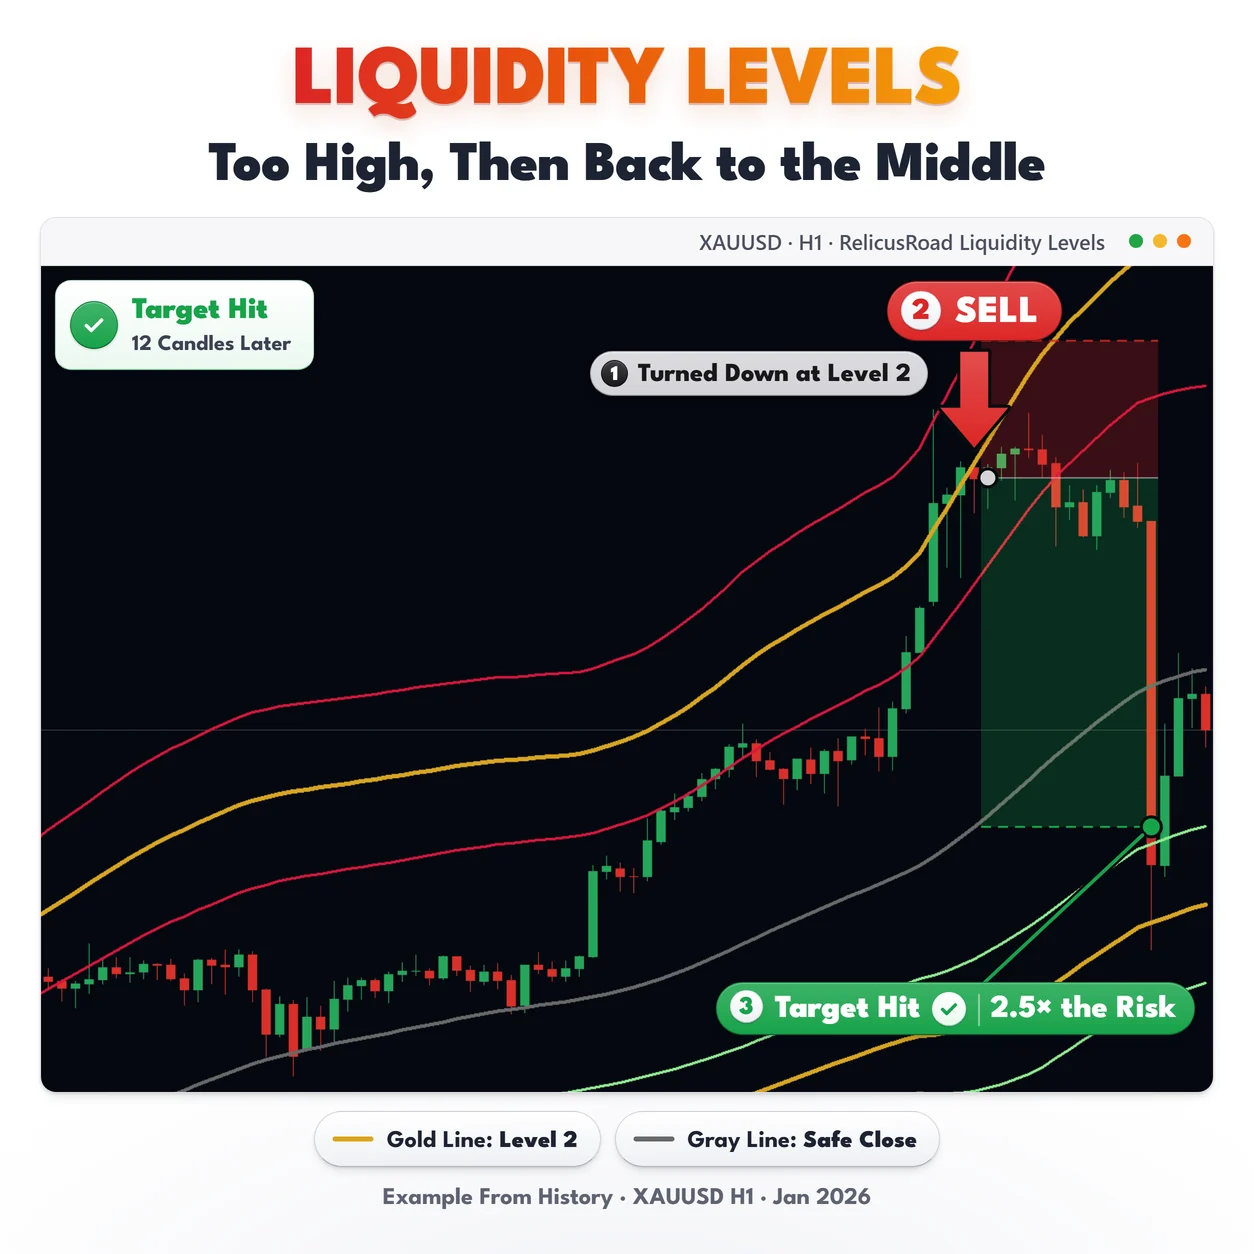
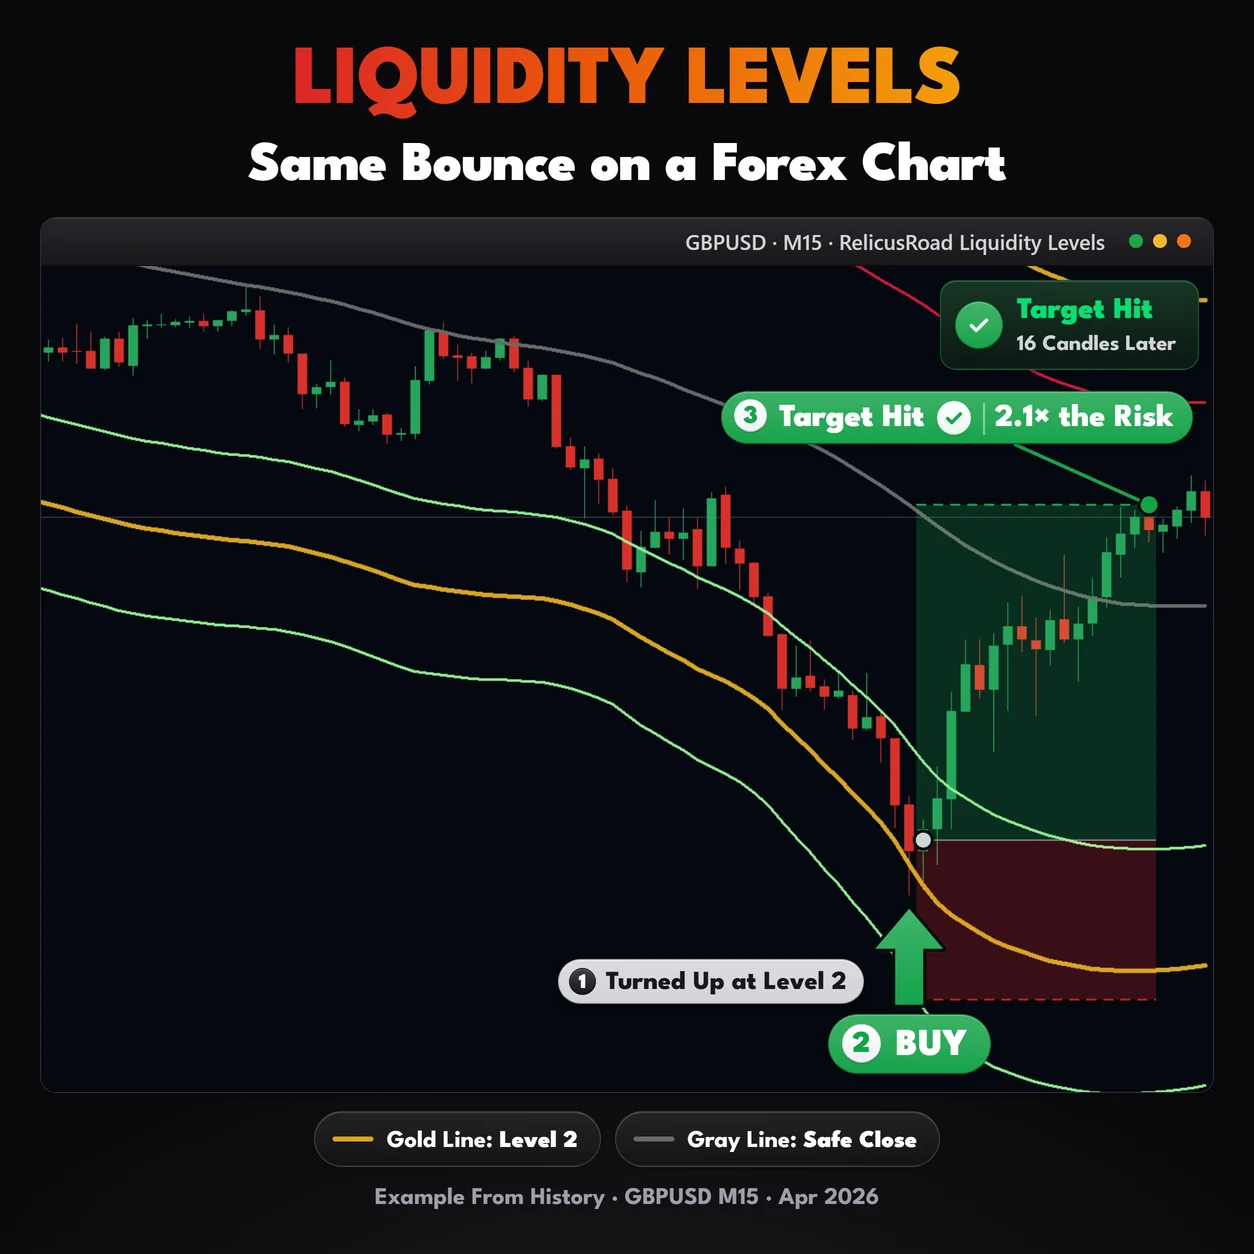
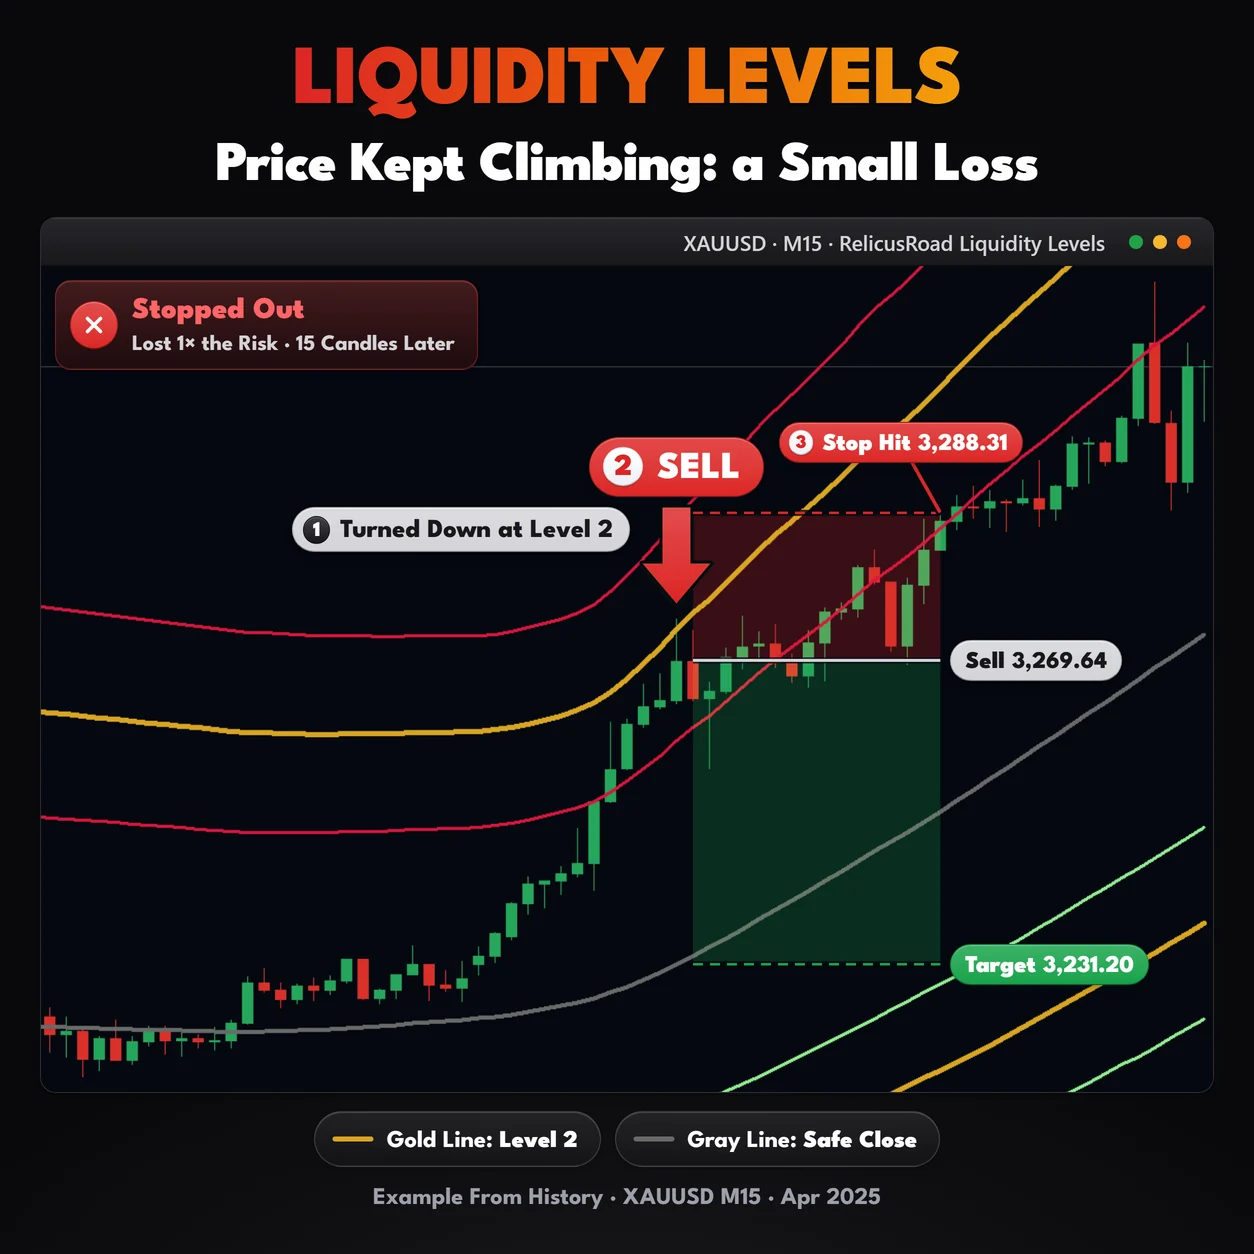
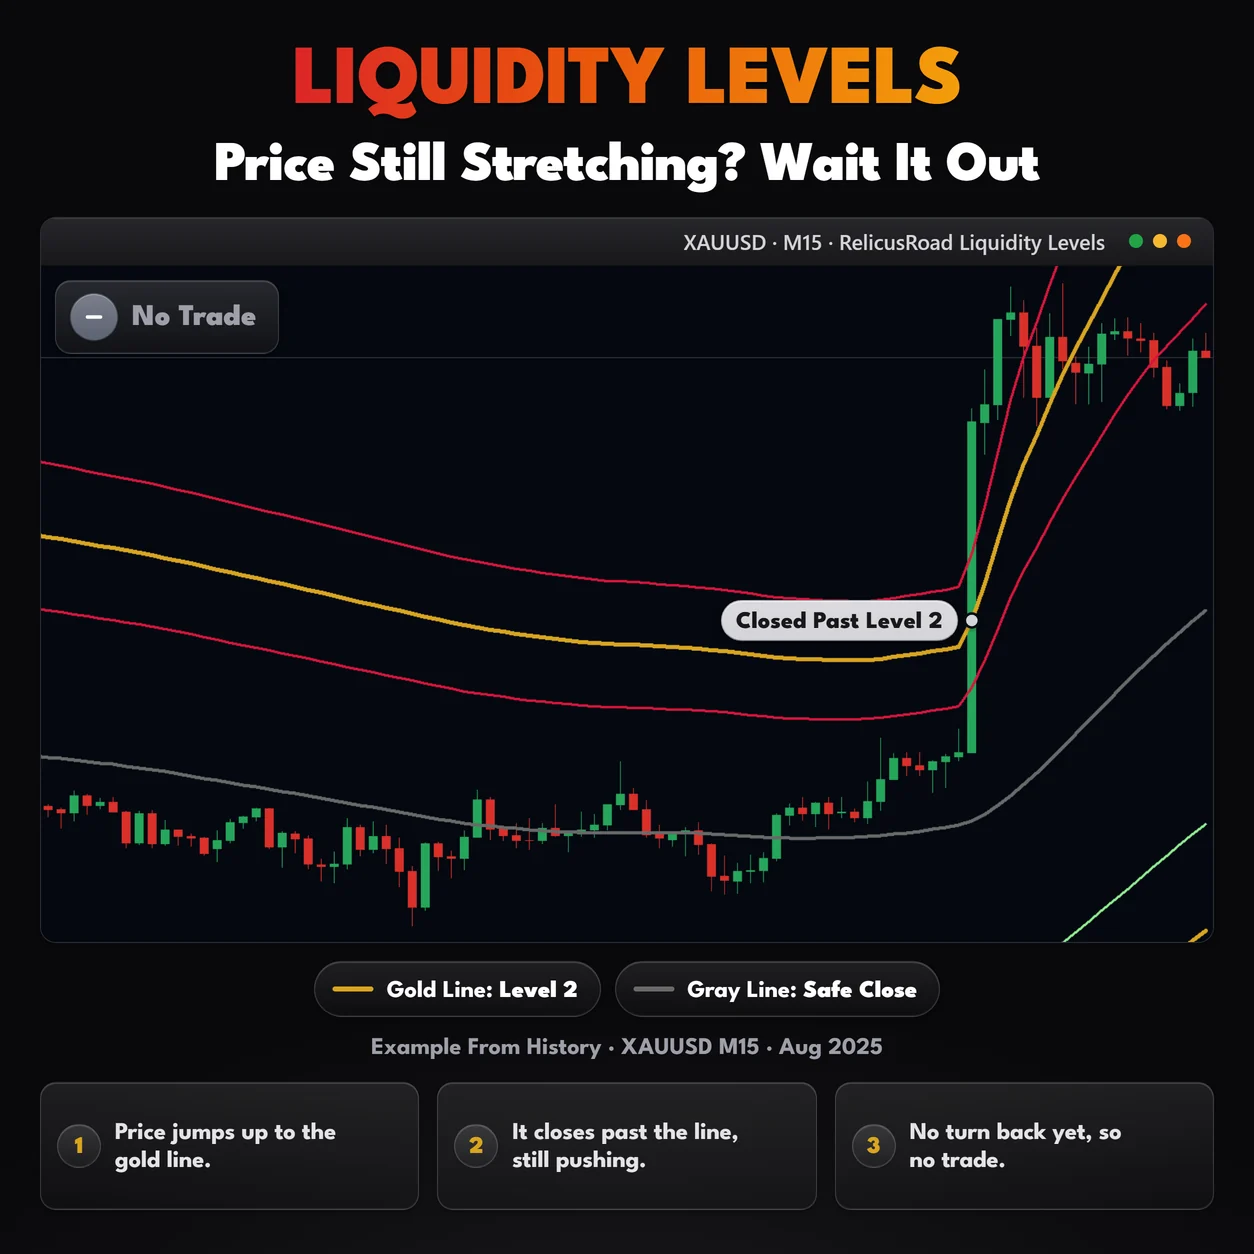
What It Does
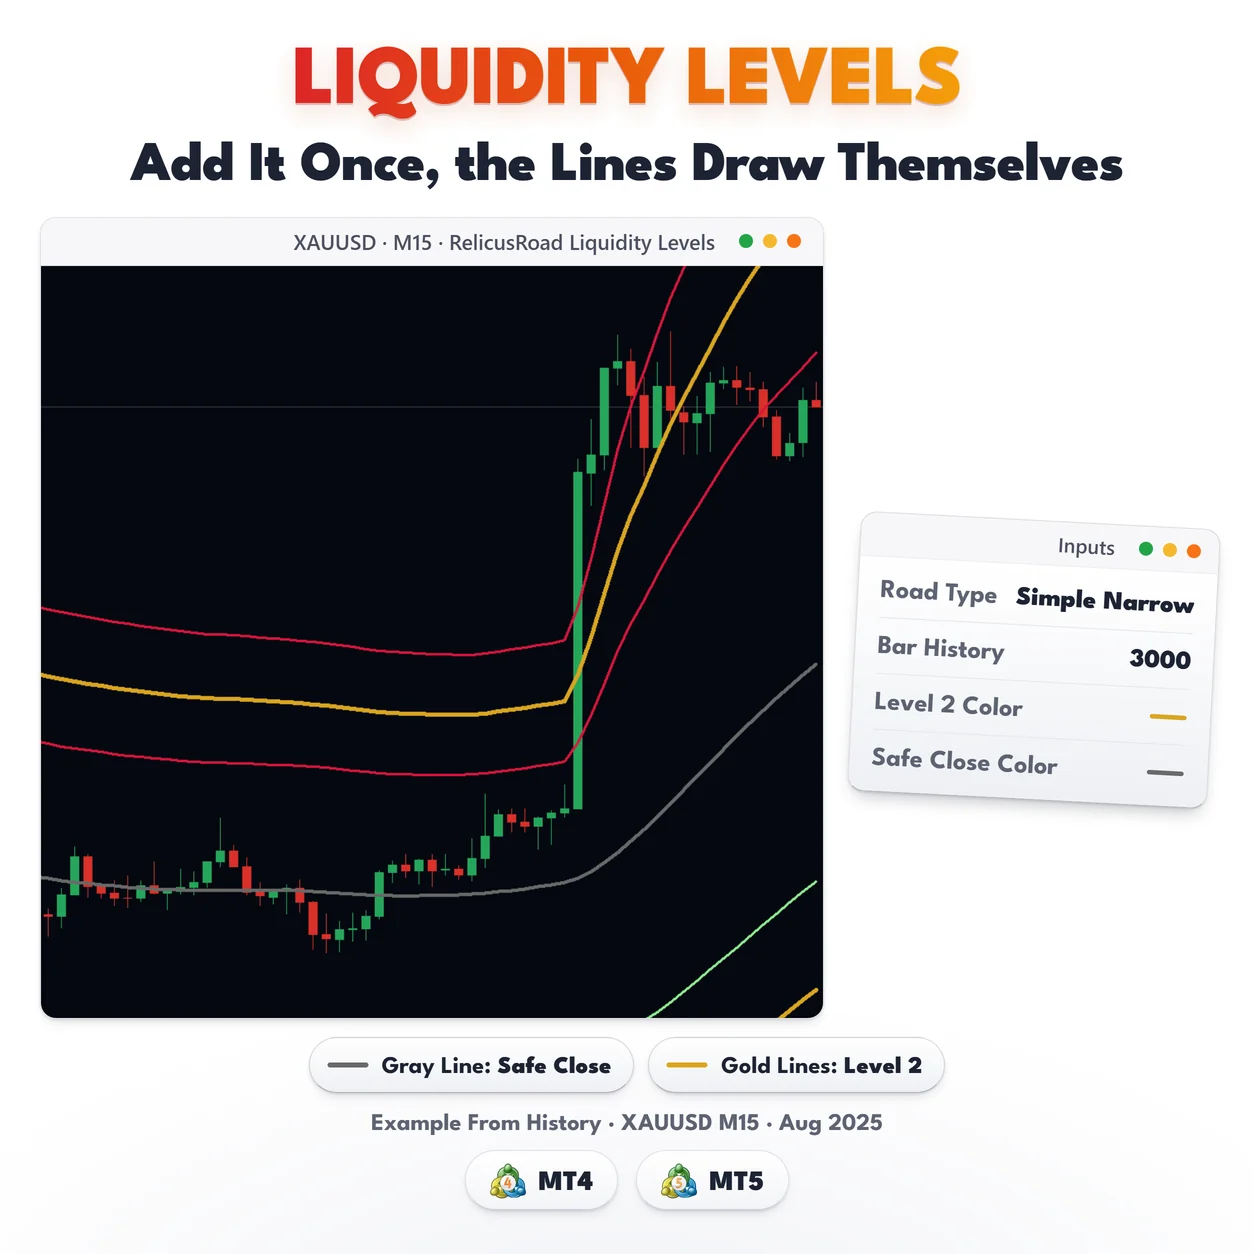
RelicusRoad draws a seven-line price channel on your MetaTrader chart. It shows you when price has stretched far from its recent balance point, and it marks where a target or a stop could sit.
Most channel tools give you a middle line and two edges. RelicusRoad gives you seven lines. An equilibrium line sits in the center, with three levels above it and three below, each one further out than the last.
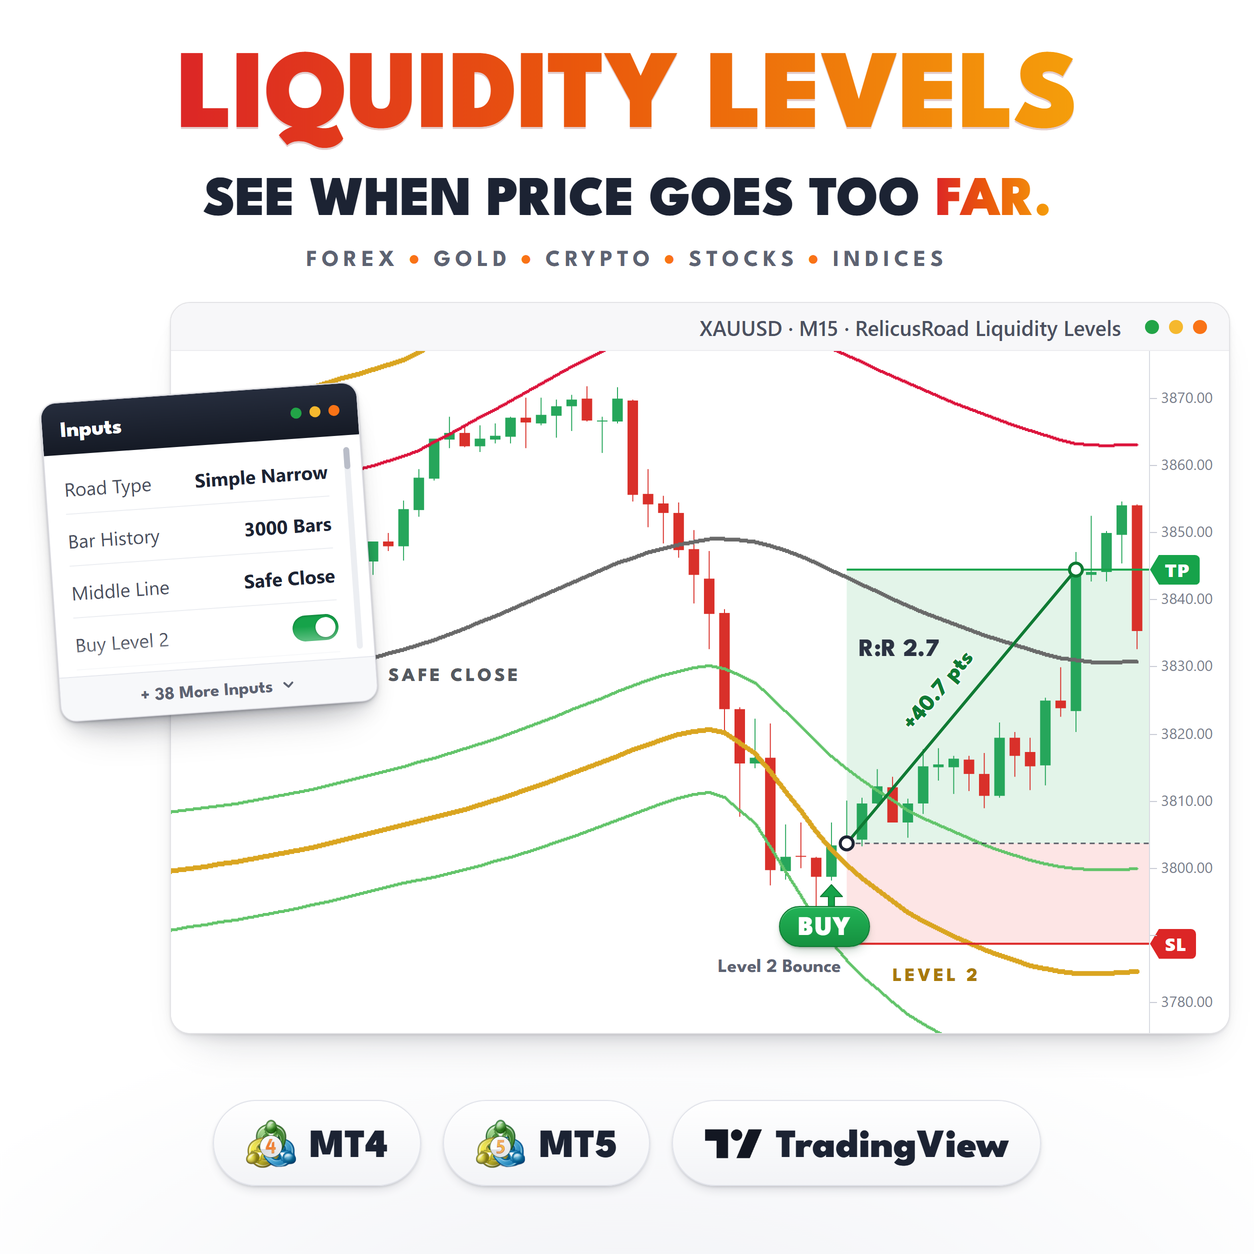
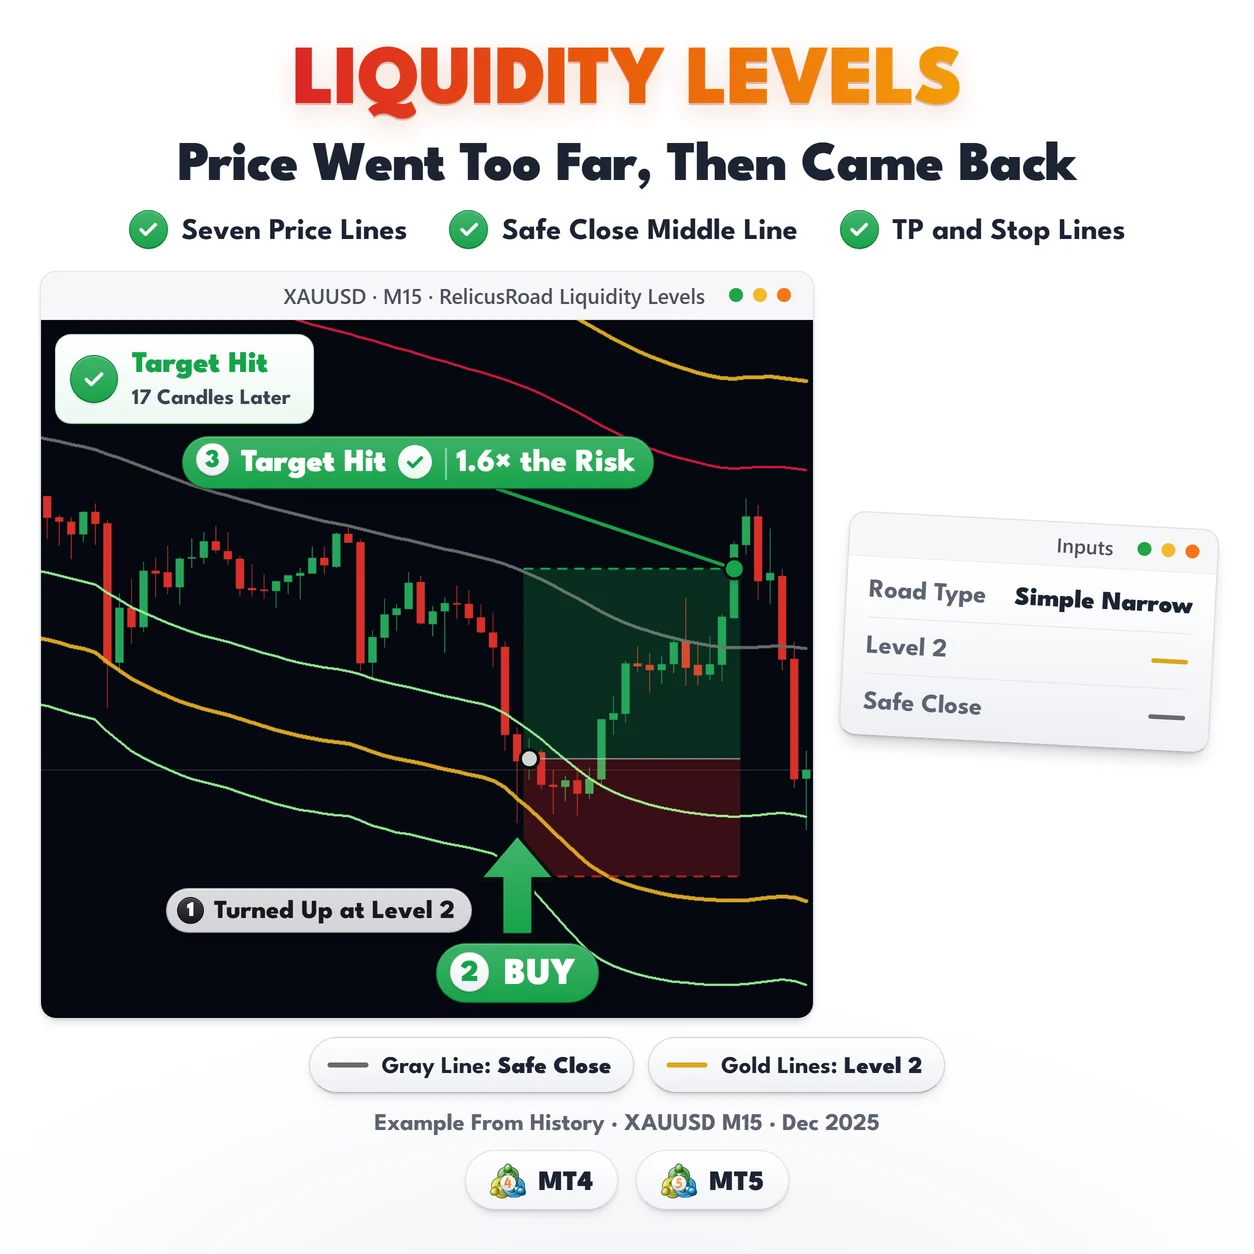
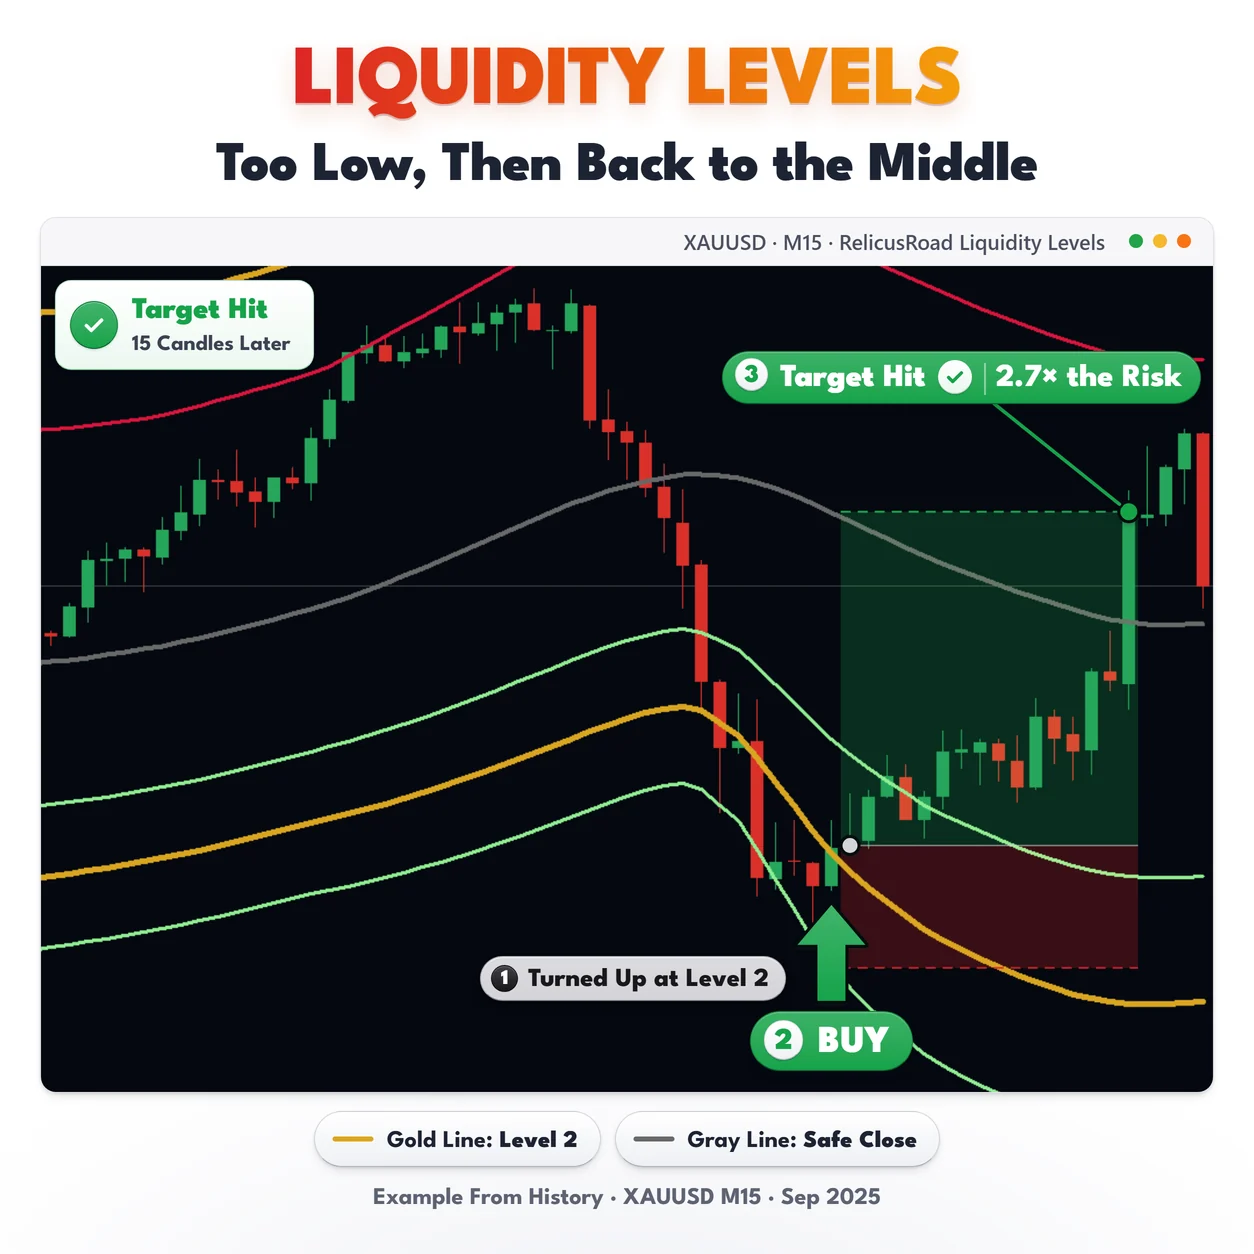
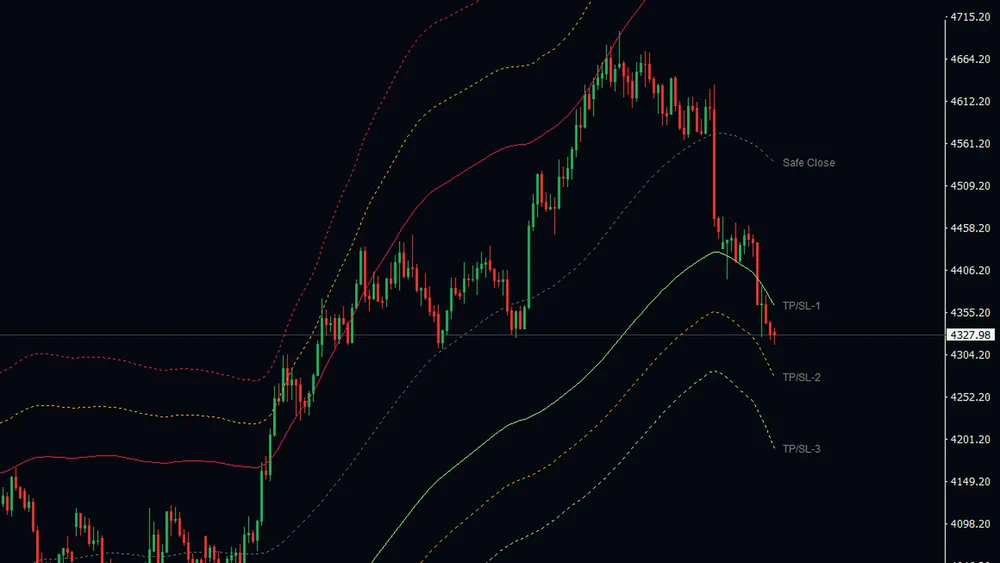
The center line is labeled Safe Close on the chart. The levels above it are called Sell levels and the ones below are Buy levels, labeled TP/SL-1 to TP/SL-3 in both directions. They are reference points for where a target or a stop might sit, not instructions.
It is a buffer-based indicator, so the lines run back across your history and the values are available
to any Expert Advisor that wants to read them.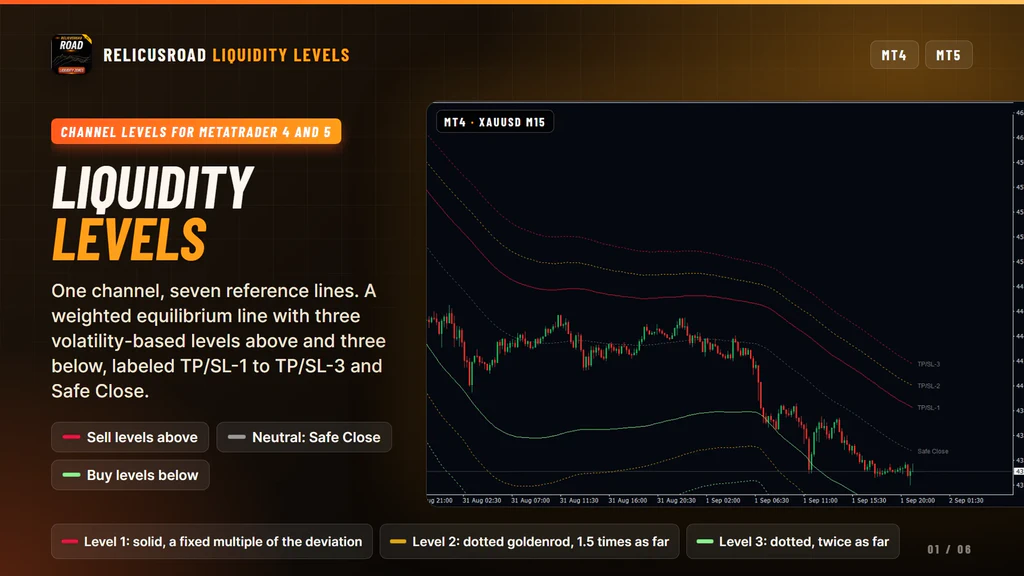
How It Works
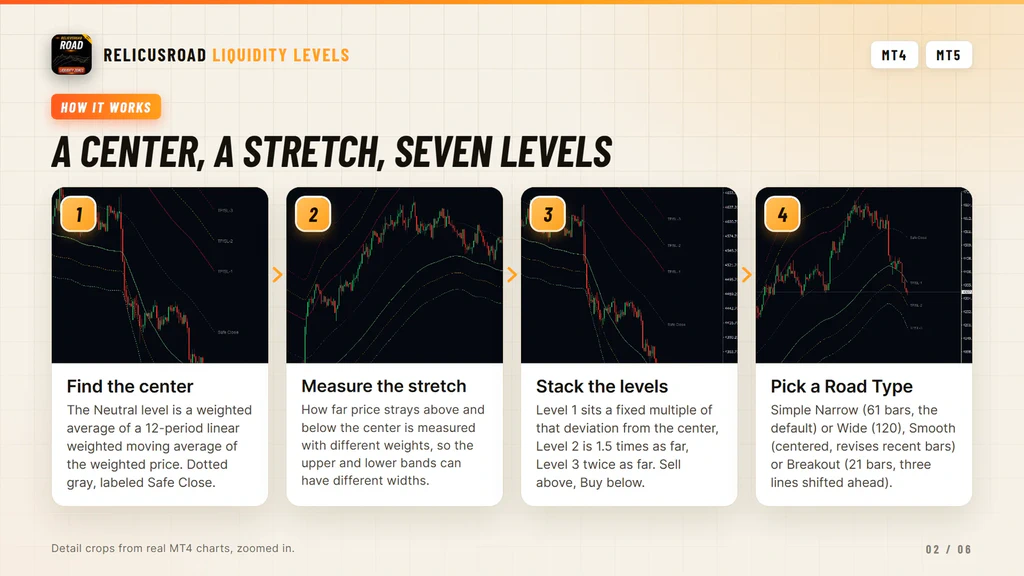
The center. The Neutral level is a weighted average of a 12-period linear weighted moving average of the weighted price. It sits where recent trading has balanced out, which is why the label calls it Safe Close.
The stretch. The indicator then measures how far price has strayed above and below that center. Upside and downside moves are weighted differently, so the two sides of the channel can end up with different widths. After a strong rise the upper side is usually the wider one.
The levels. Level 1 sits a fixed multiple of that deviation away from the center. Level 2 is 1.5 times as far and Level 3 twice as far. The same three distances are used above and below.
The type. Road Type picks one of five models, which changes the averaging window and the behavior:
| Road type | What it does |
|---|---|
| Simple Road Narrow | 61 past bars, seven lines with labels. The default |
| Simple Road Wide | The same over 120 bars, for a slower channel |
| Smooth Road Narrow | A centered 61-bar average that also uses later bars |
| Smooth Road Wide | The centered version over 120 bars |
| Trend/Breakout Road | 21 past bars, tighter bands, three lines shifted 21 bars to the right, no labels |
- Simple Road Narrow
- 61 past bars, seven lines with labels. The default
- Simple Road Wide
- The same over 120 bars, for a slower channel
- Smooth Road Narrow
- A centered 61-bar average that also uses later bars
- Smooth Road Wide
- The centered version over 120 bars
- Trend/Breakout Road
- 21 past bars, tighter bands, three lines shifted 21 bars to the right, no labels
What The Lines Measure
We would rather you knew this before you paid for it. The levels are volatility bands around a smoothed weighted average. They are not detected liquidity pools, order flow, resting stop clusters or anything read from the book.
That matters because it tells you how to read the output. A price at Sell Level 3 means price has stretched a long way from its own recent balance point, measured on this symbol and timeframe. It does not mean stops are sitting there.
The second thing to know is the repaint behavior, and it is your choice. The two Simple types never
read a bar later than the one they sit on, so nothing moves as the chart advances. Reload the chart
and recent bars are rebuilt from final prices, which can shift them slightly from what you watched
live. The two Smooth types center the average on the bar, which means they use later bars as well, and
their newest 61 or 120 bars are revised as price moves. Smooth looks better on history and is the
wrong choice if you need a value that never changes.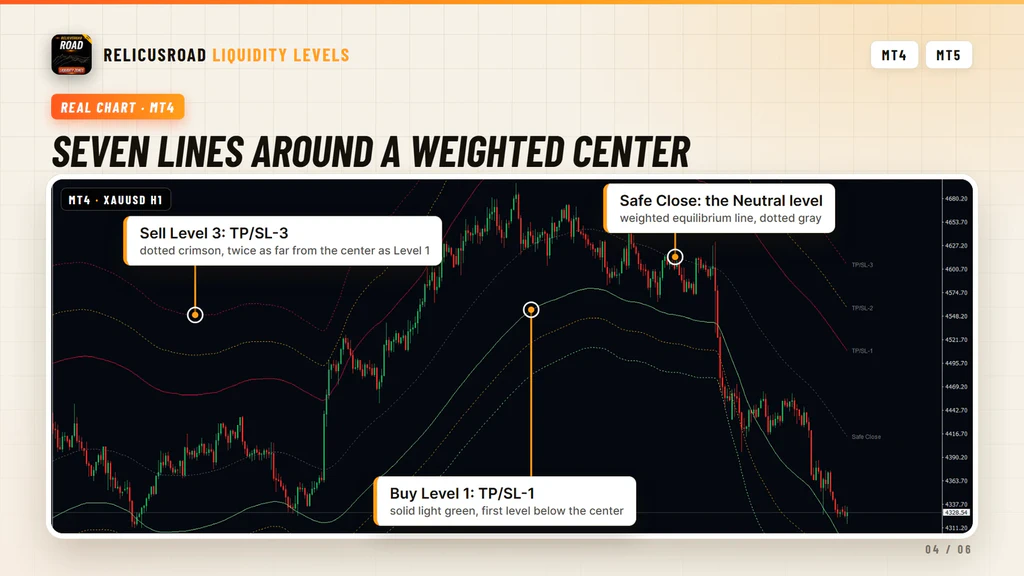
What You See On The Chart
| Element | What it tells you |
|---|---|
| Neutral line | The center, dotted dim gray, labeled Safe Close |
| Sell Level 1 | First level above the center, solid crimson, labeled TP/SL-1 |
| Sell Level 2 and 3 | Dotted goldenrod and dotted crimson, 1.5 and 2 times as far out |
| Buy Level 1 | First level below the center, solid light green |
| Buy Level 2 and 3 | Dotted goldenrod and dotted light green, further below |
| Labels | Small gray text two bars right of the current bar, on the Simple and Smooth types only |
| Breakout lines | Upper, center and lower lines projected 21 bars ahead of price. They use the Sell Level 1, Neutral and Buy Level 1 colors. On MetaTrader 5 the Data Window (press Ctrl+D) names them Buy Breakout Level, Range Breakout Zone and Sell Breakout Level |
- Neutral line
- The center, dotted dim gray, labeled Safe Close
- Sell Level 1
- First level above the center, solid crimson, labeled TP/SL-1
- Sell Level 2 and 3
- Dotted goldenrod and dotted crimson, 1.5 and 2 times as far out
- Buy Level 1
- First level below the center, solid light green
- Buy Level 2 and 3
- Dotted goldenrod and dotted light green, further below
- Labels
- Small gray text two bars right of the current bar, on the Simple and Smooth types only
- Breakout lines
- Upper, center and lower lines projected 21 bars ahead of price. They use the Sell Level 1, Neutral and Buy Level 1 colors. On MetaTrader 5 the Data Window (press Ctrl+D) names them Buy Breakout Level, Range Breakout Zone and Sell Breakout Level
Every line has its own color, width and style input, so you can leave the outer levels faint and make
the ones you trade from stand out.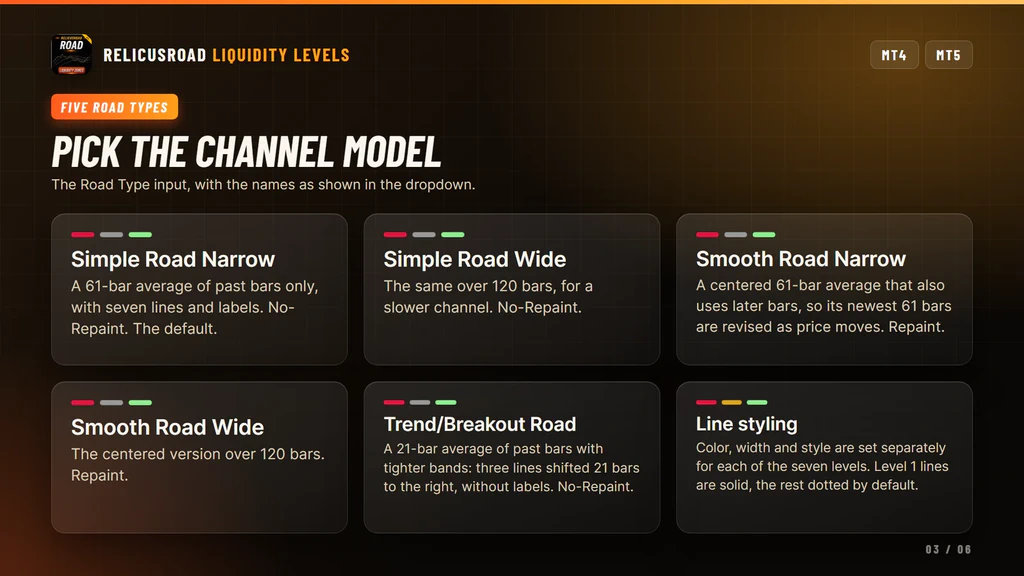
What It Does For Your Trading
Four things, each one you can check on a real chart before you trust it.
Marks The Balance Point Of Price
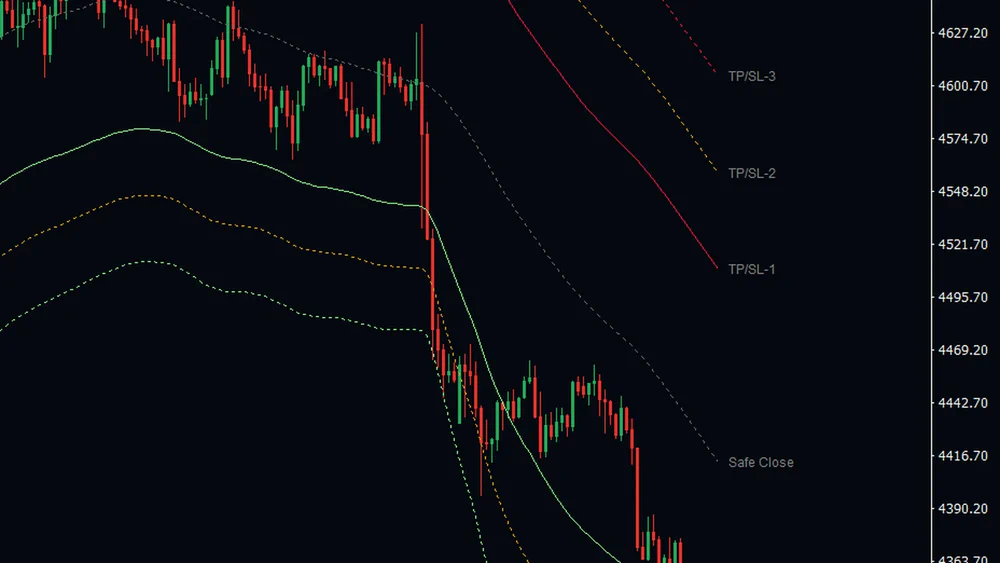
The dotted gray line through the middle is the Neutral level, a weighted average of a 12-period linear weighted moving average of the weighted price. Everything else on the chart is measured from it.
It answers a question you ask on every chart you open: where has price been settling lately, and is the current candle above or below that. One line, no interpretation needed.
Shows How Far Price Has Stretched
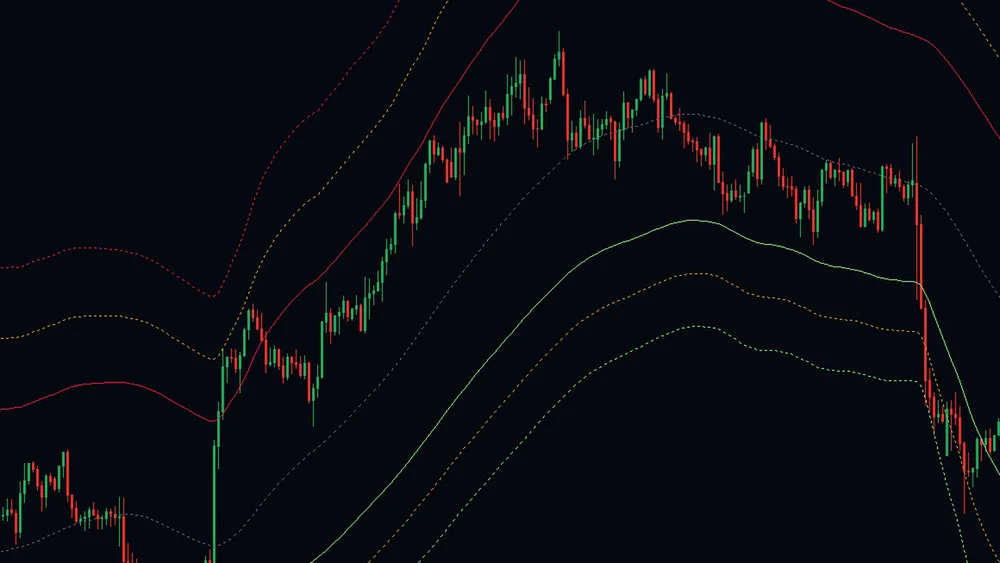
Three levels sit above the center and three below. Level 1 is a fixed multiple of the measured deviation, Level 2 is 1.5 times as far and Level 3 twice as far, so the spacing tells you how unusual the current distance from the center is.
Price at the outer line is a different situation from price at the inner one. You can see which it is without measuring anything yourself.
Labels Every Line At The Right Edge
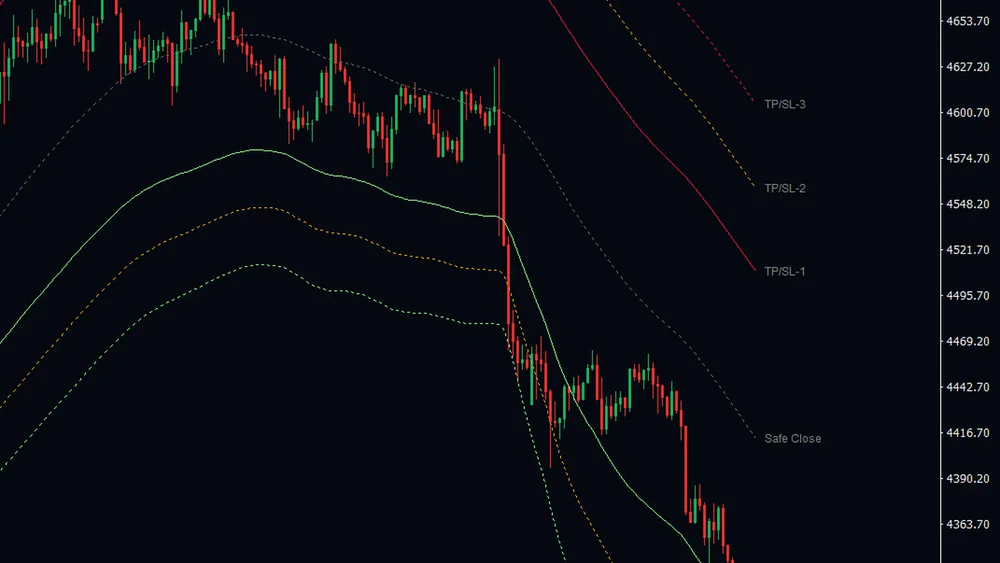
Small gray labels sit two bars to the right of the current bar, reading TP/SL-1 to TP/SL-3 on each side with Safe Close on the center. The Simple and Smooth types both carry them, and the label text is fixed.
When you are looking for a reference to put a target or a stop against, the candidates are already named next to price instead of being counted off the axis.
Keeps Past Values Where They Were
The default Simple types use past bars only, so a line that was drawn at a price stays at that price. The two Smooth types center their average on the bar, which reads better on history and revises their newest 61 or 120 bars as price moves.
The choice is yours and it is stated plainly in the input, which matters when you are backtesting. A channel that looked perfect on history because it used later bars is not a channel you can trade.
Reading It On A Live Chart
Treat the Neutral line as the balance point of recent prices and the outer levels as a measure of how far price has stretched away from it. The indicator does not label price as balanced or extended. That reading is yours.
Because the two sides are weighted differently, the distance from the center to Sell Level 1 is often not the distance to Buy Level 1. Comparing the two is a quick way to see which direction has been doing the work lately.
The Breakout type sits ahead of price by 21 bars, so the three lines you see at the current bar come
from an average of 21 bars earlier. It is a different way of looking at the same channel, not a
faster version of it.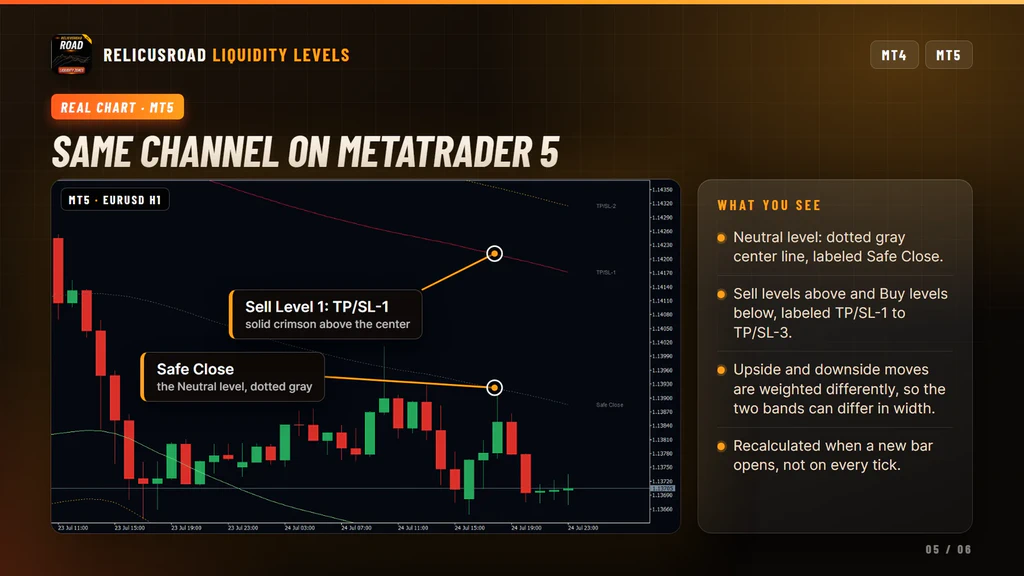
Settings You Can Change
Channel. Road Type, one of the five models above. Bar History, how many bars are calculated, 3000 by default and capped at 5000. A switch for each of the six outer levels, Sell Liquidity Level 1 to 3 and Buy Liquidity Level 1 to 3, plus one for the Neutral line.
Line styling. A color, a width from one to five pixels and a line style for each of the seven levels. Level 1 lines are solid by default and the rest are dotted.
There is one quirk to know. The label switches are cross-wired, so the labels on the upper lines follow the Buy switches and the labels on the lower lines follow the Sell switches. If a label will not go away, toggle the other side.
What It Does Not Do
Worth knowing before you buy:
- It does not detect liquidity, order flow or stop clusters. The levels are volatility bands.
- It does not show seven lines on every type. Breakout Road computes Level 1 only and draws three.
- It does not keep Smooth values fixed. Those two types revise their newest 61 or 120 bars.
- It does not rename the labels. The ROADLINES NAMES inputs have no effect on the chart text.
- It does not deliver alerts in this build.
- It does not align a higher timeframe to chart time, so keep it on the timeframe you are viewing.
- It does not always clear its labels when you remove it. Delete any leftover text from the chart object list if you see it.
- It does not fill the oldest bars of the window, since the average needs its own bars first.
Setup In Three Steps
- Buy it on the MQL5 Market and install it from the Market tab of your terminal.
- Drag RelicusRoad from Navigator, Indicators, Market onto a chart and leave Road Type on Simple Road Narrow to begin with.
- Compare Simple Road Wide and the Breakout type on the same chart before settling on one.
It runs on forex, gold, indices and crypto, on any chart timeframe. The channel is recalculated when a
new bar opens, not on every tick.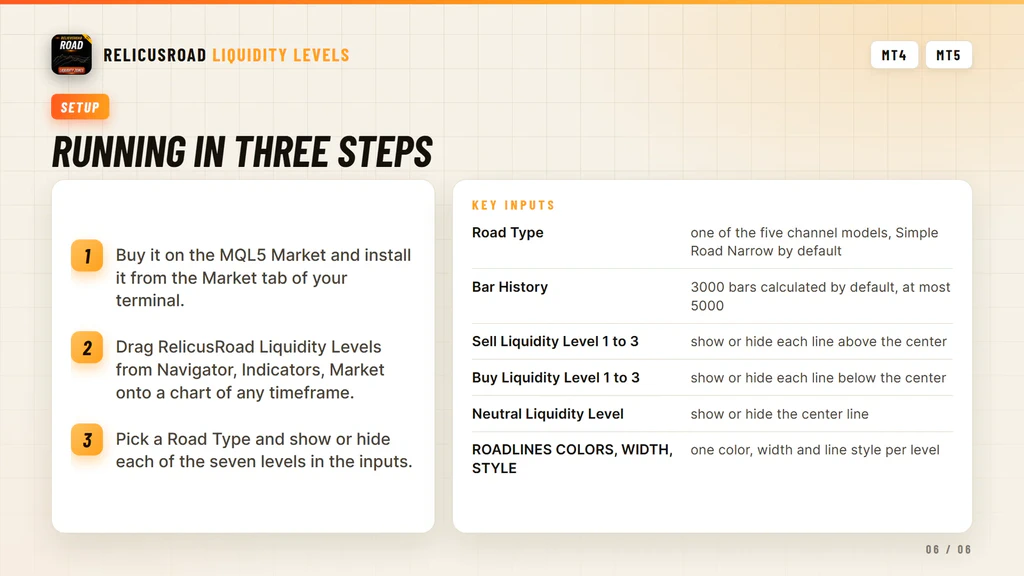
Where It Comes From
The Road channel is the core of RelicusRoad Pro. This listing publishes that channel on its own, for traders who want the levels without the rest of the system. It runs standalone.
The channel works well next to horizontal structure. For zones built from tested swings, see Support Resistance, and for the areas a fast move started from, see Order Blocks.
Support runs through the product comments and the mql5.com messaging system.
Frequently Asked Questions
Everything you need to know about RelicusRoad. Still curious? Reach out anytime.
Learn How to Trade It
Every indicator ships with reference documentation and a matching strategy guide. You can also read what other traders say or start with the setup guide.
Indicator Reference
- Road Levels Dynamic S/R levels around a moving center line
- Support & Resistance Advanced S/R zones with alerts
- Action Levels Critical price levels for major moves
- Signal Lines Trend bias filter with two independent lines
- Daily High/Low/Open Daily extremes for range trading
- Daily Pivots Pro pivot points S1-S3, R1-R3
Trading Strategies
- Strategy #1: Price Action (Road) + SR + Trendlines + 2 TFs
- Strategy #2: Local Trendline + Price Position on Road + 2 TFs
- Strategy #3: Arrows + Price Action (Road) + SR
- Strategy #4: MicroScalping + Multiple Pairs + Daily Target 2-10%
Trading Guides
- Non-Repaint Forex Indicators: What 'Non-Repaint' Actually Means (and How to Verify It)
- Prop Firm Challenges: The 'Slow Boring' Strategy to Getting Funded
- Market Sessions Trading: How to Time the 'London-NY Overlap'
- What Is Forex Trading and How Does It Work?
- The Real Cost of Trading Platforms in 2026: A Broker-Neutral Teardown
- Position Sizing: The Boring Math That Keeps Traders Alive
- Forex Trading Psychology: 7 Traps and Process Fixes
Related tools
Single RelicusRoad indicators for MT4 and MT5, each one standalone.